. 2014 Nov 6:4:6930.
doi: 10.1038/srep06930.

Profiling status epilepticus-induced changes in hippocampal RNA expression using high-throughput RNA sequencing

Affiliations

Profiling status epilepticus-induced changes in hippocampal RNA expression using high-throughput RNA sequencing

Katelin F Hansen et al. Sci Rep. .

Abstract

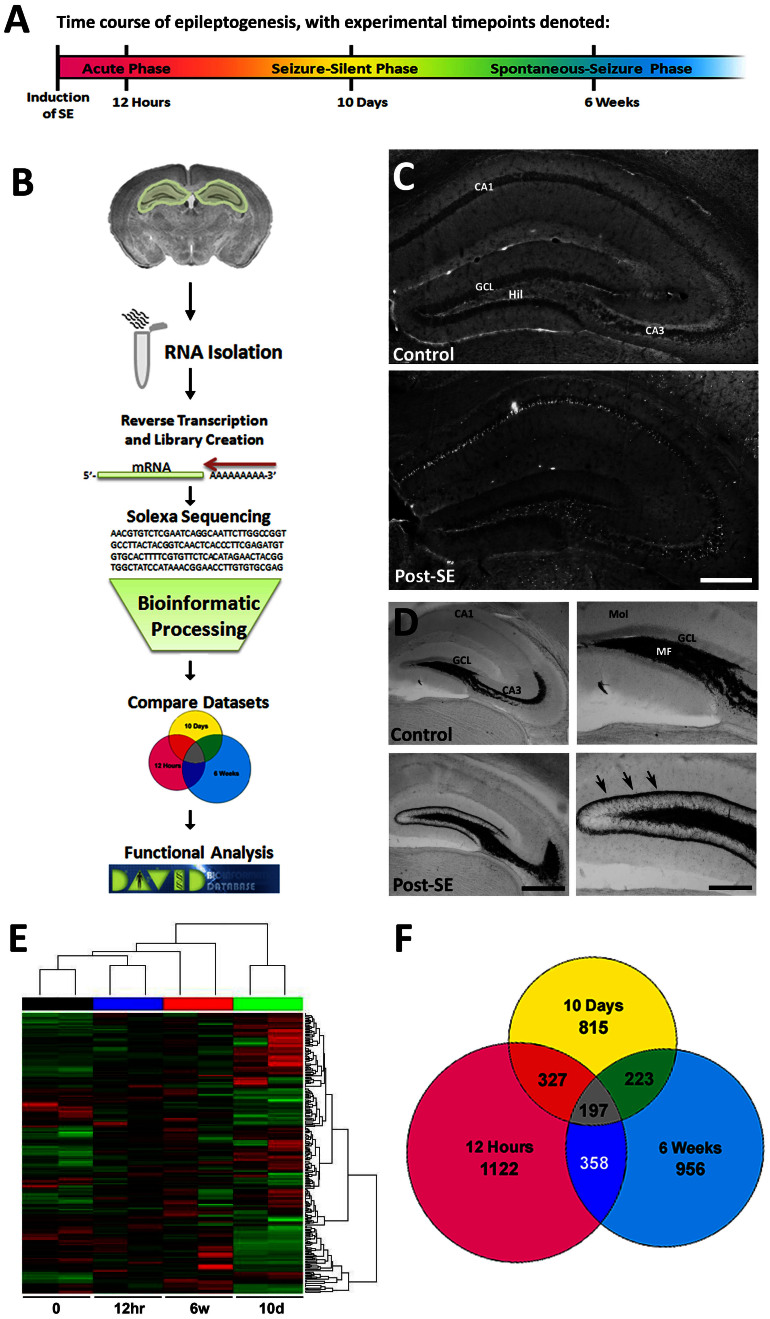
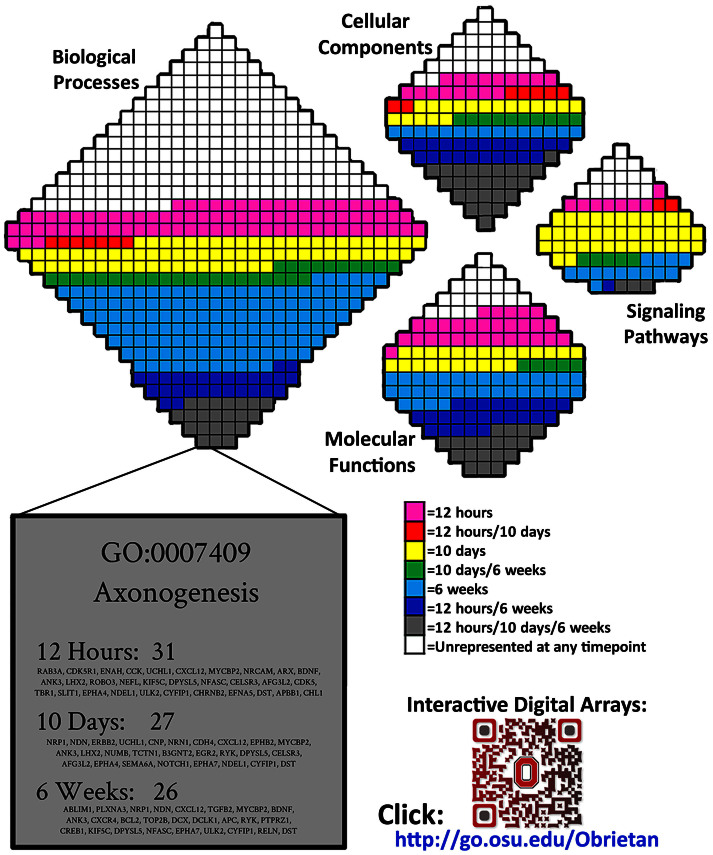
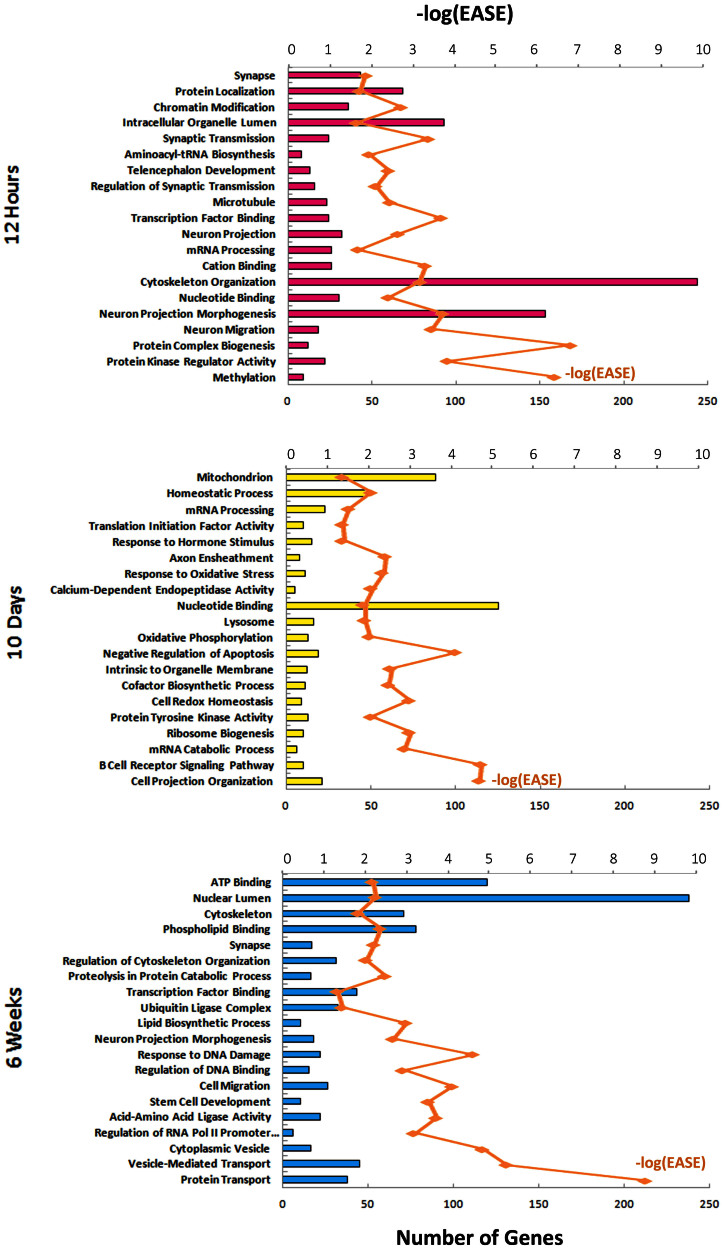
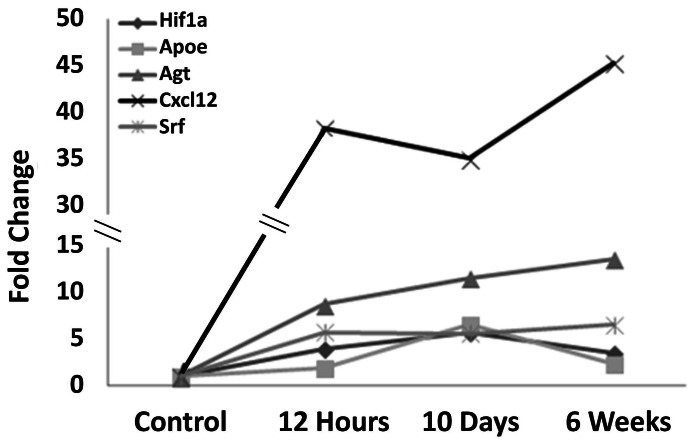
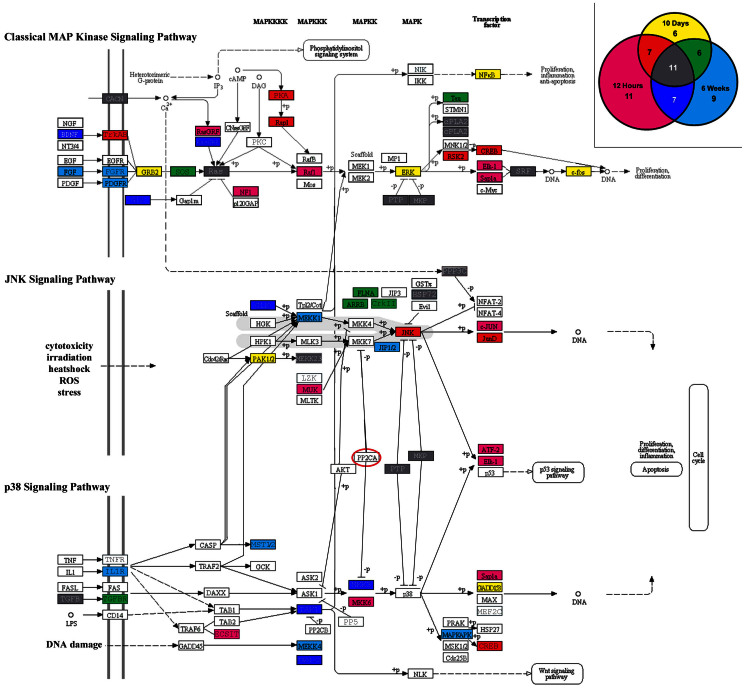
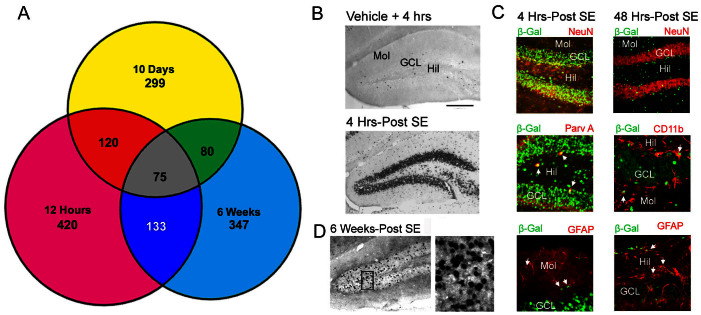
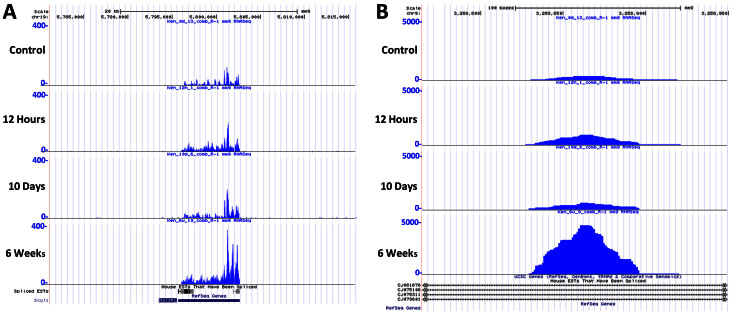
Status epilepticus (SE) is a life-threatening condition that can give rise to a number of neurological disorders, including learning deficits, depression, and epilepsy. Many of the effects of SE appear to be mediated by alterations in gene expression. To gain deeper insight into how SE affects the transcriptome, we employed the pilocarpine SE model in mice and Illumina-based high-throughput sequencing to characterize alterations in gene expression from the induction of SE, to the development of spontaneous seizure activity. While some genes were upregulated over the entire course of the pathological progression, each of the three sequenced time points (12-hour, 10-days and 6-weeks post-SE) had a largely unique transcriptional profile. Hence, genes that regulate synaptic physiology and transcription were most prominently altered at 12-hours post-SE; at 10-days post-SE, marked changes in metabolic and homeostatic gene expression were detected; at 6-weeks, substantial changes in the expression of cell excitability and morphogenesis genes were detected. At the level of cell signaling, KEGG analysis revealed dynamic changes within the MAPK pathways, as well as in CREB-associated gene expression. Notably, the inducible expression of several noncoding transcripts was also detected. These findings offer potential new insights into the cellular events that shape SE-evoked pathology.


Figures

Figure 1
Figure 1. Differential expression of mRNA across phases of epileptogenesis.
(A) Timeline depicts tissue collection across the progression of epileptogenesis. Animals were sacked 12 hours, 10 days, and 6 weeks after pilocarpine induction of status epilepticus (SE). These timepoints correspond to the acute, seizure-silence and spontaneous-seizure phases, respectively, paralleling the time course of pathogeneses. (B) Schematic outline of processing and analysis procedures. Hippocampal tissue was collected from each time point, and RNA was isolated and cDNA libraries were created. Libraries were sequenced, and subsequent datasets were filtered and compared to controls to yield fold changes across experimental groups. Genes showing changes in regulation were examined for differential functionality using the Database for Annotation, Visualization, and Integrated Discovery (DAVID) v6.7. (C) At 2 days post-SE, Fluoro-Jade B labeling revealed cell death within CA1, CA3 subfields and the hilar region (Hil) of the hippocampus. GCL, granule cell layer. Scale bar: 200 μm. (D) Timm staining revealed reorganization of mossy fiber projections within the hippocampus 6 weeks after the induction of SE. Arrows indicate mossy fiber sprouting within the intermolecular layer. Mol, molecular layer; MF, mossy fibers. Scale bars: 200 μm (left); 100 μm (right). (E) Hierarchical cluster analysis of differentially expressed genes between control, 12-hour, 10-day, and 6-week samples (q < 0.05). Increases in expression are indicated in red hues and decreases are in green hues. (F) Venn diagram showing the number of genes with significant upregulation (q < 0.05) in each time point. Color schemes representing each time point are used in all subsequent figures.
Figure 2
Figure 2. Functional profiling of upregulated genes.
DAVID categories of upregulated genes were arranged into functional arrays to illustrate the proportions of four ontological domains (‘Molecular Functions’, ‘Cellular Components’, ‘Biological Processes', and ‘Signaling Pathways') dominated by each phase of epileptogenesis. Each category is represented by a single square, and the color of the square denotes whether, and when, its expression profile was affected following SE (using the color scheme established in Figure 1D). An interactive digital version of this figure that details each category is available in Supplemental Fig. 3 (Chrome web browser or iPad tablet recommended for greatest compatibility). A single square (GO:0007409 Axonogenesis), has been magnified and presented as an example here. Each square contains the total number of genes upregulated at each time point, followed by the names of those genes. In Supplemental Fig. 3, each square can be zoomed in to view its ontological term, as well as the names of all the genes upregulated in that category at each timepoint. The total number of upregulated genes at each timepoint is also provided. Genes upregulated at 6-weeks showed the broadest range of biological processes. In contrast, expression changes at the two earlier time points had more a focused range of processes. Relatively little overlap in function was observed between time points. http://obrietanlab.org.ohio-state.edu/.
Figure 3
Figure 3. Enriched ontological clusters across epileptogenesis.
The top 20 enriched clusters of DAVID categories are reported for the 12-hour, 10-day, and 6-week timepoints. Clusters were sorted by enrichment score and the number of upregulated genes within each cluster is reported as bars corresponding to the lower axis. In addition, EASE Scores (DAVID's modified Fischer Exact P-value) for each cluster are depicted as a measure of the association strength of genes within each cluster with a line graph corresponding to the upper axis.
Figure 4
Figure 4. A subset of functionally-associated genes are upregulated at 12 hours, 10 days, and 6 weeks post-SE.
DAVID analysis revealed an enrichment of upregulated genes associated with ‘blood vessel development’ across all phases of epileptogenesis. Here, relative fold changes are presented for the top five genes upregulated within this cluster.
Figure 5
Figure 5. Functional enrichment of genes involved in the MAP Kinase signaling pathways.
Pathway analysis of upregulated genes indicated an enrichment within the MAPK signaling pathway. The relevant genes from each timepoint were mapped onto an adapted version of the Kyoto Encyclopedia of Genes and Genomes (KEGG) MAPK pathway. Signaling cascades associated with classical ERK1/2, JNK, and p38 signaling are indicated. A Venn diagram (inset) indicates the proportions of MAPK-associated genes that were upregulated at each timepoint.
Figure 6
Figure 6. Temporal and cell-type profile of SE-evoked, CREB-mediated, gene expression.
(A) Data from a genome-wide analysis of CREB occupancy by ChIP-Seq was used to determine the proportion of upregulated epileptogenic genes that are CREB-associated. Venn diagram depicts subsets of genes at each timepoint. (B) Representative immunohistochemical labeling of tissue from CRE-β-Gal transgenic mice reveals robust reporter gene expression within the GCL at 4 hrs post-SE onset. Mol: molecular cell layer; GCL: granular cell layer; Hil: hilus. Bar: 50 microns. (C) Double immunofluorescence labeling for β-Gal and NeuN or parvalbumin A (Parv A) revealed that the reporter gene was inducibly expressed in both excitatory and inhibitory neurons at the 4 hour time point. Limited transgene expression was also observed in astrocytes, as assessed via GFAP double labeling. At 2 days post-SE (right panels), limited β-gal was detected in GCL neurons; rather, the reporter was detected in astrocytes and microglia, as assessed via GFAP and CD11b double-labeling. (D) Representative data from animals that were rendered epileptic (sacrificed at 6 weeks post-SE) revealed marked CRE-mediated gene expression within the GCL.
Figure 7
Figure 7. Upregulation of predicted noncoding RNAs after induction of SE.
Representative predicted noncoding regions showing increased transcription across epileptogenesis. The UCSC Genome Browser was used to visualize tag counts from each timepoint. (A) Increased expression of the MALAT1 long noncoding RNA. (B) An intergenic transcript showing increased expression during the chronic phase of epileptogenesis.

References

    1. Gaitanis J. N. & Drislane F. W. Status epilepticus: a review of different syndromes, their current evaluation, and treatment. Neurologist 9, 61–76, 10.1097/01.nrl.0000051445.03160.2e (2003). - DOI - PubMed
    1. Turski L., Ikonomidou C., Turski W. A., Bortolotto Z. A. & Cavalheiro E. A. Review: cholinergic mechanisms and epileptogenesis. The seizures induced by pilocarpine: a novel experimental model of intractable epilepsy. Synapse 3, 154–171, 10.1002/syn.890030207 (1989). - DOI - PubMed
    1. Okazaki M. M., Evenson D. A. & Nadler J. V. Hippocampal mossy fiber sprouting and synapse formation after status epilepticus in rats: visualization after retrograde transport of biocytin. J Comp Neurol 352, 515–534, 10.1002/cne.903520404 (1995). - DOI - PubMed
    1. Rigau V. et al. Angiogenesis is associated with blood-brain barrier permeability in temporal lobe epilepsy. Brain 130, 1942–1956, 10.1093/brain/awm118 (2007). - DOI - PubMed
    1. Frantseva M. V. et al. Oxidative stress is involved in seizure-induced neurodegeneration in the kindling model of epilepsy. Neuroscience 97, 431–435, 10.1016/S0306-4522(00)00041-5 (2000). - DOI - PubMed

Publication types

MeSH terms