. 2014 Oct 23;9(2):591-604.
doi: 10.1016/j.celrep.2014.09.032. Epub 2014 Oct 16.

Nonclassical Ly6C(-) monocytes drive the development of inflammatory arthritis in mice

Affiliations

Nonclassical Ly6C(-) monocytes drive the development of inflammatory arthritis in mice

Alexander V Misharin et al. Cell Rep. .

Abstract

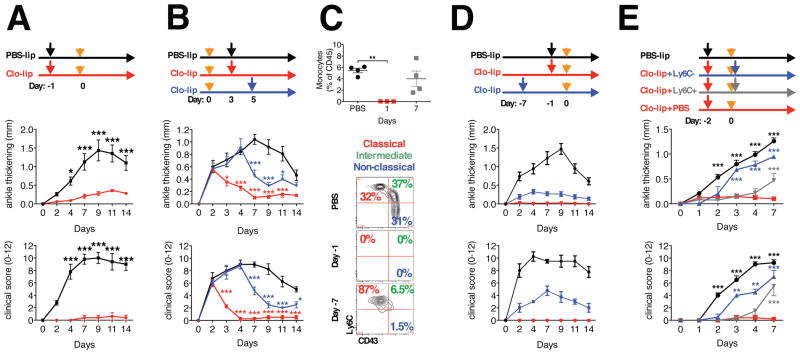
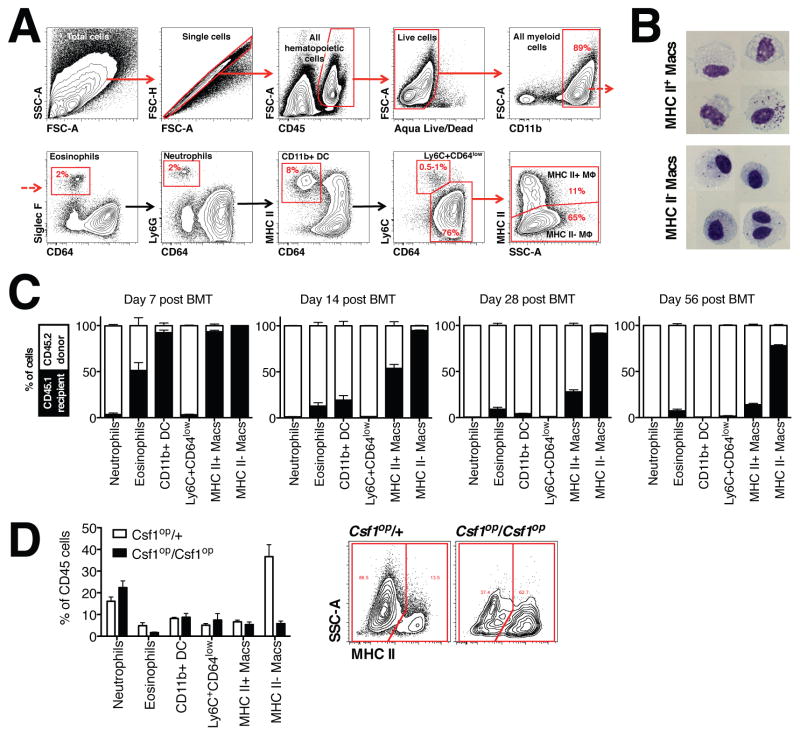
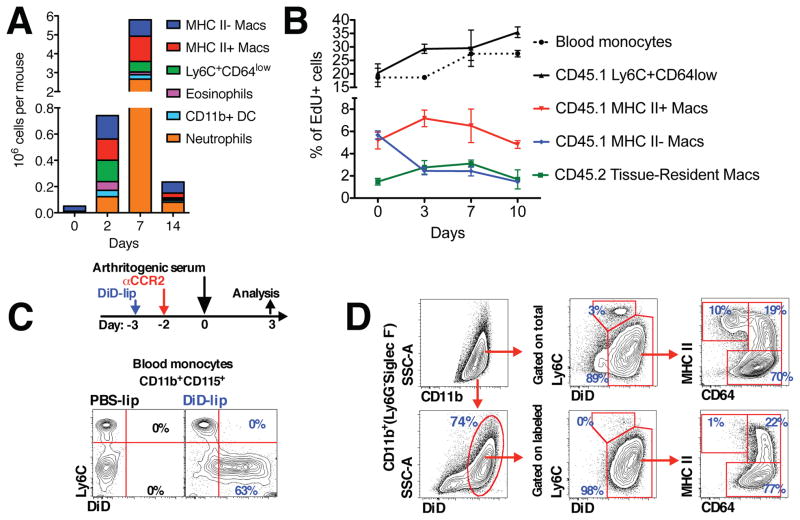
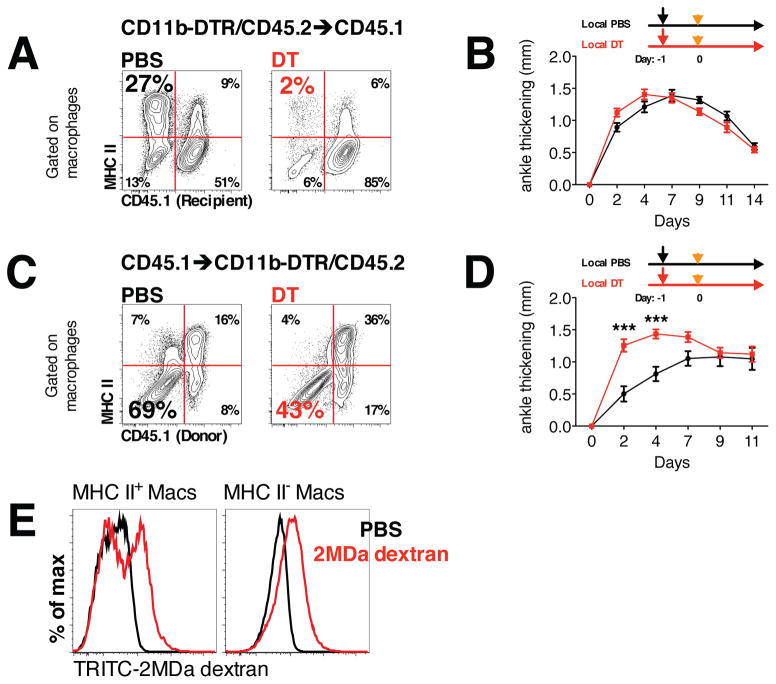
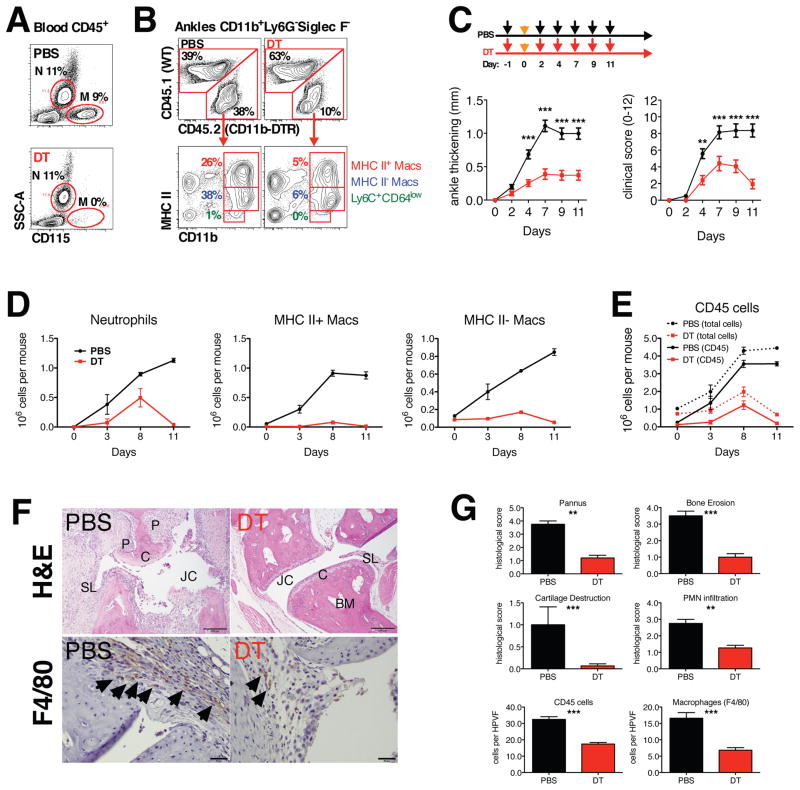
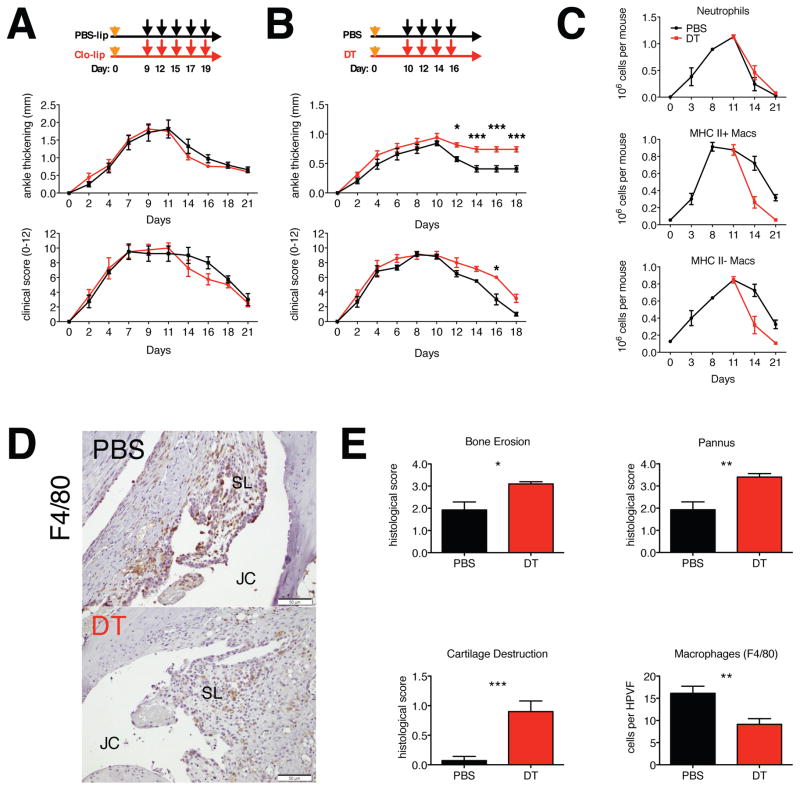
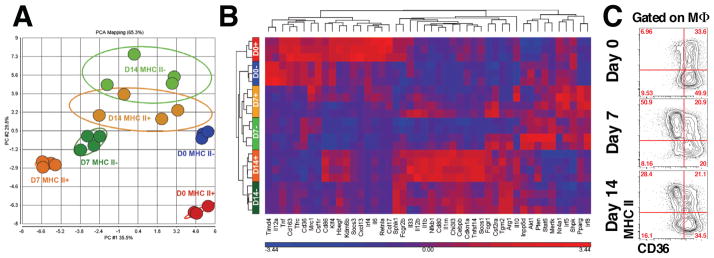
Different subsets and/or polarized phenotypes of monocytes and macrophages may play distinct roles during the development and resolution of inflammation. Here, we demonstrate in a murine model of rheumatoid arthritis that nonclassical Ly6C(-) monocytes are required for the initiation and progression of sterile joint inflammation. Moreover, nonclassical Ly6C(-) monocytes differentiate into inflammatory macrophages (M1), which drive disease pathogenesis and display plasticity during the resolution phase. During the development of arthritis, these cells polarize toward an alternatively activated phenotype (M2), promoting the resolution of joint inflammation. The influx of Ly6C(-) monocytes and their subsequent classical and then alternative activation occurs without changes in synovial tissue-resident macrophages, which express markers of M2 polarization throughout the course of the arthritis and attenuate joint inflammation during the initiation phase. These data suggest that circulating Ly6C(-) monocytes recruited to the joint upon injury orchestrate the development and resolution of autoimmune joint inflammation.


Figures

Figure 1
Figure 1. Role of monocytes in the initiation and development of STIA
A. Depletion of monocytes using clodronate-loaded liposomes prevents initiation and development of STIA (n = 5). Orange arrows indicate injection of K/BxN serum, black and red – PBS and clodronate-loaded liposomes correspondingly. B. Depletion of monocytes during development of STIA (n = 4) leads to its abrupt ending. Mice were treated with clodronate-loaded liposomes at indicated time points. Orange arrows indicate injection of K/BxN serum, black, blue and red – PBS and clodronate-loaded liposomes correspondingly. C–D. Absence of Ly6C monocytes prevents STIA. Monocytes were depleted using clodronate-loaded liposomes. C. Representative contour plots gated on CD45+CD115+CD11b+ blood cells (numbers represent percentages of the parent population). D. Representative arthritis scores (n = 4). E. Adoptive transfer of Ly6C monocytes restores STIA. Monocytes were depleted with clodronate-loaded liposomes (red arrows) and 48 hours later 1×10⁶ classical Ly6C+ (n = 4) (grey arrow) or 0.5×10⁶ non-classical Ly6C (n = 2) (blue arrow) monocytes sorted from bone marrow or PBS (control) were transferred via intravenous injection, immediately following injection of K/BxN serum (orange arrows) to induce STIA. Another cohort of control mice was treated with PBS-loaded liposomes (n = 4) (black arrow). All data are represented as mean ± SEM. Differences between groups were compared using two-way ANOVA for repeated measurements, with Bonferroni post-test, * p<0.05, ** p <0.01, *** p<0.001.
Figure 2
Figure 2. Characterization of synovial macrophages under steady state conditions in the mouse joint
A. Flow cytometry analysis of a mouse joint during steady state conditions. Numbers on the contour plots represent percentages of CD45+ cells. B. Photomicrographs of sorted MHC II+ and MHC II macrophages. Scale bar 5 μm. C. MHC II macrophages exhibit radioresistance and do not require input from bone marrow. Bone marrow transfer (n=4 per time point) was performed as described in the Methods. D. Left panel: Number of MHC II macrophages was dramatically reduced in the synovium of Cfs1op/op mice (n = 4). Right panel: Representative contour plots showing decrease of MHC II macrophages in the synovium. Numbers on the contour plots represent percentages of the parent population (macrophages).
Figure 3
Figure 3. Origin of inflammatory macrophages in the arthritic joint
A. Dynamics of the individual cell subsets in the synovium during the course of STIA (n = 4). B. Analysis of EdU incorporation during the course of STIA. Arthritis was induced in bone marrow chimeras with shielded ankles as described in the Supplemental Methods section. C. Non-classical Ly6C monocytes were labeled as described in the Methods section. Representative contour plots are shown and numbers represent percentages of monocytes. D. Non-classical Ly6C monocytes are recruited to the arthritic joint and give rise to both MHC II+ and MHC II macrophages. Data are represented as mean ± SEM.
Figure 4
Figure 4. Role of tissue-resident macrophages in the initiation of STIA
A. Local injection of DT depletes donor-derived macrophages in CD11b-DTR→CD45.1 bone marrow chimeric mice. Representative contour plots gated on macrophages are shown (numbers indicate percentages of the parent population). B. Depletion of MHC II+ macrophages does not affect initiation and development of STIA (n = 5). C. Local injection of DT depletes host macrophages in CD45.1→CD11b-DTR bone marrow chimeric mice and does not affect donor-derived macrophages. Representative contour plots gated on macrophages are shown (numbers indicate percentages of the parent population). D. Depletion of MHC II macrophages accelerate development of STIA (n = 10). Data are represented as mean ± SEM. Differences between groups were compared using two-way ANOVA for repeated measurements, with Bonferroni post-test, * p<0.05, ** p <0.01, *** p<0.001. E. Phagocytosis of high molecular weight TRITC-labeled dextran by subpopulations of myeloid cells in the naïve mouse joint. Representative histograms are shown.
Figure 5
Figure 5. Recruitment of monocytes and differentiation into macrophages are required for development of joint pathology during STIA
A Systemic treatment with DT eliminated blood monocytes while sparing neutrophils. Representative contour plots are shown. Numbers represent percentages of CD45+ cells. B. Systemic treatment with DT eliminates DTR-expressing tissue macrophages (CD45.2) in the synovium of CD11b-DTR(CD45.2)→CD45.1 bone marrow chimeras. Representative contour plots are shown and numbers indicate percentages of CD45+ cells. C. Repeated administration of DT decreases severity of arthritis (n = 10). D. Continuous treatment with DT decreased number of cells recruited to the joint (n=4 per time point). E. Dynamic of myeloid cell subsets in the joints during the course of STIA in PBS and DT-treated mice. F. Depletion of tissue macrophages during effector phase of STIA decreases joint damage. Top panel: hematoxylin and eosin staining (tibiotalar joint is shown), scale bar represents 100 μm. BM – bone marrow, C – cartilage, JC – joint cavity, P – pannus, SL – synovial lining. Bottom panel: immunohistochemical staining for macrophage marker F4/80. Arrows indicate F4/80-positive cells. Scale bar 20 μm. G. Depletion of tissue macrophages decreases histopathological scores. Data are represented as mean ± SEM. Differences between groups were compared using two-way ANOVA for repeated measurements, with Bonferroni post-test, * p<0.05, ** p <0.01, *** p<0.001.
Figure 6
Figure 6. Role of monocytes and macrophages in the resolution of STIA
A. Depletion of monocytes does not affect resolution of STIA (n = 4). B. Depletion of monocytes and tissue macrophages during the resolution phase of STIA delays resolution of arthritis (n = 7). C. Repeated administration of DT depletes tissue macrophages. D. Repeated administration of DT depletes tissue macrophages: Immunohistochemistry was performed on ankle section for F4/80. JC – joint cavity, SL – synovial lining. Scale bar 50 μm. E. Depletion of tissue macrophages during resolution phase results in higher histopathological scores. Data are represented as mean ± SEM. Differences between groups were compared using two-way ANOVA for repeated measurements, with Bonferroni post-test (arthritis), or with Student’s t-test (histopathology), * p<0.05, ** p <0.01, *** p<0.001.
Figure 7
Figure 7. Synovial macrophages switch phenotype during the course of STIA
A. Principal component analysis of gene expression in synovial macrophages confirms the differential origins of MHC II+ and MHC II synovial macrophages in the steady state. B. Hierarchical clustering of 46 genes differentially expressed across the dataset (FDR q-value < 0.001). C. Expression of CD36 on synovial macrophages during the course of STIA and analyzed by flow cytometry. Representative contour plots are shown. Numbers represent percentages of the parent gate.

References

    1. Arnold L, Henry A, Poron F, Baba-Amer Y, van Rooijen N, Plonquet A, Gherardi RK, Chazaud B. Inflammatory monocytes recruited after skeletal muscle injury switch into antiinflammatory macrophages to support myogenesis. J Exp Med. 2007;204:1057–1069. - PMC - PubMed
    1. Auffray C, Fogg D, Garfa M, Elain G, Join-Lambert O, Kayal S, Sarnacki S, Cumano A, Lauvau G, Geissmann F. Monitoring of blood vessels and tissues by a population of monocytes with patrolling behavior. Science. 2007;317:666–670. - PubMed
    1. Auffray C, Sieweke MH, Geissmann F. Blood monocytes: development, heterogeneity, and relationship with dendritic cells. Annu Rev Immunol. 2009;27:669–692. - PubMed
    1. Barland P, Novikoff AB, Hamerman D. Electron microscopy of the human synovial membrane. J Cell Biol. 1962;14:207–220. - PMC - PubMed
    1. Bruhns P, Samuelsson A, Pollard JW, Ravetch JV. Colony-stimulating factor-1-dependent macrophages are responsible for IVIG protection in antibody-induced autoimmune disease. Immunity. 2003;18:573–581. - PubMed

Publication types