. 2014 Oct 23;9(2):752-66.
doi: 10.1016/j.celrep.2014.09.031. Epub 2014 Oct 16.

Comprehensive identification of host modulators of HIV-1 replication using multiple orthologous RNAi reagents

Affiliations

Comprehensive identification of host modulators of HIV-1 replication using multiple orthologous RNAi reagents

Jian Zhu et al. Cell Rep. .

Abstract

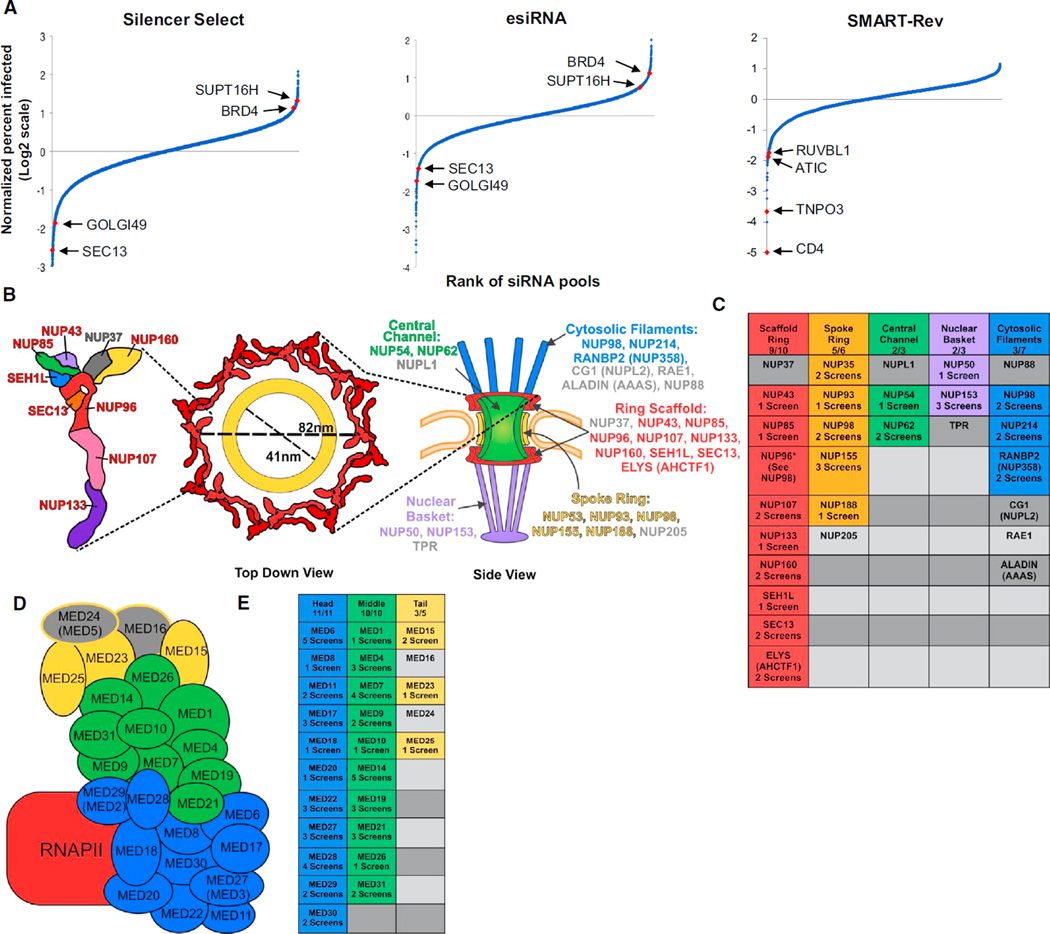
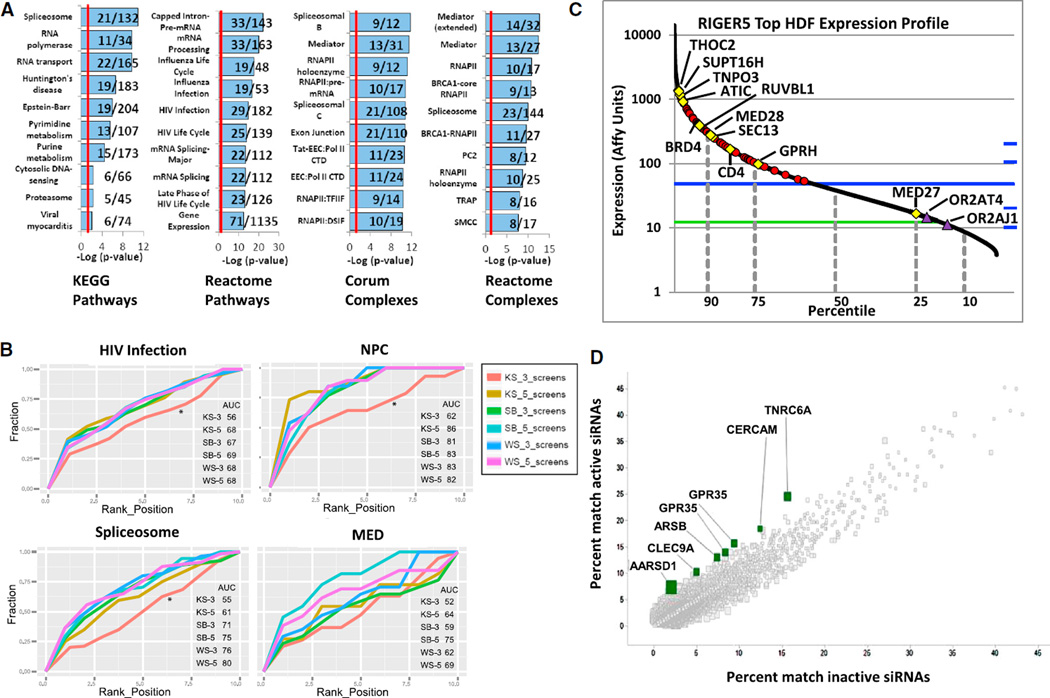
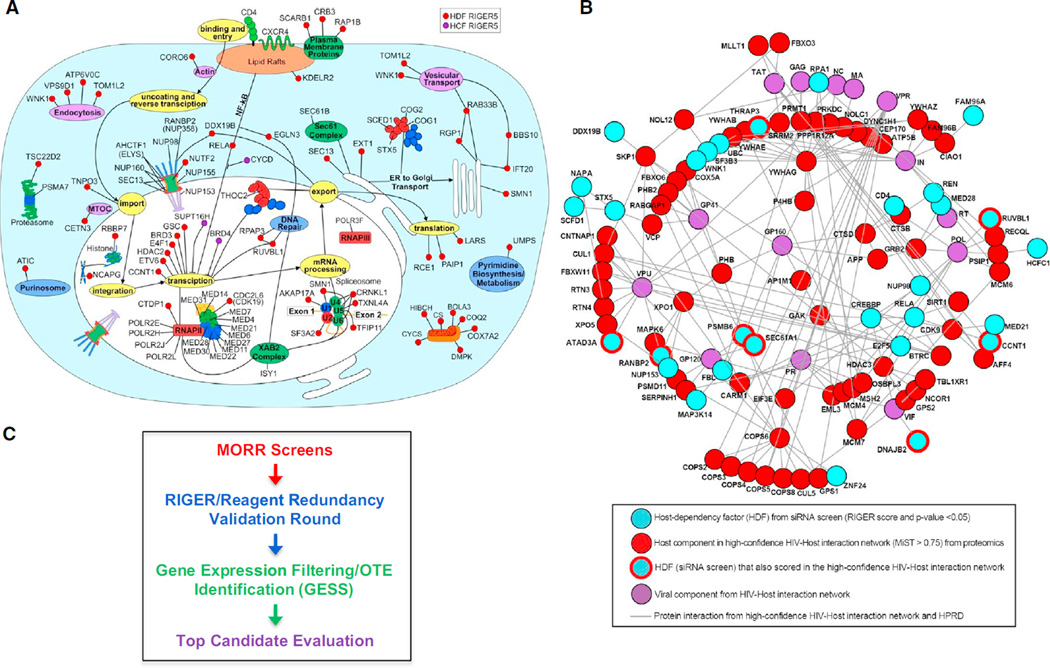
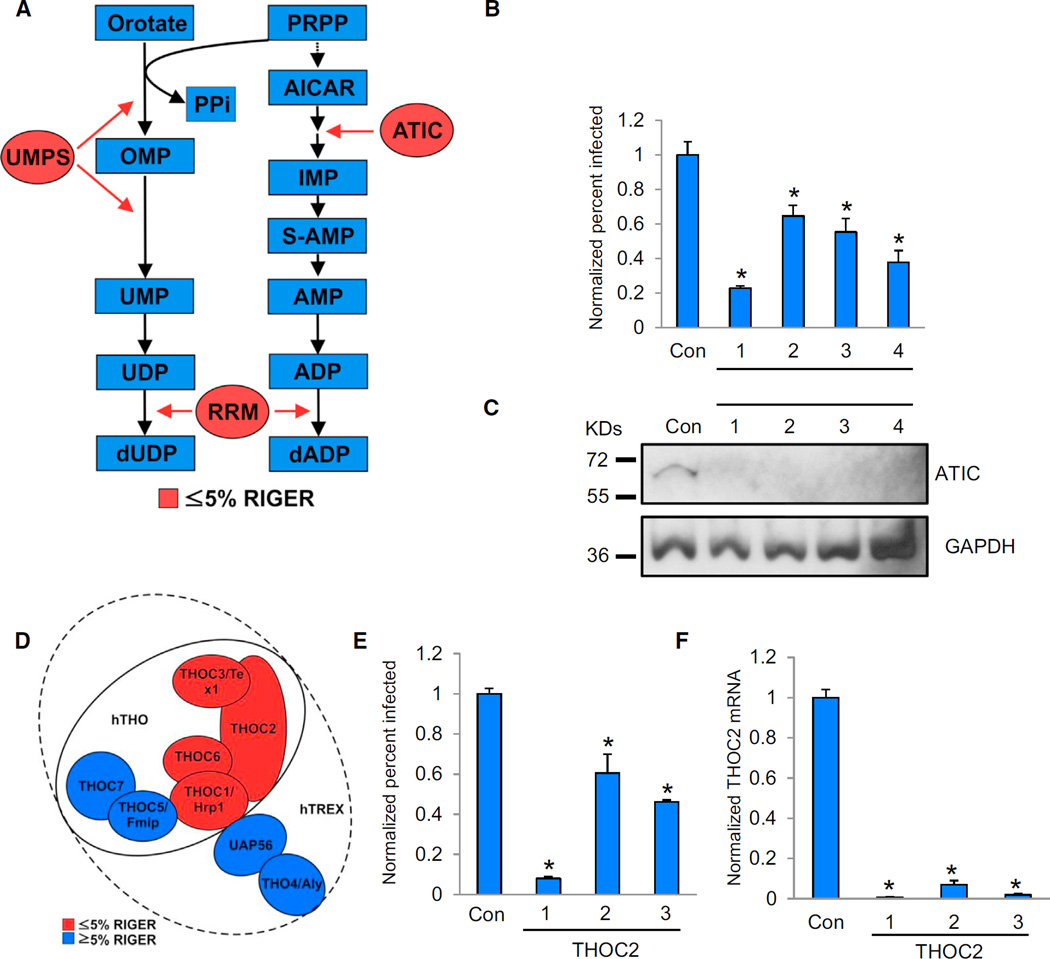
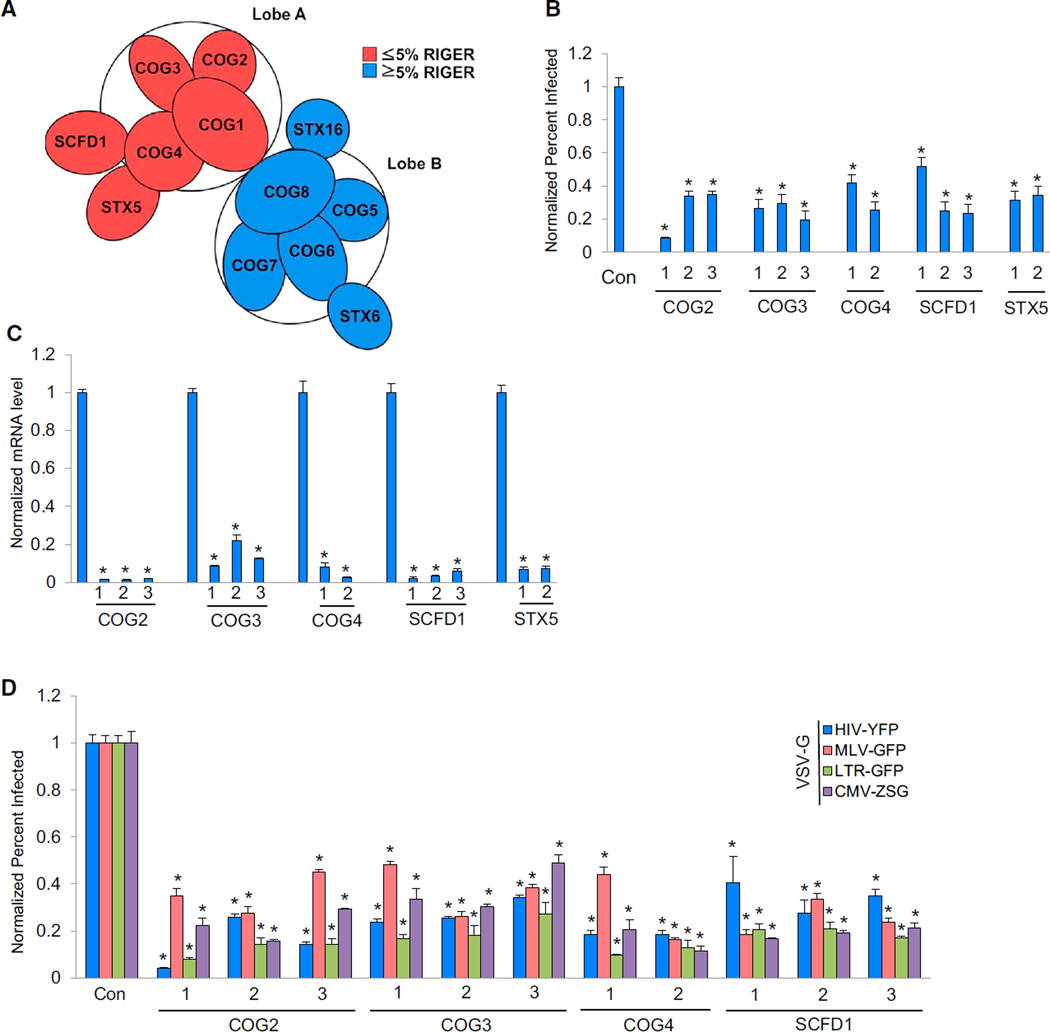
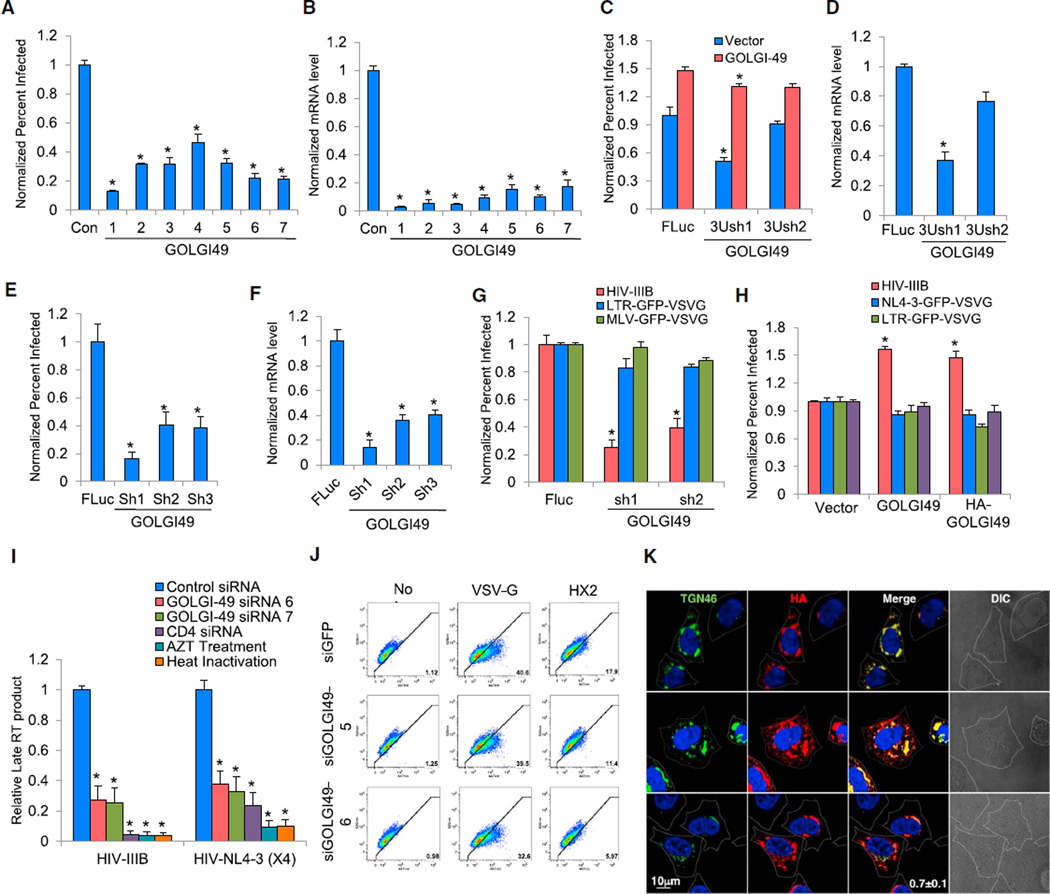
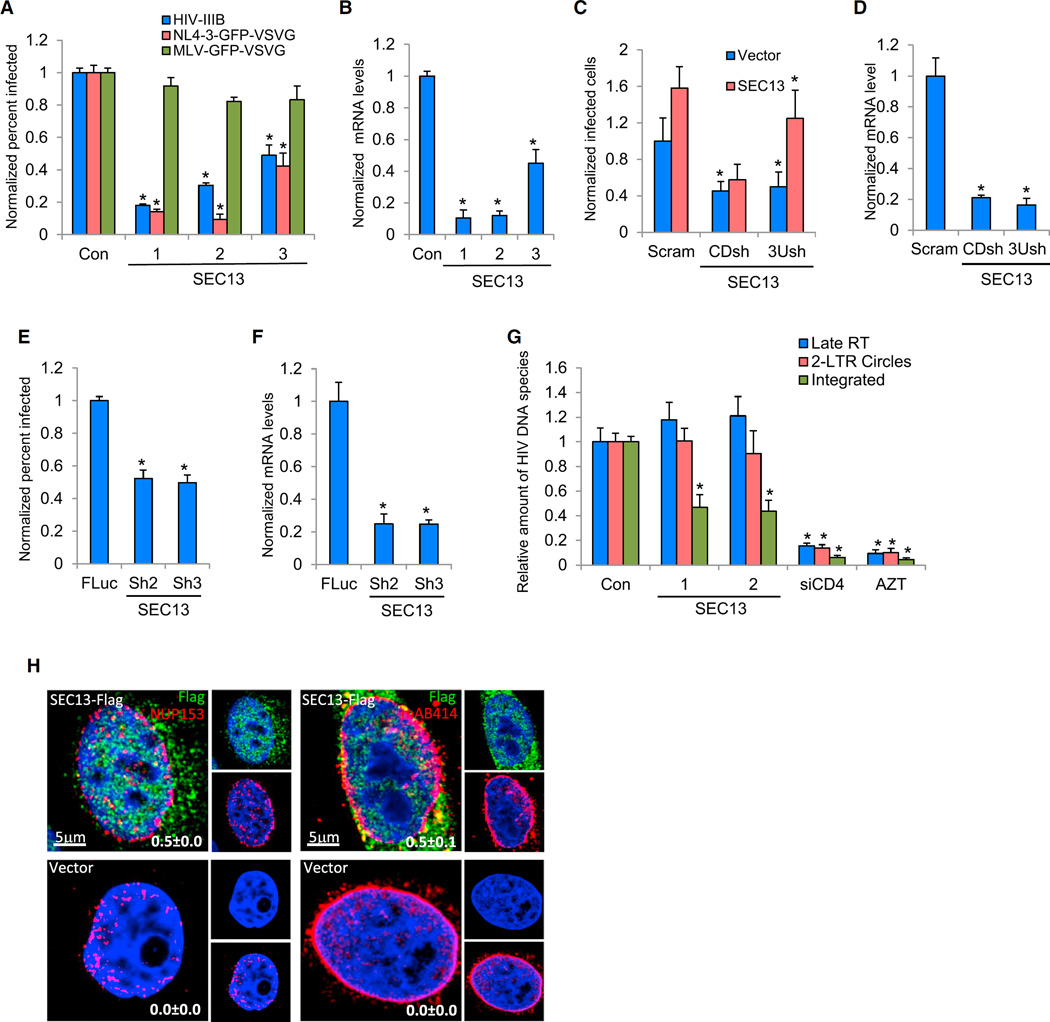
RNAi screens have implicated hundreds of host proteins as HIV-1 dependency factors (HDFs). While informative, these early studies overlap poorly due to false positives and false negatives. To ameliorate these issues, we combined information from the existing HDF screens together with new screens performed with multiple orthologous RNAi reagents (MORR). In addition to being traditionally validated, the MORR screens and the historical HDF screens were quantitatively integrated by the adaptation of an established analysis program, RIGER, for the collective interpretation of each gene's phenotypic significance. False positives were addressed by the removal of poorly expressed candidates through gene expression filtering, as well as with GESS, which identifies off-target effects. This workflow produced a quantitatively integrated network of genes that modulate HIV-1 replication. We further investigated the roles of GOLGI49, SEC13, and COG in HIV-1 replication. Collectively, the MORR-RIGER method minimized the caveats of RNAi screening and improved our understanding of HIV-1-host cell interactions.


Figures

Figure 1
Figure 1. MORR Screens Identify Host Factors that Modulate HIV-1 Replication
(A) The results of the screens with the siRNA pools ranked in order of their normalized percent infection (log2 scale). (B) NPC genes required for HIV-1 replication. Schematic of the NPC (left), with scaffold ring (red), spoke ring (yellow), central channel (green), nuclear basket (purple), and cytosolic filaments (blue) components. Detail of the NPC’s spoke ring (far left) demonstrating the high percentage (90%) of components, including SEC13 (orange), that scored in one or more of the HDF screens (red lettered). The estimated diameter of the NPC lumen is provided. For reference the HIV-1 PIC is ~28 nm across (Miller et al., 1997). (C) NPC genes that met selection criteria in one or more of the HDF screens are grouped and color-coded by their respective component in the table at right, with gray denoting a gene that did not score in any of the screens. (D) MED genes required for HIV-1 replication. Schematic of MED (left), with the head (blue), middle (green), and tail (yellow) components shown as well as the complex’s association with RNA polymerase II (RNAPII, red). (E) MED genes that met selection criteria in any of the screens are highlighted in their respective component colors in the table at right, with gray signifying a gene that did not meet selection criteria in any screen.
Figure 2
Figure 2. MORR Screen Gene Enrichment Analyses and Gene Expression Filtering
(A) Gene enrichment analyses of the RIGER5 HDFs. Highly enriched KEGG, REACTOME, and CORUM complexes and pathways among the top 550 RIGER5 HDFs are shown (Table S3). Overlying fractions to the right of each pathway’s or complex’s name indicate the number of HDFs identified in the analysis over the total number of genes in the set. The red line indicates a −log (p value) of 1.3 (p value of 0.05). Specific complex and pathways are abbreviated, with a key to their full names provided in Supplemental Experimental Procedures. (B) RIGER analyses comparisons. The RIGER3 and RIGER5 HDF data sets produced using one of three methods (WS, SB, or KS) were compared by assessing their respective levels of enrichment for each of four expert-selected HDF gene sets (HIV infection, NPC, spliceosome, MED; http://www.reactome.org). An enrichment estimate for each derivation was calculated by determining the area under a curve (AUC) generated by plotting the percent fraction (fraction) of expert-selected genes encountered moving from the lowest to highest p value on the ranked gene lists (rank position). (C) Microarray analysis was used to determine the levels of gene expression in the HeLa MAGI cells used in the MORR screens. The complete data set is arrayed with the red symbols representing the top 85 RIGER5 HDFs shown in the HDF cell model (Figure 3A). Specific HDFs and HRF/HCFs are noted (yellow). Two likely OTEs, the olfactory receptors (OR2AT4 and OR2AJ1), are shown in purple. The blue line represents the intron probe median. The green line represents the antisense probe mean. MED27, whose expression level falls below that of the intron probe median, is shown. (D) OTE analysis using genome-wide enrichment of seed sequence matches (GESS). All siRNAs (313) that scored in the validation round for the Silencer Select library screen were analyzed. The significant enrichment of RefSeq CDSs that have a 7-mer seed match to these 313 siRNAs was determined by comparison to a set of inactive validation round siRNAs. Several potential OTEs are highlighted (green squares). A similar analysis was performed to look for on-viral effects (OVEs) using the HIV-1 genome sequence (Figure S2D).
Figure 3
Figure 3. MORR Screen HDF Model and HIV-Host Proteome Analyses
(A) Using the RIGER5 list as a starting point, we constructed an updated hypothetical model cell depicting key steps in the HIV-1 life cycle as well as where 85 of the HDFs might function based on the literature (Table S6). (B) Network showing connections between HDFs (top-ranked 123 from RIGER3 SB analysis) and host proteins that interacted with HIV viral components (Jäger et al., 2012). Human protein reference database (HPRD). (C) MORR screening is followed by RIGER analysis and traditional reagent redundancy validation. Gene expression filtering and the GESS program are next used to remove likely OTEs. Based on these results, candidates are selected for further evaluation.
Figure 4
Figure 4. HIV-1 Requires Specific Nucleotide Synthesis Enzymes and the THOC/TREX Complex
(A) Multiple nucleotide synthesis enzymes (ATIC, UMPS, and RRM) were detected in the screens and RIGER analyses (≤5% RIGER = lowest 5% q-values). (B) MAGI HeLa cells were transfected with either nontargeting control siRNA (Con) or siRNAs targeting ATIC (1–4). At 72 hr posttransfection, cells were infected with HIV-1 IIIB. After 48 hr, cells were immunostained with an anti-HIV-1 p24 CA antibody (anti-CA). The percentage of infected cells was measured using image analysis software and normalized to the control siRNA transfected cells. (C) Whole-cell lysates from the indicated cells in (B) were subjected to immunoblotting using the noted antibodies. kDa, kilodaltons; GAPDH, loading control. (D) Schematic model of the human THO/TREX complexes (Viphakone et al., 2012). Subunits detected in the MORR screens and RIGER5 SB analysis are shown in red (≤5% RIGER = lowest 5% q-values). (E) HeLa cells were transfected with the indicated siRNAs and assessed as in (B). (F) siRNA-mediated depletion of THOC2 was evaluated by quantitative PCR (qPCR) measurement of mRNA levels from the cells in (E). mRNA levels were normalized to those of the control siRNA transfected cells. Results throughout are the mean of three independent experiments ± SD. *p ≤ 0.05 (Student’s t test).
Figure 5
Figure 5. COG Plays a Role in HIV-1 Replication
(A) Schematic of the COG complex. Subunits of COG lobe A (COG-LA) detected in the MORR HDF screens and RIGER5 analysis (≤5% RIGER = lowest 5% q-values) are shown in red. Genes in blue represent those with q values in the highest 95%. (B) HeLa cells were transfected with the indicated siRNAs. At 72 hr after transfection, cells were infected with HIV-1 IIIB. After 48 hr, cells were immunostained with anti-CA. The percentage of infected cells was normalized to the control siRNA-treated cells. (C) siRNA-mediated depletion was evaluated by qPCR measurement of the endogenous mRNA levels from (B). mRNA levels were normalized to those of the control siRNA-transfected cells. (D) HeLa cells were transfected with either nontargeting control siRNA or the indicated siRNAs. At 72 hr posttransfection, cells were infected with one of the following VSV-G-pseudotyped viruses: HIV-YFP, MLV-GFP, LTR-GFP, or pPHAGE-CMV-ZSG. After incubation for 48 hr, the percentage of positive cells was determined and normalized to controls. Results throughout are the mean of three independent experiments ± SD. *p ≤ 0.05 (Student’s t test).
Figure 6
Figure 6. Depletion of GOLGI49 Prevents HIV-1 Entry
(A) HeLa cells were transfected with the indicated siRNAs. At 72 hr posttransfection, cells were infected with HIV-1 IIIB. After 48 hr, cells were stained with anti-CA. The percentage of infected cells was measured and normalized to the control siRNA-treated cells. (B) siRNA-mediated depletion was evaluated by qPCR measurement of mRNA levels from (A). mRNA levels were normalized to those of the control siRNA-transfected cells. (C) TZM-bl HeLa cells stably expressing the indicated short hairpin RNAs (shRNA) against the 3′ UTR of the GOLGI49 mRNA (3Ush) or a control shRNA against firefly luciferase (FLuc) were either mock transfected (mock) or transiently transfected with a vector expressing the GOLGI49 cDNA. After 48 hr, the cells were infected with HIV-IIIB. After an additional 48 hr, the cells were stained with anti-CA. The percentage of infected cells was measured and normalized to the FLuc control cells. (D) GOLGI49 3′ UTR shRNA-mediated depletion was confirmed by measuring mRNA from (C). mRNA levels were normalized to those of the FLuc control cells. 3Ush, 3′UTR shRNA. (E) Primary human CD4+ T cells stably expressing either the control FLuc shRNA or one of the indicated shRNAs against GOLGI49 (Sh1-3) were infected with HIV-1 NL4-3-GFP. The percentage of GFP-positive cells was measured at 48 hr postinfection and normalized to the control cells. (F) GOLGI49 shRNA-mediated depletion in primary CD4+ T cells in (E) was confirmed by qPCR. mRNA levels were normalized to those of the FLuc control cells. (G) TZM-bl HeLa cells stably expressing the indicated shRNAs were infected with HIV-1 IIIB, LTR-GFP-VSV-G, or MLV-GFP-VSV-G. After 48 hr, the percentage of infected cells was measured and normalized to the levels found in the FLuc control cells. (H) TZM-bl HeLa cells stably transduced with viruses containing an empty vector (pQCXIP, Vector), a GOLGI49 cDNA (GOLGI49), or an HA-tagged GOLGI49 cDNA (HA-GOLGI49) were infected with the indicated fluorescence protein reporter viruses. The percentage of infected fluorescent cells was measured at 48 hr postinfection and normalized to the control cells. (I) HeLa cells were transfected with the indicated siRNAs. At 72 hr posttransfection, cells were infected with HIV-1 IIIB or HIV-1 NL4-3-GFP (X4). As negative controls, infections were performed in the presence of either azidothymidine (AZT) (2.5 uM) or using heat-inactivated virus. Cells were harvested at 18 hr postinfection and subjected to DNA extraction. Late RT product was measured by qPCR using described primer and probe set and normalized to the control siRNA-treated cells. (J) HeLa cells were transfected with the indicated siRNAs (siGFP is a negative control siRNA targeting GFP). Cells were infected 72 hr later with an HIV-1 virus containing a BlaM-Vpr fusion protein pseudotyped with either VSV-G or an HIV-1 ENV (HX2, X4-tropic). Infected cells were incubated with the CCF2-AM substrate and fluorescence was measured. Cells at the lower-right corner of the diagonal distribution of the no-infection control (No) were gated as a positive population, and numbers in that region represent percent positive cells. (K) Confocal imaging of HeLa cells stably expressing HA-GOLGI49 (HA, red) and the endogenous Golgi protein TGN46 (green). Cell outlines were rendered based on differential interference contrast (DIC) images (far right). Percent colocalization ± SD is provided in the bottom merged panel. Results throughout are the mean of three independent experiments ± SD. *p ≤ 0.05 (Student’s t test).
Figure 7
Figure 7. SEC13 Is Needed for HIV-1 Replication after Nuclear Entry but prior to Integration
(A) MAGI HeLa cells were transfected with the indicated siRNAs and infected 72 hr later with the noted viruses. The percentage of infected cells was measured at 48 hr postinfection and normalized to the control siRNA-treated cells. (B) siRNA-mediated depletion was tested by measuring SEC13 mRNA from the cells in (A). mRNA levels are normalized to those of the negative control cells. (C) TZM-bl HeLa cells stably expressing an shRNA against the coding sequence of the SEC13 mRNA (CDsh), the 3′ UTR of the SEC13 mRNA (3Ush), or a scrambled control shRNA (Scram) were transfected with either an empty expression vector (vector) or a vector expressing the SEC13 cDNA. After 48 hr, the cells were infected with HIV-IIIB. After an additional 48 hr, the cells were stained with anti-CA. The percentage of infected cells was measured and normalized to the control siRNA-transfected cells. The exogenously expressed SEC13 cDNA rescued HIV replication in the 3Ush cells, but not the CDsh cells. (D) SEC13 shRNA targeting efficacy was confirmed by measuring mRNA from cells in (C). Values were normalized to the mRNA level of the scramble shRNA control cells. (E) Primary CD4+ T cells stably expressing either FLuc shRNA or two different SEC13 shRNAs were infected with NL4-3-GFP-VSV-G. The percentage of infected cells was measured 48 hr later and normalized to the values determined for the FLuc shRNA-transduced cells. (F) SEC13 shRNA-mediated depletion efficacy in cells in (E) was determined. mRNA levels were normalized to those of FLuc shRNA-transduced cells. (G) HeLa-T4 cells were transfected with the indicated siRNAs for 72 hr. Cells were then infected with HIV-1 IIIB. As a control, nontransfected cells were pretreated with AZT. DNA was harvested and subjected to qPCR assays measuring late RT (blue), 2-LTR circles (red), or integrated proviral DNA species (integrated, green). The relative level of viral DNAs was normalized to cells transfected with the control siRNA. (H) Confocal imaging of HeLa cells stably expressing SEC13-FLAG (green) or the empty vector control (Vector) immunostained using either an antibody that recognizes the NPC protein, NUP153 (red), or one that recognizes the NPC complex (mAB414, red). Nuclear DNA is shown in blue. Percent colocalizations of either NUP153 or mAB414 with SEC13 ± SD from multiple cells from multiple fields are provided in the bottom right corner of the merged panel. Results throughout are the mean of three independent experiments ± SD. *p ≤ 0.05 (Student’s t test).

References

    1. Adamson B, Smogorzewska A, Sigoillot FD, King RW, Elledge SJ. A genome-wide homologous recombination screen identifies the RNAbinding protein RBMX as a component of the DNA-damage response. Nat. Cell Biol. 2012;14:318–328. - PMC - PubMed
    1. Belotserkovskaya R, Oh S, Bondarenko VA, Orphanides G, Studitsky VM, Reinberg D. FACT facilitates transcription-dependent nucleosome alteration. Science. 2003;301:1090–1093. - PubMed
    1. Brass AL, Dykxhoorn DM, Benita Y, Yan N, Engelman A, Xavier RJ, Lieberman J, Elledge SJ. Identification of host proteins required for HIV infection through a functional genomic screen. Science. 2008;319:921–926. - PubMed
    1. Bushman FD, Malani N, Fernandes J, D’Orso I, Cagney G, Diamond TL, Zhou H, Hazuda DJ, Espeseth AS, König R, et al. Host cell factors in HIV replication: meta-analysis of genome-wide studies. PLoS Pathog. 2009;5:e1000437. - PMC - PubMed
    1. Capelson M, Liang Y, Schulte R, Mair W, Wagner U, Hetzer MW. Chromatin-bound nuclear pore components regulate gene expression in higher eukaryotes. Cell. 2010;140:372–383. - PMC - PubMed

Publication types

MeSH terms

LinkOut - more resources