Review
. 2014 Oct 22;84(2):262-74.
doi: 10.1016/j.neuron.2014.10.015. Epub 2014 Oct 22.

The chronnectome: time-varying connectivity networks as the next frontier in fMRI data discovery

Affiliations
Review

The chronnectome: time-varying connectivity networks as the next frontier in fMRI data discovery

Vince D Calhoun et al. Neuron. .

Abstract

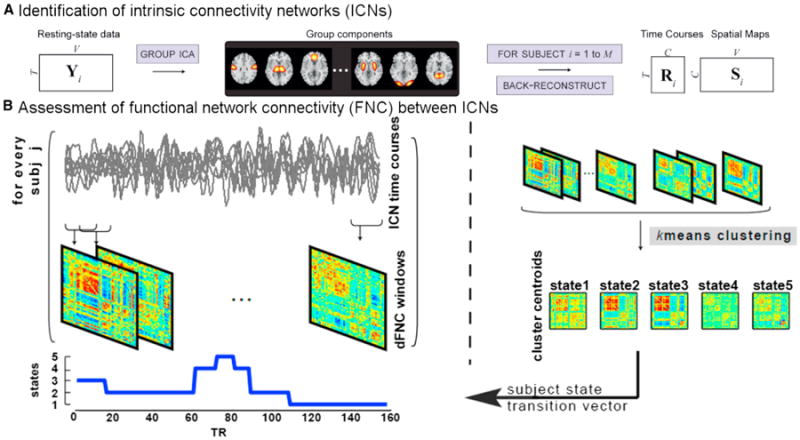
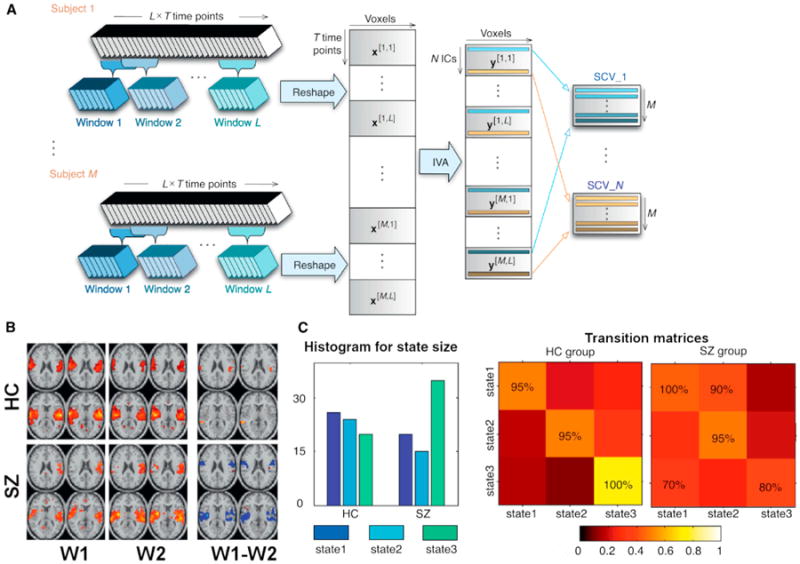
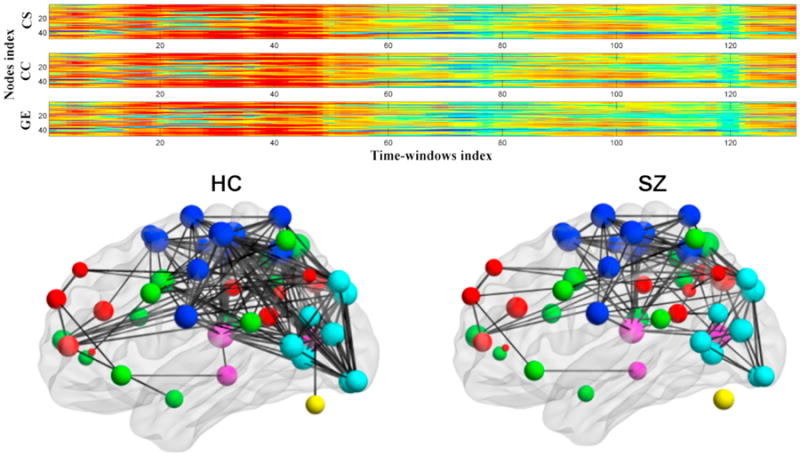
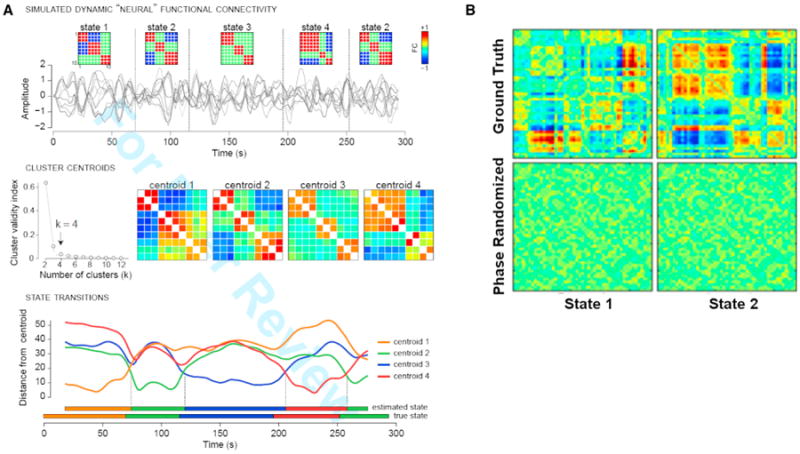
Recent years have witnessed a rapid growth of interest in moving functional magnetic resonance imaging (fMRI) beyond simple scan-length averages and into approaches that capture time-varying properties of connectivity. In this Perspective we use the term "chronnectome" to describe metrics that allow a dynamic view of coupling. In the chronnectome, coupling refers to possibly time-varying levels of correlated or mutually informed activity between brain regions whose spatial properties may also be temporally evolving. We primarily focus on multivariate approaches developed in our group and review a number of approaches with an emphasis on matrix decompositions such as principle component analysis and independent component analysis. We also discuss the potential these approaches offer to improve characterization and understanding of brain function. There are a number of methodological directions that need to be developed further, but chronnectome approaches already show great promise for the study of both the healthy and the diseased brain.


Figures

Figure 1
Figure 1. Dynamic Functional Network Connectivity: An Approach to Identify Time-Varying Patterns of Connectivity from fMRI Data
The dynamic FNC approach to estimate temporal dynamics starts with group independent component analysis (ICA) to decompose fMRI data into intrinsic connectivity networks. The group ICA approach (Erhardt et al., 2011b) provides a measure of the component time courses (above left) and spatial maps for each subject. Dynamic functional network connectivity is estimated as a cross-correlation (more specifically covariance) from windowed portions of the time courses. Finally, k-means clustering is used to identify states and determine which state a given subject is occupying at a given time. Figure modified and reprinted with permission from Erhardt et al. (2011b).
Figure 2
Figure 2. An Approach to Estimate Time-Varying Connectivity Spatial Patterns from fMRI Data using Independent Vector Analysis and Example Showing Coupling between these Spatial Connectivity Patterns Varies in Schizophrenia
(A) Independent vector analysis approach to characterize spatially dynamic and static components. Here, spatial maps of a component vector are related over the time windows but should be distinct from the spatial maps of all other components (whether within or outside the current window wi). (B) Patients show more variability in their spatial patterns overall. (Left) One-sample t test results for two time windows. (Right) Two-sample t test results showing significant bilateral changes in schizophrenia patients versus controls. (C) Estimation of spatial dynamic temporal lobe coupling (mutual information) to other networks confirms increased dependence between state 3 relative to other states in schizophrenia patients (left). Schizophrenia patients also show significantly more cross-state transitions in temporal lobe with increased likelihood of transitioning from state 3 to state 1 (80% versus 100%, right). Color represents the transition probability. Figure modified and reprinted with permission from Ma et al. (2014).
Figure 3
Figure 3. Time-Varying Aspects of Graph Metrics and Summary of Resulting Module for Patients and Controls
(Top) Example of time-varying output from dynamic graph approach; patients generally tend to have lower values. Time-varying network metrics for schizophrenia patients and healthy controls. (Bottom) Graph built from a single dynamic state (Yu et al., 2013). Figure modified and reprinted with permission from Yu et al. (2013).
Figure 4
Figure 4. Example of Simulation Approach to Help Validate and Assess Robustness of Time-Varying Connectivity Results
(A) Validation of clustering approach with simulated data. (Top row) Simulated fMRI time series for ten nodes are generated under a model of dynamic neural connectivity where 4 states are possible (state 2 repeats). Simulation parameters (TR = 2 s, 148 volumes) are matched to experimental data; connectivity states are modeled after clusters observed in real data. (Middle row) Windowed covariance matrices are estimated from the simulated time series and are subjected to k-means clustering with the L1 distance metric. The elbow criterion correctly identifies k = 4 clusters, and cluster centroids show high similarity to the true states. (Bottom row) The distance of each window to each cluster centroid. The assignment of individual windows to states is very accurate. Distances and state assignments are plotted at the time point corresponding to the window center. (B) Original dynamic functional network connectivity states (top) and results after phase randomization (bottom) as in Handwerker et al. (2012) look random (not at all like the top row) and thus show no evidence of spurious structure (Damaraju et al., 2014). Figure modified and reprinted with permission from Allen et al. (2014) and Damaraju et al. (2014).
Figure 5
Figure 5. Differences in Resulting State Patterns Depend on the Approach Used and Summary of Metastate Occupancy Level
(A) Maximizing independence among temporal states provides what looks like a plausible result but is quite different from a k-means solution. (B) Occupancy of metastates for rest fMRI of healthy individuals (n = 400) coded as 5-vector (5 states estimated). Most subjects occupy only 1 or 2 states at once. Figure modified and reprinted with permission from Miller et al. (2014a).
Figure 6
Figure 6. Summary of State Patterns and Significant Differences in Patients versus Controls
(A) Five transient state connectivity patterns estimated from schizophrenia data. Patients spend significantly more time in the relatively less connected state 4 (red line in graph on right) whereas controls spend more time in states 1–3 (Damaraju et al., 2014). (B) Dynamic functional network connectivity results suggesting specific states differentiate schizophrenia, bipolar, and healthy controls, and that most of these are tied to a single state in this case. (Top) Significant patient versus control differences within each state indicated by colored links. (Bottom) Surface view of the state in brain space for lateral and medial views of the brain. Figure modified reprinted with permission from Damaraju et al. (2014).
Figure 7
Figure 7. Spatiotemporal Spectra Patterns Identified from Resting fMRI Data
(Nonboxed) The five basis spatiotemporal spectral patterns obtained from sICA of all windowed spatiotemporal spectral profile (wSTSP). (Boxed) Specific wSTSP expressed as weighted sum of the spatiotemporal spectral profiles. Figure modified and reprinted with permission from Miller and Calhoun (2014).

References

    1. Allen EA, Erhardt EB, Damaraju E, Gruner W, Segall JM, Silva RF, Havlicek M, Rachakonda S, Fries J, Kalyanam R, et al. A baseline for the multivariate comparison of resting-state networks. Front Syst Neurosci. 2011;5:2. - PMC - PubMed
    1. Allen EA, Erhardt EB, Wei Y, Eichele T, Calhoun VD. Capturing inter-subject variability with group independent component analysis of fMRI data: a simulation study. Neuroimage. 2012;59:4141–4159. - PMC - PubMed
    1. Allen EA, Damaraju E, Plis SM, Erhardt EB, Eichele T, Calhoun VD. Tracking whole-brain connectivity dynamics in the resting state. Cereb Cortex. 2014;24:663–676. - PMC - PubMed
    1. Anderson M, Fu G, Phlypo R, Adalı T. Independent vector analysis: identification conditions and performance bounds. IEEE Trans Signal Process. 2014;62:4399–4410.
    1. Arbabshirani MR, Kiehl KA, Pearlson GD, Calhoun VD. Classification of schizophrenia patients based on resting-state functional network connectivity. Front Neurosci. 2013;7:133. - PMC - PubMed

Publication types