. 2014 Oct 22;84(2):355-62.
doi: 10.1016/j.neuron.2014.09.033. Epub 2014 Oct 22.

Pupil fluctuations track fast switching of cortical states during quiet wakefulness

Affiliations

Pupil fluctuations track fast switching of cortical states during quiet wakefulness

Jacob Reimer et al. Neuron. .

Abstract

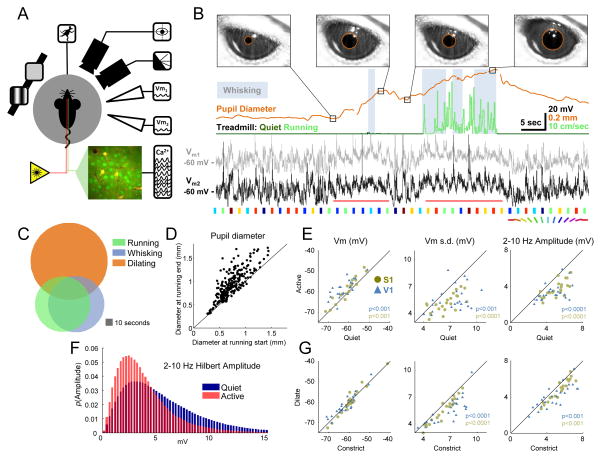
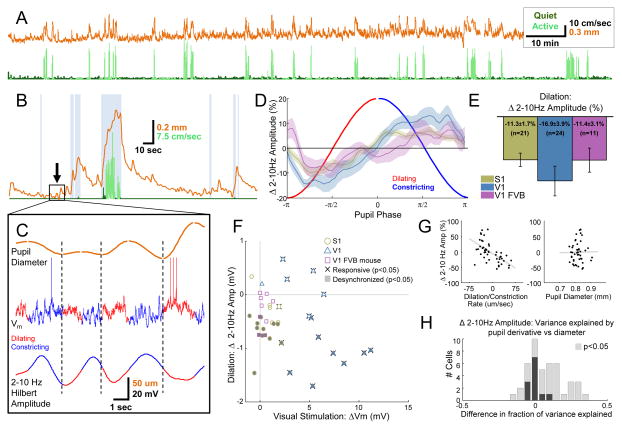
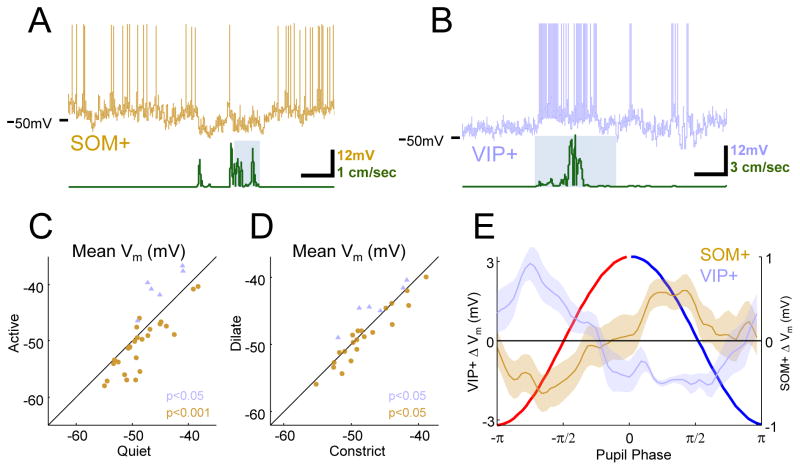
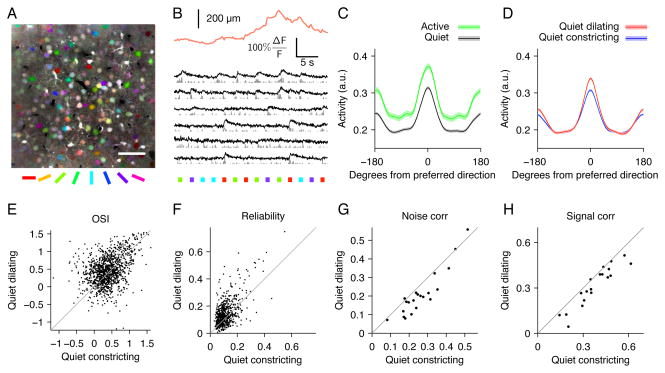
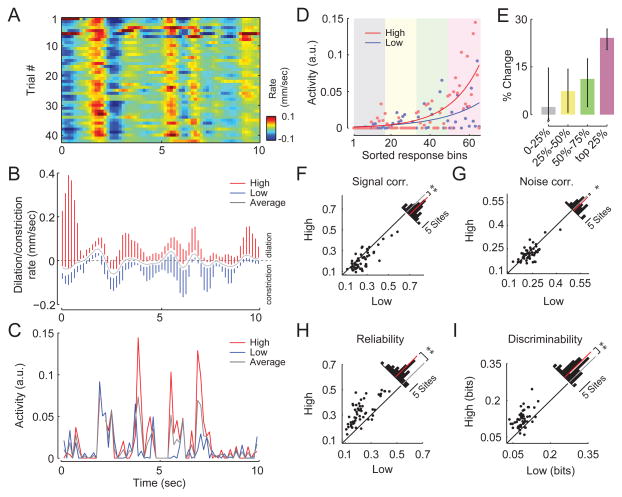
Neural responses are modulated by brain state, which varies with arousal, attention, and behavior. In mice, running and whisking desynchronize the cortex and enhance sensory responses, but the quiescent periods between bouts of exploratory behaviors have not been well studied. We found that these periods of "quiet wakefulness" were characterized by state fluctuations on a timescale of 1-2 s. Small fluctuations in pupil diameter tracked these state transitions in multiple cortical areas. During dilation, the intracellular membrane potential was desynchronized, sensory responses were enhanced, and population activity was less correlated. In contrast, constriction was characterized by increased low-frequency oscillations and higher ensemble correlations. Specific subtypes of cortical interneurons were differentially activated during dilation and constriction, consistent with their participation in the observed state changes. Pupillometry has been used to index attention and mental effort in humans, but the intracellular dynamics and differences in population activity underlying this phenomenon were previously unknown.


Figures

Figure 1
Figure 1
Pupil diameter, locomotion and whisking correlate with subthreshold measures of cortical state. (A) Schematic of simultaneous recordings showing mouse on spherical treadmill, with eye and whisker cameras, single or dual patch pipettes, calcium imaging, and visual stimuli. (B) Example treadmill activity (running periods in light green, see Supplemental Experimental Procedures), pupil diameter (orange), whisking (gray background, see Supplemental Experimental Procedures), and Vm from two simultaneously patched cells (black and gray; depolarization around whisking and running epochs indicated with horizontal red lines). Colored patches below the voltage traces indicate presentations of oriented drifting gratings (Figure 4 only). Images of the eye are shown at the time points indicated in the pupil diameter trace, with pupil detection indicated by orange circles. Gaps in the pupil trace are due to blinks. (C) Overlap of running, whisking and pupil dilation episodes. (D) Pupil size before and after running epochs. (E) Changes in subthreshold membrane potential between quiet wakefulness and activity (running and whisking) without visual stimulation. (F) Distribution of low frequency amplitude during active behavior compared to quiet wakefulness (G) Changes in subthreshold membrane potential during dilating and constricting epochs of quiet wakefulness, also without visual stimuli. See also Figures S1 and S3 and Movie S1.
Figure 2
Figure 2
Pupil diameter correlates with cortical state in the absence of exploratory behavior. (A) Concatenated recordings of treadmill speed (running periods in light green, quiet periods in dark green) and pupil diameter (orange) from a single mouse (total time ~2.4 hours). (B) Pupil diameter (orange) around a single active period (running in light green and whisking in gray background). (C) Zoomed in period of quiet wakefulness from rectangle in (B) showing four sequential cycles of pupil dilation (red) and constriction (dark blue) correlated with low-frequency amplitude (separate cycles of dilation and constriction separated by dashed vertical lines). (D) Vm is desynchronized during dilation and synchronized during constriction of the pupil in S1 (olive), V1 (blue), and V1 of FVB mice (mauve; 64 phase bins from −π to π, plots are mean ± SEM for each bin). (E) Averages over entire dilation and constriction periods for cells in each area (bar plots are mean ± SEM across cells, one-way ANOVA across cell groups was not significant P=0.53). (F) Scatter plot of desynchronization during dilation and visual responsiveness for all cells in each area. Significantly responsive cells are indicated with whiskers, significantly desynchronized cells are indicated with shading. (G) Linear regression of the rate of change (left) and the absolute value of pupil diameter (right) against percent change in 2–10 Hz amplitude for a single cell. (H) Stacked histogram of the difference in total variance in 2–10 Hz amplitude explained by pupil derivative and pupil diameter in a two-way ANOVA for each cell. Cells where either factor was significant (P<.05) are indicated with lighter bars. Overall, variations in cortical state indexed by low-frequency amplitude are more closely tracked by pupil dilation and constriction than by absolute pupil diameter (P<.0001, t-test). See also Figures S2–S4 and Movie S2.
Figure 3
Figure 3
VIP+ cells are excited and SOM+ cells are inhibited during active behaviors and during dilation. (A) Example SOM+ cell (brown) and treadmill (green) trace with whisking epoch as grey background. SOM+ cells are hyperpolarized during locomotion. (B) Example VIP+ cell (blue) and treadmill (green) trace with whisking epoch as grey background. VIP+ activity is dramatically enhanced during running. (C) Summary of inhibition of SOM+ and excitation of VIP+ during exploratory behaviors compared to quiet wakefulness. (D) In quiet wakefulness, SOM+ cells are inhibited and VIP+ cells are excited during dilation compared to constriction. (E) Phase-binned change in SOM+ and VIP+ Vm showing time course of signature opposition of VIP+ and SOM+ activity over dilating and constricting periods.
Figure 4
Figure 4
Orientation tuning is enhanced during pupil dilation. (A) Mean fluorescence image colored by orientation preferences of individual pixels; scale bar 50 μm. (B) Example pupil diameter trace (orange) with simultaneous calcium traces from segmented cells (black) and inferred firing rates (gray). Colored squares indicate the direction of drifting gratings. (C) Average tuning curves aligned to cells’ preferred direction for active (running and/or whisking) periods (green) and quiet (black) periods. Peak responses are increased (20%, P<10−12) and orientation selectivity is unchanged (7% decrease, P=.07). Error bands are SEM computed over cells (n=516). (D) Average tuning during pupil dilation (red) and constriction (blue) during quiet periods (excluding running and whisking). Orientation selectivity is increased (16% increase in mean OSI, P<10−6, E) and cells respond more reliably (28% increase in mean binned R2 values of stimulus responses of individual cells, P<10−15, F) during dilation compared to constriction. Across populations of neurons, mean noise correlations (G, P<10−4) and signal correlations (H, P<.01) are reduced during pupil dilation (n=21 sites). Paired t-test for all comparisons. Reliability and correlations are computed on 150 ms bins during stimulus presentations (see Supplemental Experimental Procedures).
Figure 5
Figure 5
Encoding of natural images is improved during pupil dilation. (A) Pupil dilation/constriction rates across multiple repetitions of a natural movie. (B) Mean (gray) and range in upper and lower quartiles (red and blue, respectively) of the pupil dilation/constriction rate for multiple presentations of a single movie (150-ms bins). Subsequent analyses compare neural responses in the upper quartile of pupil dilation/constriction rates (“high”) to the lower quartile (“low”). (C) Increase in mean activity during high trials compared to low trials for a single cell. (D) For each cell, movie frames are sorted by the mean neural response, not considering pupil dilation and constriction. Responses in high (red dots) and low (blue dots) conditions are fit with an exponential function (solid red and blue lines) to illustrate the selective increase in response to preferred stimuli. (E) Median change in firing rate in high trials compared to low trials (n=467 neurons, 95% confidence intervals) for least preferred (0–25%), intermediate (25–50% and 50–75%), and most-preferred (75–100%) frames for each cell. Responses to preferred frames are selectively enhanced. Mean signal (F) and noise (G) correlations decreased during the high condition, while reliability (H) and discriminability (I) were enhanced. Insets show histograms of absolute change with red bar indicating the mean difference (n=53 sites, **P<0.001, *P<0.05, t-test).

Comment in

References

    1. Aston-Jones G, Rajkowski J, Cohen J. Role of locus coeruleus in attention and behavioral flexibility. Biological Psychiatry. 1999;46:1309–1320. - PubMed
    1. Bennett C, Arroyo S, Hestrin S. Subthreshold Mechanisms Underlying State-Dependent Modulation of Visual Responses. Neuron. 2013;80:350–357. - PMC - PubMed
    1. Bradley MM, Miccoli L, Escrig MA, Lang PJ. The pupil as a measure of emotional arousal and autonomic activation. Psychophysiology. 2008;45:602–607. - PMC - PubMed
    1. Chang B, Hawes NL, Hurd RE, Davisson MT, Nusinowitz S, Heckenlively JR. Retinal degeneration mutants in the mouse. Vision Res. 2002;42:517–525. - PubMed
    1. Cotton RJ, Froudarakis E, Storer P, Saggau P, Tolias AS. Three-dimensional mapping of microcircuit correlation structure. Front Neural Circuits. 2013;7:151. - PMC - PubMed

Publication types