. 2014 Oct 22;84(2):442-56.
doi: 10.1016/j.neuron.2014.08.042. Epub 2014 Oct 22.

Engagement of neural circuits underlying 2D spatial navigation in a rodent virtual reality system

Affiliations

Engagement of neural circuits underlying 2D spatial navigation in a rodent virtual reality system

Dmitriy Aronov et al. Neuron. .

Abstract

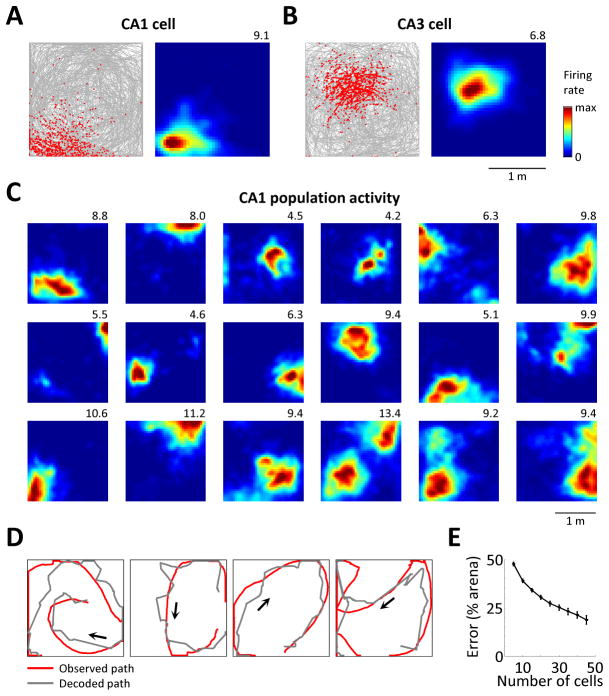
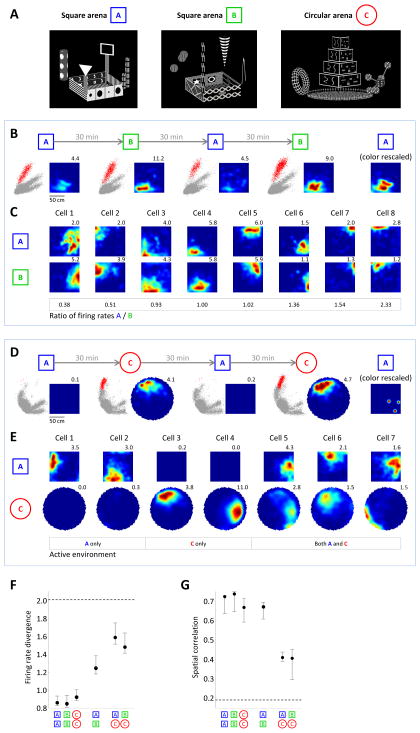
Virtual reality (VR) enables precise control of an animal's environment and otherwise impossible experimental manipulations. Neural activity in rodents has been studied on virtual 1D tracks. However, 2D navigation imposes additional requirements, such as the processing of head direction and environment boundaries, and it is unknown whether the neural circuits underlying 2D representations can be sufficiently engaged in VR. We implemented a VR setup for rats, including software and large-scale electrophysiology, that supports 2D navigation by allowing rotation and walking in any direction. The entorhinal-hippocampal circuit, including place, head direction, and grid cells, showed 2D activity patterns similar to those in the real world. Furthermore, border cells were observed, and hippocampal remapping was driven by environment shape, suggesting functional processing of virtual boundaries. These results illustrate that 2D spatial representations can be engaged by visual and rotational vestibular stimuli alone and suggest a novel VR tool for studying rat navigation.


Figures

Figure 1
Figure 1. Virtual reality (VR) setup for 2D navigation in rats
(A) Schematic of the setup. For clarity, the screen is rendered partially transparent, and the transparent ceiling is tinted. Inset: yaw blocker in contact with the treadmill, preventing treadmill rotations around the vertical axis. (B) Side view of the setup, showing the light path of the VR projection in red. (C) Photograph of the attachment to the commutator, illustrating components that rotate with the rat. (D) Photograph of a rat in the harness, attached to the commutator via a hinged arm. (E) Schematic illustrating coverage of the animal’s field of view by the VR projection. Rats can fully rotate their bodies to view a 360° screen and walk in any direction on the treadmill. (F) Rendering of a virtual square arena by the VR software. The image is pre-warped by the software for projection onto the conical screen. Inset: schematic of the animal’s position in the square arena. (G) Simulated partial view of the environment from the rat’s location.
Figure 2
Figure 2. Two behavioral tasks for achieving full coverage of 2D environments in VR
(A) Contiguous trajectories of a rat performing the random foraging task. In each case, a reward is located in one of the unmarked zones, and the rat walks around the environment in search of the rewarded zone (blue). After each success, the target is relocated to another randomly chosen zone. (B) Percent of the environment visited by animals in the random foraging task, as a function of duration of the recording session. Data were averaged across all sessions in 2×2 m environments of a single rat, then averaged across rats. Error bars: standard errors. (C) Contiguous trajectories of a rat performing the target pursuit task. In each case, the center of a rewarded zone is marked by a visible beacon (small cylinder). A circular zone around the beacon was rewarded. (D) Environment coverage in the target pursuit task.
Figure 3
Figure 3. Hippocampal neurons exhibit 2D place fields in VR
(A) Example of a place cells in CA1. Left: animal’s path during a 30 min session (gray) and locations of spikes (red). Right: rate map of the cell. Number indicates maximum firing rates in Hz. (B) Example of a place cell in CA3. (C) Rate maps of 18 simultaneously recorded place cells in CA1. Every cell with a maximum firing rate of >4 Hz is shown. (D) Typical segments of an animal’s trajectory, showing the performance of an algorithm that uses population activity in CA1 to decode the animal’s virtual location. (E) Performance of the decoding algorithm, as a function of the number of cells used in the analysis. Values are mean ± standard errors across all sessions in all rats.
Figure 4
Figure 4. Neurons in the median entorhinal cortex (MEC) exhibit 2D activity patterns
(A) Examples of grid cells. Top: animal’s path (gray) and locations of spikes (red). Middle: rate maps of the grid cells. Numbers indicate maximum firing rates in Hz. Bottom: autocorrelations of the rate maps. Colors range from dark blue (−1 correlation) to dark red (+1 correlation). (B) Distribution of observed gridness scores across all cells (top plot) and gridness scores in randomly reshuffled datasets (bottom plot). Red line: 95th percentile of the reshuffled distribution, used as a threshold to define grid cells. (C) Distribution of grid spacing across all grid cells. Examples from (A) are marked. (C) Polar plots of example head direction cells, showing firing rate as a function of head direction. Numbers indicate the maximum firing rates in Hz. (E) Directional stability scores across all cells, plotted as in (B) and showing the 99th percentile of the reshuffled distribution. (F) Mean vector lengths for all cells that passed the directional stability threshold. Red line: 99th percentile used to define head direction cells. (G) Rate maps of example border cells. Numbers indicate maximum firing rates in Hz. (H) Border scores across all cells, plotted as in (B) and showing the 95th percentile of the reshuffled distribution. (I) Spatial information rates for all cells that passed the border score threshold. Red line: 99th percentile used to define border cells.
Figure 5
Figure 5. Spatial activity patterns in VR follow virtual cues
(A) Schematic of the experiment, in which the image of the virtual environment was rotated relative to the real-world (laboratory) environment. Two mutually rotating reference frames were defined: the real-world (black) and the VR (green). (B) Activity of a CA1 neuron plotted in the VR reference frame. Left: Animal’s path (gray) and locations of spikes (red). Right: Rate map of the cell. Number indicates the maximum firing rate in Hz. (C) Activity of the same neuron as in (B), plotted the same way but in the real-world reference frame. (D) Difference between spatial information rates in the VR and the real-world reference frames across all cells that had spatially modulated activity in either reference frame. Numbers above 0 indicate cells that preferred the VR reference frame. (E) Activity of an MEC neuron plotted in the VR reference frame. Left: Animal’s head direction as a function of time (gray) and spikes fired by the neuron (red). Right: polar plot of the neuron’s firing rate as a function of head direction. Number indicates the maximum firing rate in Hz. (F) Activity of the same neuron as in (E), plotted the same way but in the real-world reference frame. (G) Difference between mean vector lengths in the VR and the real-world reference frames across all cells whose activity was modulated by head direction in either reference frame. Numbers above 0 indicate cells that preferred the VR reference frame.
Figure 6
Figure 6. Place field locations at the beginning of a session are partially influenced by the real world
(A) Schematic of the experiment. The orientation of the virtual environment relative to the real-world (laboratory) was discretely changed between two sessions. (B) Rate maps of three place cells recorded on two sessions; the virtual environment was rotated by 77° between sessions. All place fields reappeared in the same positions relative to the VR. (C) Bottom: All ten recorded place cells, including those in (B). Each row is the cross-correlation of rate maps from the two sessions, with the rate map from session 2 rotated by Δ angle. Colors for each cell are scaled from lowest correlation (white) to highest (black). Top: Average cross-correlation across all ten cells. Peak at 0° indicates that rate maps did not rotate relative to VR. (D–E) Another example, plotted the same way as (B–C). In this example, place fields rotated by 90° relative to the VR. (F–G) Another example, plotted the same way as (B–C). In this example, place fields rotated by 180° relative to the VR. (H) For all pairs of sessions, the angle by which the VR was rotated relative to the real world between sessions (“environment rotation”) and the angle by which place fields rotated relative to the virtual environment (“place field rotation”). In most cases, place fields locked better to the virtual environment (points at 0); in other cases, fields locked better to the real world (points closer to the diagonal). In the latter case, rotations relative to the virtual environment appeared to be constrained to multiples of 90°.
Figure 7
Figure 7. Place cells exhibit different types of remapping in VR
(A) Images of virtual environments used for inducing hippocampal remapping. (B) Example of a CA1 neuron recorded across four alternating sessions in geometrically similar (square) environments. Sessions were 30 min long, separated by 30 min. For each session, Left plots: all recorded spikes, with the spikes of the shown neuron in red. Spikes are plotted in a projection of a 4-dimensional space defined by the amplitudes of the waveforms on the four wires of the tetrode. Right plots: Rate maps of the neuron. All four rate maps are color-scaled to the same maximum firing rate. Numbers indicate maximum firing rates for each session. Rightmost plot: rate map from the first session scaled to its own maximum firing rate. (C) Rate maps of simultaneously recorded place cells on sessions in the two square environments. Colors of all rate maps are independently scaled. Boxed numbers: ratios of peak firing rates; cells are sorted from those more active in square arena B to those more active in square arena A. (D) Example of a CA1 neuron recorded across four alternating sessions in geometrically different (square and circle) environments, plotted the same way as the cell in (B). The cell fired very few spikes on the sessions in the square environment. (E) Rate maps of simultaneously recorded place cells on sessions in the square and circular environments. For each cell, colors are scaled to the maximum firing rate across the two rate maps. (F) Firing rate divergence for all pairs of environments. Higher numbers indicate rate remapping. Values are medians across cells ± bootstrap standard deviations of the median. Dashed line: average divergence across reshuffled datasets, in which cell identities were scrambled. (G) Spatial cross-correlation values for all pairs of environments. Lower numbers indicate global remapping. Values are medians across pairs of sessions ± bootstrap standard deviations of the median. Dashed line: average cross-correlation across reshuffled datasets.

References

    1. Aflalo TN, Graziano MS. Four-dimensional spatial reasoning in humans. Journal of experimental psychology Human perception and performance. 2008;34:1066–1077. - PubMed
    1. Ahrens MB, Huang KH, Narayan S, Mensh BD, Engert F. Two-photon calcium imaging during fictive navigation in virtual environments. Frontiers in neural circuits. 2013;7:104. - PMC - PubMed
    1. Anderson MI, Jeffery KJ. Heterogeneous modulation of place cell firing by changes in context. The Journal of neuroscience : the official journal of the Society for Neuroscience. 2003;23:8827–8835. - PMC - PubMed
    1. Barry C, Hayman R, Burgess N, Jeffery KJ. Experience-dependent rescaling of entorhinal grids. Nature neuroscience. 2007;10:682–684. - PubMed
    1. Barry C, Lever C, Hayman R, Hartley T, Burton S, O’Keefe J, Jeffery K, Burgess N. The boundary vector cell model of place cell firing and spatial memory. Reviews in the neurosciences. 2006;17:71–97. - PMC - PubMed

Publication types