. 2014 Oct 22:8:852.
doi: 10.3389/fnhum.2014.00852. eCollection 2014.

Fetal functional imaging portrays heterogeneous development of emerging human brain networks

Affiliations

Fetal functional imaging portrays heterogeneous development of emerging human brain networks

András Jakab et al. Front Hum Neurosci. .

Abstract

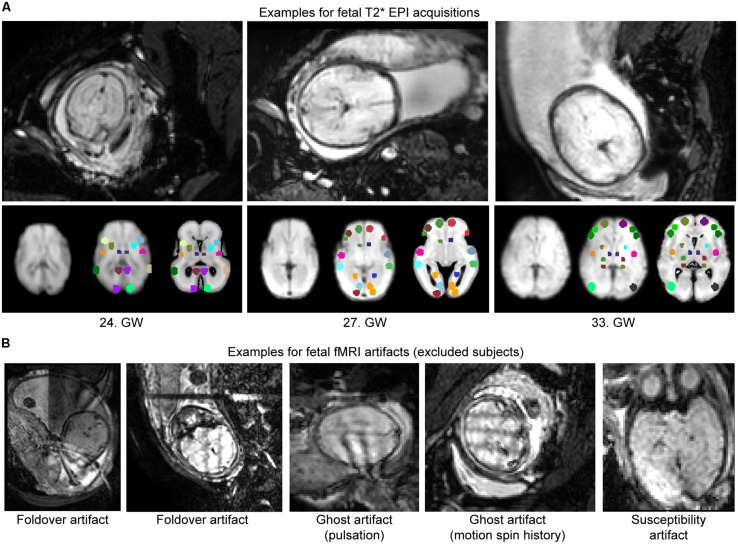
The functional connectivity architecture of the adult human brain enables complex cognitive processes, and exhibits a remarkably complex structure shared across individuals. We are only beginning to understand its heterogeneous structure, ranging from a strongly hierarchical organization in sensorimotor areas to widely distributed networks in areas such as the parieto-frontal cortex. Our study relied on the functional magnetic resonance imaging (fMRI) data of 32 fetuses with no detectable morphological abnormalities. After adapting functional magnetic resonance acquisition, motion correction, and nuisance signal reduction procedures of resting-state functional data analysis to fetuses, we extracted neural activity information for major cortical and subcortical structures. Resting fMRI networks were observed for increasing regional functional connectivity from 21st to 38th gestational weeks (GWs) with a network-based statistical inference approach. The overall connectivity network, short range, and interhemispheric connections showed sigmoid expansion curve peaking at the 26-29 GW. In contrast, long-range connections exhibited linear increase with no periods of peaking development. Region-specific increase of functional signal synchrony followed a sequence of occipital (peak: 24.8 GW), temporal (peak: 26 GW), frontal (peak: 26.4 GW), and parietal expansion (peak: 27.5 GW). We successfully adapted functional neuroimaging and image post-processing approaches to correlate macroscopical scale activations in the fetal brain with gestational age. This in vivo study reflects the fact that the mid-fetal period hosts events that cause the architecture of the brain circuitry to mature, which presumably manifests in increasing strength of intra- and interhemispheric functional macro connectivity.

Keywords: connectome; fetal brain connectivity; fetal brain development; fetal functional MRI; prenatal development.


Figures

FIGURE 1
FIGURE 1
Work diagram of the fMRI processing steps. The names of the respective image processing toolboxes are given in bold. BET, brain extraction tool; FLIRT, FSL linear registration tool; FNIRT, FSL non-linear registration tool; CompCor, component based noise correction method; AFNI, analysis of functional neuroimages.
FIGURE 2
FIGURE 2
Registration of fetal fMRI data to anatomical standard images and ROI propagation across developmental phases. (A) Landmark-based initial registration was used to match the averaged BOLD fMRI images of fetuses and GW specific fetal template brains. FP, fontal pole; LV, lateral ventricles, frontal horn; TP, temporal pole; TA, thalamic adhesion (midline); IP, midline point of the interpeduncular cleft in the midbrain; CX, topmost point of the convexities; OP, occipital pole. (B) Second step of the fetal to standard image registration, carried out with intensity-based algorithms: linear (FLIRT) and non-linear (FNIRT) registrations in the FSL software. (C) Establishing GW-specific regions with a longitudinal label propagation approach. First row: for each GW from the 23rd to the 37th, a high-resolution anatomical template was used, between which pair-wise non-linear transformations were calculated (second row). These transformations were used to transform the ROI system into any GW (third and fourth rows).
FIGURE 3
FIGURE 3
Fetal brain atlas used for fMRI time-course calculation: ROI system and anatomical nomenclature. (A) Illustration of the region propagation procedure. Using high-resolution anatomical templates, we marked 90 anatomically relevant regions on the fetal cortical surface, which was then propagated through the investigated gestational period. Three-dimensional renderings and cross-sectional anatomical images with ROIs are shown. (B) Anatomical nomenclature of the ROI system. Correspondence to major lobes or systems is marked with different colors: red = frontal lobe; blue = parietal lobe; purple = occipital lobe; yellow = temporal lobe; green = subcortical; pink = limbic/cingulate gyrus.
FIGURE 4
FIGURE 4
Illustration of typical fetal in-scanner head motion patterns, correlation with gestational age. (A) Fetal head motion during MR scanning is estimated by frame-to-frame linear registrations. We illustrate a fetus with excessive head movements, as indicated by the large peaks in the translation and rotational components. Total displacement was used to censor periods of the scan with large motion (middle panel, red markings). (B) The motion correction procedure reduces the temporal variance of peripheral brain voxels, as shown in the cross-sectional panels. Such regions of high, spurious temporal variance give rise to nuisance signals in the functional connectivity patterns. (C) Depiction of gestational age-dependent changes of head motion. Top: median, 25th percentile, 75th percentile and maximum displacements of the fetal head vs. GWs. Bottom: the ratio of censored data vs. GWs. In our study cohort, fetal in-scanner head motion does not show correlation with gestational age.
FIGURE 5
FIGURE 5
Estimating physiological noise components for the correction of fetal fMRI signal using an adaptation of the CompCor approach. Top row: white matter and CSF components are segmented from the GW-specific anatomical templates. Segmentations are transformed to individual subjects (bottom row) while the voxels with highest temporal variation, and other, extra-axial structures, are calculated from the data. These voxels are used to perform the component-based filtering of the nuisance signal, according to the CompCor method described by Behzadi et al. (2007). PCs, principal components.
FIGURE 6
FIGURE 6
Examples for fetal fMRI and the most common imaging artifacts. (A) Fetal fMRI with full FOV. Bottom panels: standardized functional image, ROI system warped to the standardized image and the fetal atlas systems illustrated. We provide 1–1 examples from the GWs 24, 27, and 33. (B) Fetal fMRI is a challenging imaging modality with many artifacts to expect. We illustrate this by excluded subjects’ cross-sectional images. Examples for fold-over artifact, ghost artifact and susceptibility artifacts are shown.
FIGURE 7
FIGURE 7
Results of the functional connectivity analysis: spectral coherence of time-courses, developmental trajectory of developing fetal intrinsic functional connectivity. (A) Spectral coherence analysis of fetal fMRI time-courses. The mean coherence plot (black line) was derived for all pairs of fetal functional time-courses at all GWs. Gray line depicts the interquartile range of observation across subjects. The plot is dominated by two peaks, representing low-frequency synchronicity at 0.0377 Hz and possible noise correlation at 0.445 Hz. Bold line: mean coherence, dotted lines: SD. (B) Development of the fetal functional brain connectome, gestational age-dependent distribution of functional connections. We illustrate the sigmoid curve-fitting on individual average network connectivity strength measurements. Each point in the graph refers to the mean intrinsic functional connectivity of a fetus, which calculation was restricted to the values that were found to be significantly associated with gestational age. Half-inflation point of the curve is found at the 27th GW and it depicts the gestational age in which the maximum increase of intrinsic functional connectivity is found. (C) Developmental expansion of the fetal functional brain connectome, visualization as matrices and 3D graphs. Two stages of the development are depicted: prior to the presumed expansion of functional connectivities (21st–26th GWs) and after this period. This dichotomy was defined using the average intrinsic functional connectivity values (B). The transparence of each edge in the 3D visualization (left images) refers to the population mean of the intrinsic functional connectivity (Z-score). The size of nodes in the network depiction is proportional to the sum of connectivity values over all edges that are connected to them. Group-mean network edges were visualized using a threshold of Z = 0.45. Graphs were overlaid on anatomical templates from the 23rd and 37th GWs. The mean connectivity networks are also visualized as connectivity matrices, Fs, frontal regions, Os, occipital regions.
FIGURE 8
FIGURE 8
Region-specific development of functional connectivity in the fetal brain. (A) In these visualizations, a regional sub-network was defined to include all connections within a brain lobe, and these were restricted for the edges which connectivity values showed significant correlation with gestational age. Plots depict significant age effects on functional connectivity within each sub-network. Components of sub-networks are depicted as graphs, overlaid onto a 25th-GW brain template model. In this form of visualization, graph edges refer to a functional connection (Z-score) between two areas, while the brain areas are represented as nodes. Node size refers to the sum of its connections, weighted by the functional connectivity. (B) Regional timing of functional brain connectivity expansion during the late second and third trimester, variability of the observed inflation times during the bootstrapping procedure. According to the hypothesis that functional connectivities exhibit non-linear growth characteristics rather than a linear trend during the mid-fetal period, it is possible to determine the gestational age of inflation by sampling. 50% of the measurement points were sampled randomly during this procedure, and the relative probability estimates of the inflation points of the fitted functions are depicted against the gestational age. The distribution of sampled connections indicates a sequence of occipital, temporal, frontal, and parietal development of intrinsic functional connectivity values.

References

    1. Achard S., Salvador R., Whitcher B., Suckling J., Bullmore E. (2006). A resilient, low-frequency, small-world human brain functional network with highly connected association cortical hubs. J. Neurosci. 26 63–72. 10.1523/JNEUROSCI.3874-05.2006 - DOI - PMC - PubMed
    1. Behzadi Y., Restom K., Liau J., Liu T. T. (2007). A component based noise correction method (CompCor) for BOLD and perfusion based fMRI. Neuroimage 37 90–101. 10.1016/j.neuroimage.2007.04.042 - DOI - PMC - PubMed
    1. Birn R. M., Murphy K., Bandettini P. A. (2008). The effect of respiration variations on independent component analysis results of resting state functional connectivity. Hum. Brain Mapp. 29 740–750. 10.1002/hbm.20577 - DOI - PMC - PubMed
    1. Buckner R. L., Krienen F. M. (2013). The evolution of distributed association networks in the human brain. Trends Cogn. Sci. (Regul. Ed.) 17 648–665. 10.1016/j.tics.2013.09.017 - DOI - PubMed
    1. Buckner R. L., Krienen F. M., Yeo B. T. T. (2013). Opportunities and limitations of intrinsic functional connectivity MRI. Nat. Neurosci. 16 832–837. 10.1038/nn.3423 - DOI - PubMed