. 2014 Nov 6;8(11):e3158.
doi: 10.1371/journal.pntd.0003158. eCollection 2014.

Epidemiological trends of dengue disease in Mexico (2000-2011): a systematic literature search and analysis

Affiliations

Epidemiological trends of dengue disease in Mexico (2000-2011): a systematic literature search and analysis

Héctor Gómez Dantés et al. PLoS Negl Trop Dis. .

Abstract

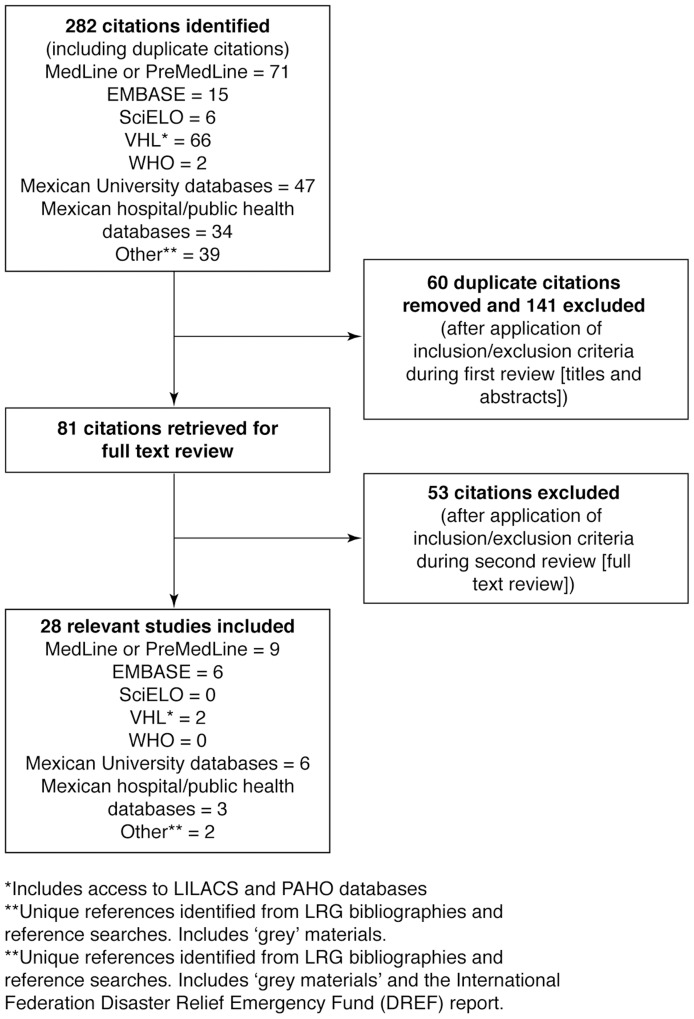
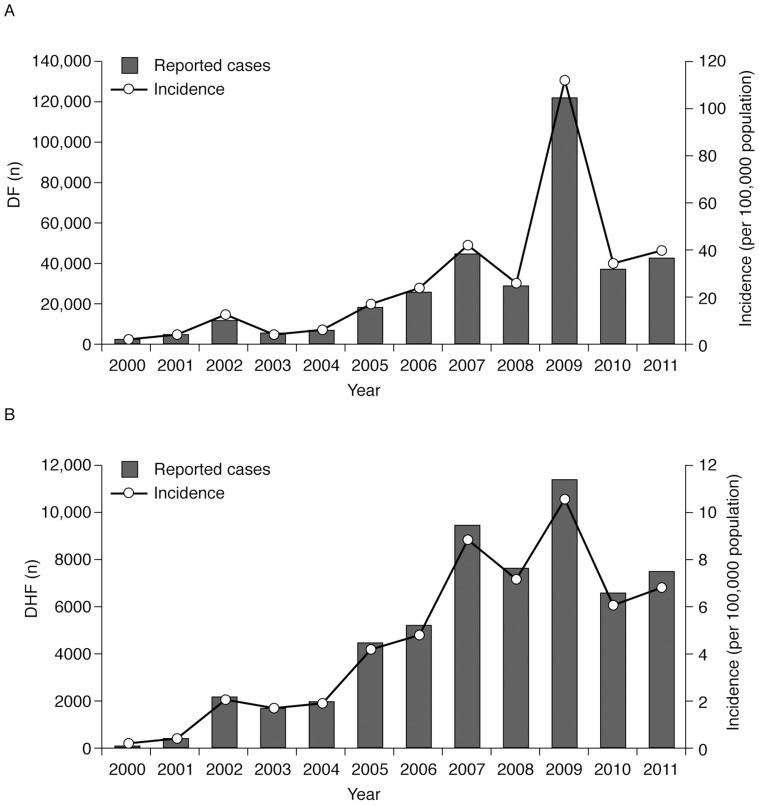
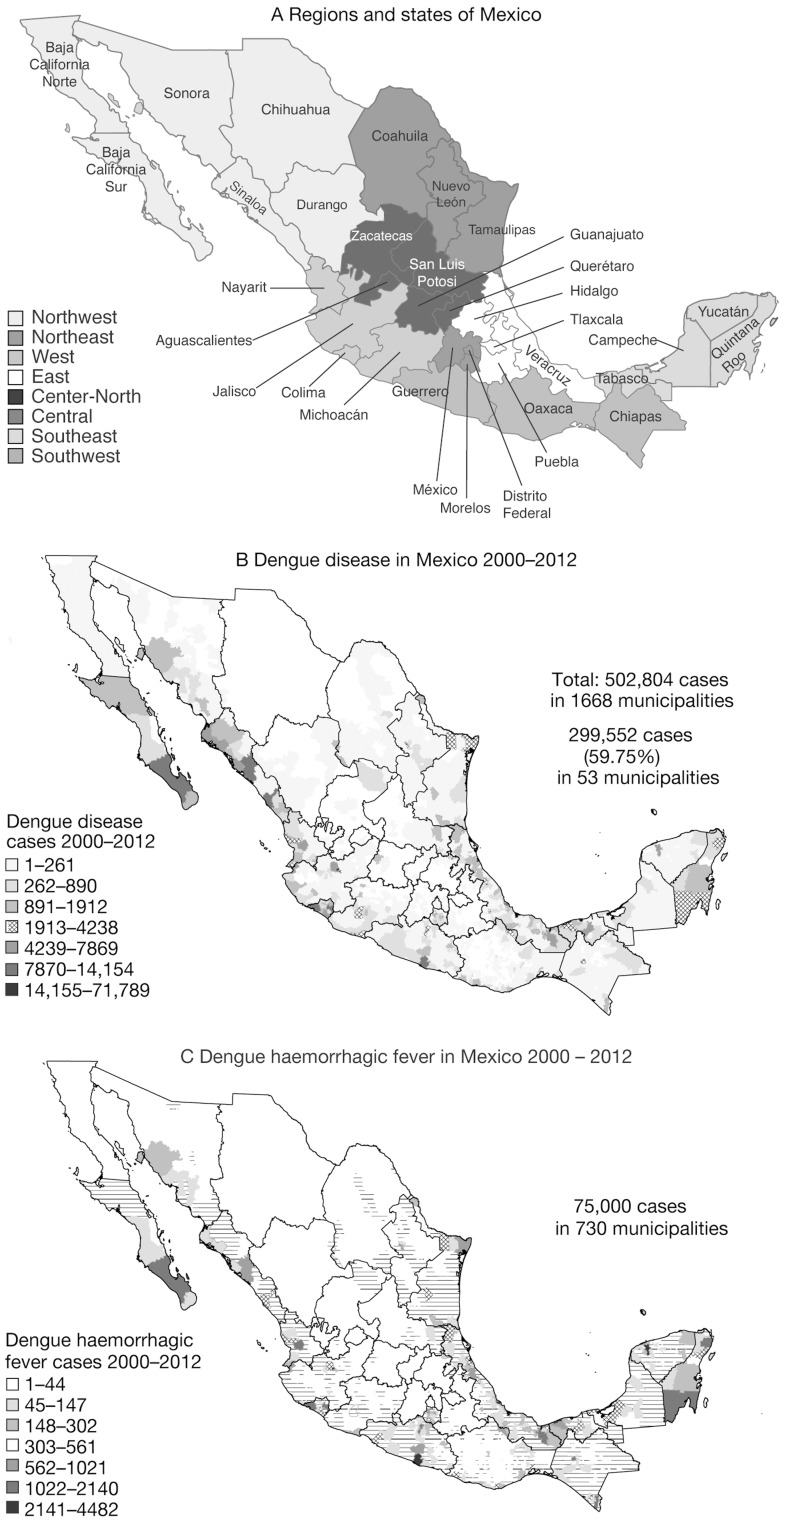
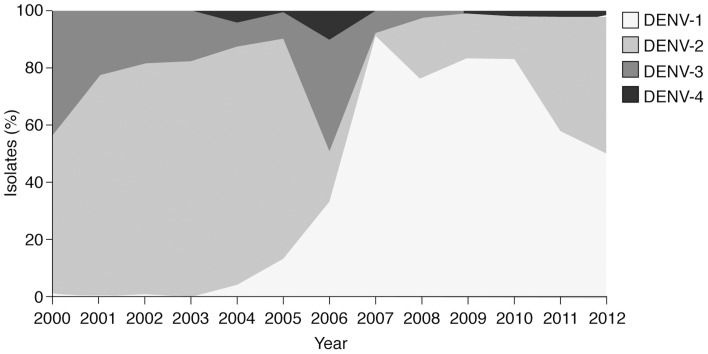
This systematic literature review describes the epidemiology of dengue disease in Mexico (2000-2011). The annual number of uncomplicated dengue cases reported increased from 1,714 in 2000 to 15,424 in 2011 (incidence rates of 1.72 and 14.12 per 100,000 population, respectively). Peaks were observed in 2002, 2007, and 2009. Coastal states were most affected by dengue disease. The age distribution pattern showed an increasing number of cases during childhood, a peak at 10-20 years, and a gradual decline during adulthood. All four dengue virus serotypes were detected. Although national surveillance is in place, there are knowledge gaps relating to asymptomatic cases, primary/secondary infections, and seroprevalence rates of infection in all age strata. Under-reporting of the clinical spectrum of the disease is also problematic. Dengue disease remains a serious public health problem in Mexico.


Conflict of interest statement

HGD and JAFA declare that they have no conflicts of interest. ES is employed by Sanofi Pasteur. All authors confirm that they had full access to all data identified during the literature search and analysis, and had final responsibility for the decision to submit for publication. This does not alter our adherence to all PLOS policies on sharing data and materials.

Figures

Figure 1
Figure 1. Evaluation of studies according to the preferred reporting items of systematic reviews and meta-analyses (PRISMA).
All references identified in the online database searches were assigned a unique identification number. Following the removal of duplicates and articles that did not satisfy the inclusion criteria from review of the titles and abstracts, the full papers of the first selection of references were retrieved either electronically or in paper form. A further selection was made based on review of the full text of the articles.
Figure 2
Figure 2. Reported number and incidence of dengue fever and dengue haemorrhagic fever cases, Mexico, 2000–2011 .
Over the period of the literature survey (2000–2011), the overall annual number of confirmed cases of (A) dengue fever (DF) and (B) dengue haemorrhagic fever (DHF) increased considerably in Mexico. The increase in number of cases and population incidence over time was not linear and peaks were observed in 2002, 2007, and 2009.
Figure 3
Figure 3. Geographical distribution of dengue disease and dengue haemorrhagic fever cases in Mexico, 2000–2012 , .
Regional populations in Mexico are exposed to differing magnitudes of dengue disease risk due to the mix of epidemic, endemic, and hyperendemic areas. Mexico is divided into 31 states and one federal district that contains the capital, Mexico City (A). These dispersion maps of dengue disease and DHF throughout Mexico highlights the regional pattern of the occurrence of (B) dengue disease and (C) dengue haemorrhagic fever with high concentrations of cases in the important tourist and commercial centres on the coast and in tropical areas.
Figure 4
Figure 4. Circulation of dengue virus serotypes in Mexico, 2000–2011 , , .
Data shown are number cases (incidence per 100,000 population). All four DENV serotypes were in circulation during the review period, although the predominant serotype varied between years: at the beginning of the review period, DENV-2 was the predominant serotype (2000–2005). DENV-1 became predominant in 2006–2010, after which DENV-1 and -2 isolates were present in similar proportions. DENV-3 isolates were more common before 2007. DENV-4 isolates were present at low levels in most years after 2003.

References

    1. World Health Organization (2009) Dengue: guidelines for diagnosis, treatment, prevention and control. New edition. Geneva. Available: http://whqlibdoc.who.int/publications/2009/9789241547871_eng.pdf. Accessed 09 October 2013. - PubMed
    1. World Health Organization (2012) Impact of dengue; 2012. Available: http://www.who.int/csr/disease/dengue/impact/en/. Accessed 09 October 2013.
    1. Bhatt S, Gething PW, Brady OJ, Messina JP, Farlow AW, et al. (2013) The global distribution and burden of dengue. Nature 496: 504–547 10.1038/nature12060 - DOI - PMC - PubMed
    1. Scientific Working Group on Dengue (2007) Report of the Scientific Working Group on Dengue, 1–5 October 2006. Geneva: World Health Organization. Available: http://www.who.int/tdr/publications/documents/swg_dengue_2.pdf. Accessed: 09 October 2013.
    1. Barclay E (2008) Is climate change affecting dengue in the Americas? Lancet 371: 973–974 10.1016/S0140-6736(08)60435-3 - DOI - PubMed

Publication types