. 2014 Nov 6;9(11):e111168.
doi: 10.1371/journal.pone.0111168. eCollection 2014.

The Porphyromonas gingivalis ferric uptake regulator orthologue binds hemin and regulates hemin-responsive biofilm development

Affiliations

The Porphyromonas gingivalis ferric uptake regulator orthologue binds hemin and regulates hemin-responsive biofilm development

Catherine A Butler et al. PLoS One. .

Abstract

Porphyromonas gingivalis is a Gram-negative pathogen associated with the biofilm-mediated disease chronic periodontitis. P. gingivalis biofilm formation is dependent on environmental heme for which P. gingivalis has an obligate requirement as it is unable to synthesize protoporphyrin IX de novo, hence P. gingivalis transports iron and heme liberated from the human host. Homeostasis of a variety of transition metal ions is often mediated in Gram-negative bacteria at the transcriptional level by members of the Ferric Uptake Regulator (Fur) superfamily. P. gingivalis has a single predicted Fur superfamily orthologue which we have designated Har (heme associated regulator). Recombinant Har formed dimers in the presence of Zn2+ and bound one hemin molecule per monomer with high affinity (Kd of 0.23 µM). The binding of hemin resulted in conformational changes of Zn(II)Har and residue 97Cys was involved in hemin binding as part of a predicted -97C-98P-99L- hemin binding motif. The expression of 35 genes was down-regulated and 9 up-regulated in a Har mutant (ECR455) relative to wild-type. Twenty six of the down-regulated genes were previously found to be up-regulated in P. gingivalis grown as a biofilm and 11 were up-regulated under hemin limitation. A truncated Zn(II)Har bound the promoter region of dnaA (PGN_0001), one of the up-regulated genes in the ECR455 mutant. This binding decreased as hemin concentration increased which was consistent with gene expression being regulated by hemin availability. ECR455 formed significantly less biofilm than the wild-type and unlike wild-type biofilm formation was independent of hemin availability. P. gingivalis possesses a hemin-binding Fur orthologue that regulates hemin-dependent biofilm formation.


Conflict of interest statement

Competing Interests: The authors have declared that no competing interests exist.

Figures

Figure 1
Figure 1. Alignment of Fur family proteins with PGN_1503 (Har) from P. gingivalis ATCC 33277.
Fur family proteins were aligned using COBALT with P. gingivalis Har (PgHar; UniProt B2RKX7). Seven of these proteins have structures in the Protein DataBank: HpFur is the iron responsive Fur from Helicobacter pylori (UniProt B9XY52), VcFur is the iron-responsive Fur from Vibrio cholerae (UniProt P0C6C8), PaFur is the iron-responsive Fur from Pseudomonas aeruginosa (UniProt Q03456), EcFur is the iron-responsive Fur from Escherichia coli (UniProt P0A9A9), MtZur is the zinc-responsive FurB from Mycobacterium tuberculosis (UniProt O05839), ScNur is the nickel-responsive Nur from Streptomyces coelicolor (UniProt Q9K4F8) and BsPerR is the peroxide-responsive PerR from Bacillus subtilis (UniProt P71086). The other three Fur family proteins are BfFur, an iron-responsive Fur from Bacteroides fragilis NCTC9343 (UniProt Q64QR6), RlMur and RlIrr, the manganese-responsive Mur (UniProt Q1MMB4) and the iron response regulator Irr (UniProt Q1MN49) respectively, from Rhizobium leguminosarum bv. viciae (strain 3841). * indicates identical amino acids in all 11 proteins. Shading indicates residues experimentally confirmed to be involved in the three distinct metal binding sites: S1 in blue; S2 in red, S3 in yellow as reported in Dian et al. , except for those in PgHar, BfFur and RlMur which were inferred by similarity to the other sequences. The five residues underlined in RlIrr show the amino acids that would make up S2 and although Irr has been shown to bind metals in vitro, the metal binding site is still unknown. The principal heme binding site of RlIrr is the HxH motif shaded green , which is part of the S2 motif. The putative heme regulatory motif of PgHar is boxed.
Figure 2
Figure 2. Zinc binding by recombinant Har.
Purified Har (5 µM) was buffer exchanged into ammonium acetate (10 mM) via extensive dialysis at 4°C and subjected to ESI-MS analysis on a Quadropole-Time of Flight mass spectrometer (Agilent) in the positive mode with a fragmentor voltage of 200-300 V and a skimmer voltage of 65 V at a flow rate of 500 µL/h for direct syringe infusion delivery to the electrospray probe in the presence (A) and absence (B) of 0.1% v/v formic acid in the mobile phase. The average molar masses were obtained by application of a deconvolution algorithm to the recorded spectra and were calibrated with horse heart myoglobin (16951.5 Da).
Figure 3
Figure 3. Dimerization of Zn(II)Har, Zn(II)C97A and Zn(II)Har150.
Representative elution profiles of Zn(II)Har/Zn(II)C97A (A) and Zn(II)Har150 (B) from a Superdex 75 analytical gel filtration column at 4°C in an AKTA FPLC Chromatographic System (GE Healthcare). Proteins (100 µg) were applied to the column pre-equilibrated with 500 mM NaCl containing buffers (20 mM) at pH 6.0 (MES), pH 7.0 (HEPES), 7.4 (KPi) and 8.5 (borate). The molar masses were calculated against a calibration curve of retention volumes (Ve) of the protein standards, which are indicated at the top of the chart. The elution profiles at pH 7.0 are presented.
Figure 4
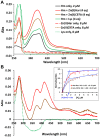
Figure 4. Spectrometric determination of hemin binding by Zn(II)Har and Zn(II)C97A.
Hemin (Hm, 1–2 µM) in TBS was incubated with Zn(II)Har and Zn(II)C97A at protein to hemin molar ratios of 0∶1 to 4∶1 for 1 h and solution spectra collected on a Cary 50 UV-visible spectrometer (Varian). Lysozyme (Lys) was used as a negative control (green lines). (A) Absorption spectra of 2 µM free hemin, 8 µM Zn(II)Har or Zn(II)C97A, and hemin plus four equivalents of Zn(II)Har or Zn(II)C97A. Based on the hemin binding affinities of Zn(II)Har and Zn(II)C97A estimated in (B), at the starting protein:hemin molar ratio of 4∶1, free hemin in the equilibrium solution was 3.8% and 15.3% of the total hemin after reaction with Zn(II)Har and Zn(II)C97A, respectively. (B) Spectra of 1∶1 protein to hemin (2 µM) molar ratio are presented as a subtraction from the spectrum of hemin only (red line for Zn(II)Har, brown line for Zn(II)C97A, green line for lysozyme). The hemin binding affinity of the protein was estimated by fitting the absorbance changes at 419 nm for Zn(II)Har and Zn(II)C97A against protein concentrations (inset) using the biochemical analysis program Dynafit . Inset: Fitted titration curves, apparent dissociation constants (Kd) and the titration data point sets of the normalised absorbance at 419 nm for Zn(II)Har and Zn(II)C97A. Estimation of binding stoichiometry is shown in blue. P: protein.
Figure 5
Figure 5. Divalent metal cation binding by Zn(II
)Har. Fluorescence spectroscopic titration of Zn(II)Har with ferrous ions and manganese ions in HEPES (5 mM, pH 7.0) containing 250 mM NaCl in the presence of TCEP (2 mM). Change in fluorescence emission intensity of Zn(II)Har (8 µM) at 305 nm upon addition of 0 – 3.3 molar equivalent Fe2+ (A) and 0 – 8 molar equivalent Mn2+ (B), with each set of presented data being averaged from three individual titrations. Apparent dissociation constants (Kd) were estimated by fitting the titration data using the biochemical analysis program Dynafit . λex = 275 nm.
Figure 6
Figure 6. EMSA of Zn(II)Har150 binding to DNA.
(A). Agarose gel electrophoresis stained with SYBR Safe DNA gel stain (Life Technologies) for visualizing DNA. Lane 1, HyperladderI (Bioline) DNA size markers in bp. Lanes 2–7, 9 & 11 all contain 500 ng (0.2 µM) of a 240 bp PCR product encompassing the 33277 dnaA promoter sequence (PGN_0001). Additionally, lane 3 has 1 µg (2.8 µM) Zn(II)Har150; lane 4, 2 µg (5.6 µM) Zn(II)Har150; lane 5, 3 µg (8.4 µM) Zn(II)Har150; lane 6, 4 µg (11.2 µM) Zn(II)Har150 and lane 7, 5 µg (14 µM) Zn(II)Har150. Lane 2 contains DNA only whereas Lane 8 contains 5 µg (14 µM) Zn(II)Har150 only. Lanes 9 – 12 contain the negative control protein for DNA binding, BSA, where there is 5 µg BSA in lanes 9 & 10, and 3 µg BSA in lanes 11 & 12. (B). Agarose gel electrophoresis stained with SimplyBlue SafeStain (Life Technologies) for visualizing protein following DNA visualisation. Lanes are as described in (A). The position of the anode (+) and cathode (-) are noted. (C). EMSA competition experiment where an excess of unlabeled dnaA promoter DNA (1250 ng) competed with 250 ng (0.1 µM) FAM-labeled dnaA promoter DNA for binding to 3 µg (8.4 µM) Zn(II)Har150 (lane 3). Lane 1 contains 250 ng FAM-labeled DNA only, whereas lane 2 contains 250 ng FAM-labeled DNA bound to 3 µg Zn(II)Har150. Visualised is the fluorescence of the FAM-labeled DNA after agarose gel electrophoresis (D) EMSA experiment where the promoter-containing DNA of PGN_1308 (lanes 1–3) was shifted by its cognate transcriptional repressor (lane 2) but not by Zn(II)Har150 (lane 3). (E). Inhibition of Zn(II)Har150 DNA binding by hemin. The addition of increasing concentrations of hemin (lane 3, 0 µM; lane 4, 14 µM; lane 5, 70 µM; lane 6, 140 µM) to a constant amount of DNA (500 ng, lanes 2–6) and Zn(II)Har150 (14 µM, lanes 3–6) resulted in increasing inhibition of DNA binding by Zn(II)Har150. Lane 1, HyperladderI (Bioline) DNA size markers in bp. Agarose gel electrophoresis stained with SYBR Safe DNA gel stain (Life Technologies) for visualizing DNA.
Figure 7
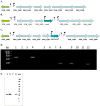
Figure 7. Genomic arrangement of P. gingivalis ATCC 33277 in (A) the wild-type strain, (B) har mutant strain ECR455 and (C) har complemented strain ECR475.
‘P’ denotes promoter positions, the arrows above ‘P’ denote the direction of transcription whilst the stem loop following ermF indicates a Rho-independent transcriptional terminator. Not drawn to scale. (D) RT-PCR analysis of PGN_1504 and PGN_1503 (har). Reverse transcription of ECR455 and ECR475 RNA was performed using random hexamers. PCR was then performed using oligonucleotide primers specific for PGN_1504 (lanes 1–4) or PGN_1503 (har) (lanes 5–8 and 9–12). The templates used for PCR were: reverse transcribed ECR455 RNA (lanes 1 and 5), reverse transcribed ECR475 RNA (lane 9), RNA that was not reverse transcribed (lanes 2, 6 and 10), no template (lanes 3, 7 and 11) and P. gingivalis ATCC 33277 genomic DNA (lanes 4, 8 and 12). PGN_1504 transcript was detected in the har mutant ECR455 (lane 1), whilst PGN_1503 (har) transcript was not detected in the har mutant strain ECR455 (lane 5), but was detected in the har complemented strain ECR475 (lane 9). (E) Western blot detection of Har expression in P. gingivalis 33277, ECR455 and ECR475. Cytoplasmic protein extracts (25 µg) from P. gingivalis strains 33277 (B), ECR455 (C), ECR475 (D) and 5 ng purified Har (A) were separated on a 4–12% Bis-Tris polyacrylamide gel (Invitrogen) before Western transfer and blotting with anti-rHar sera. Har protein was detected in the 33277 wild-type and ECR475 complement, but not the ECR455 mutant strain.
Figure 8
Figure 8. P. gingivalis biofilm development.
Orthogonal projections of CLSM images showing a representative region of the x-y plane over the depth of the biofilm in both xz and yz dimensions of the ATCC 33277 wild-type, har mutant ECR455 and har complement ECR 475 strains grown in excess hemin (A) or hemin-limitation (B). Comparison of the Biovolume (C), Average Thickness (D) and SA:Biovolume (E) calculated for each strain's biofilm growth in either excess hemin (dark bars) or limited hemin (light bars) over three independent experiments. All biometric parameters analysed for the biofilms formed by ATCC 33277 and ECR475 were significantly (p<0.005) altered when hemin was limited. * indicates a significant difference in excess hemin versus limited hemin (p<0.005); ** indicates a significant difference in ECR455 biovolume, average thickness and SA:biovolume when compared to the same biometric parameters of both the ATCC 33277 and ECR475 biofilms (p<0.001).

Similar articles

Cited by

References

    1. Loesche WJ, Syed SA, Morrison EC, Laughon B, Grossman NS (1981) Treatment of periodontal infections due to anaerobic bacteria with short-term treatment with metronidazole. J Clin Periodontol 8: 29–44. - PubMed
    1. Slots J (1977) Microflora in the healthy gingival sulcus in man. Scand J Dent Res 85: 247–254. - PubMed
    1. Spiegel CA, Hayduk SE, Minah GE, Krywolap GN (1979) Black-pigmented Bacteroides from clinically characterized periodontal sites. J Periodontal Res 14: 376–382. - PubMed
    1. Van Dyke TE, Offenbacher S, Place D, Dowell VR, Jones J (1988) Refractory periodontitis: mixed infection with Bacteroides gingivalis and other unusual Bacteroides species. A case report. J Periodontol 59: 184–189. - PubMed
    1. White D, Mayrand D (1981) Association of oral Bacteroides with gingivitis and adult periodontitis. J Periodontal Res 16: 259–265. - PubMed

Publication types

MeSH terms