. 2014 Nov 6;10(11):e1004771.
doi: 10.1371/journal.pgen.1004771. eCollection 2014 Nov.

Regulation of mRNA abundance by polypyrimidine tract-binding protein-controlled alternate 5' splice site choice

Affiliations

Regulation of mRNA abundance by polypyrimidine tract-binding protein-controlled alternate 5' splice site choice

Fursham M Hamid et al. PLoS Genet. .

Abstract

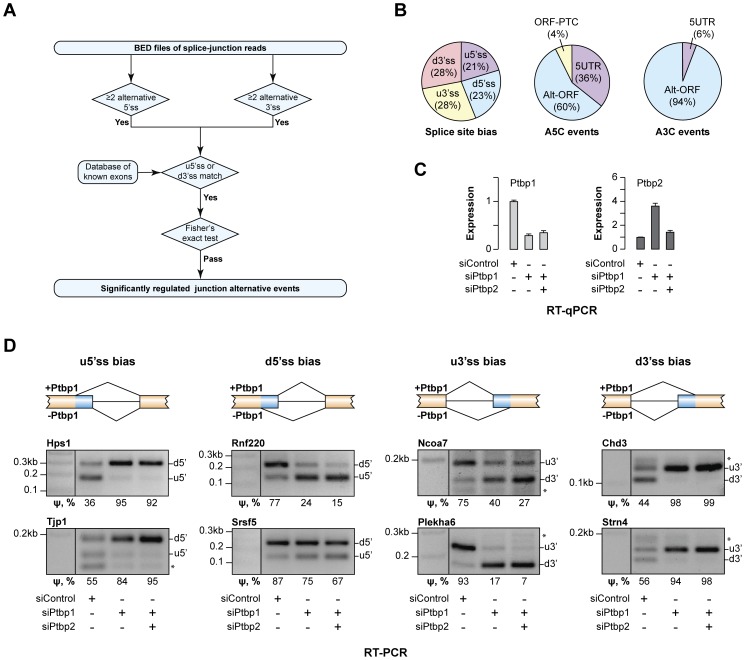
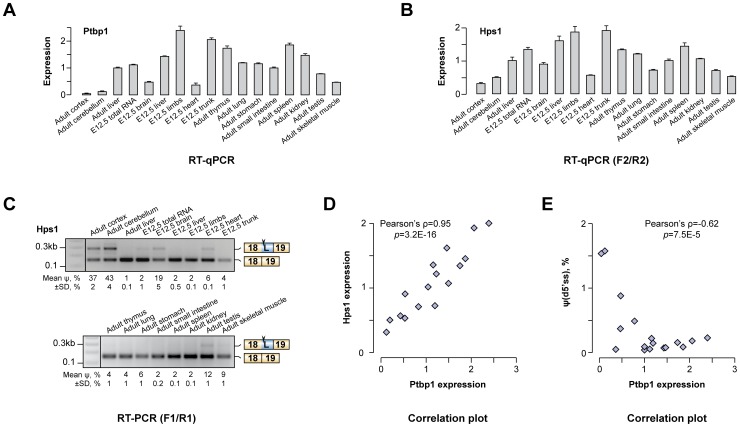
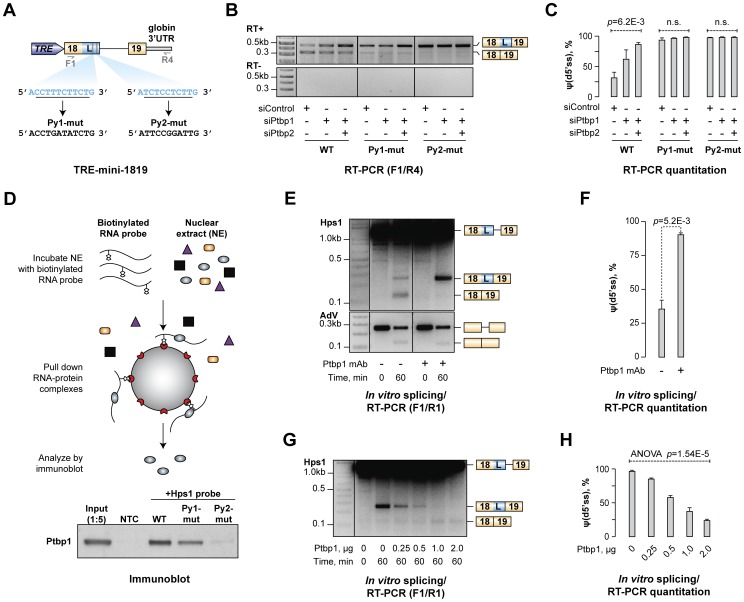
Alternative splicing (AS) provides a potent mechanism for increasing protein diversity and modulating gene expression levels. How alternate splice sites are selected by the splicing machinery and how AS is integrated into gene regulation networks remain important questions of eukaryotic biology. Here we report that polypyrimidine tract-binding protein 1 (Ptbp1/PTB/hnRNP-I) controls alternate 5' and 3' splice site (5'ss and 3'ss) usage in a large set of mammalian transcripts. A top scoring event identified by our analysis was the choice between competing upstream and downstream 5'ss (u5'ss and d5'ss) in the exon 18 of the Hps1 gene. Hps1 is essential for proper biogenesis of lysosome-related organelles and loss of its function leads to a disease called type 1 Hermansky-Pudlak Syndrome (HPS). We show that Ptbp1 promotes preferential utilization of the u5'ss giving rise to stable mRNAs encoding a full-length Hps1 protein, whereas bias towards d5'ss triggered by Ptbp1 down-regulation generates transcripts susceptible to nonsense-mediated decay (NMD). We further demonstrate that Ptbp1 binds to pyrimidine-rich sequences between the u5'ss and d5'ss and activates the former site rather than repressing the latter. Consistent with this mechanism, u5'ss is intrinsically weaker than d5'ss, with a similar tendency observed for other genes with Ptbp1-induced u5'ss bias. Interestingly, the brain-enriched Ptbp1 paralog Ptbp2/nPTB/brPTB stimulated the u5'ss utilization but with a considerably lower efficiency than Ptbp1. This may account for the tight correlation between Hps1 with Ptbp1 expression levels observed across mammalian tissues. More generally, these data expand our understanding of AS regulation and uncover a post-transcriptional strategy ensuring co-expression of a subordinate gene with its master regulator through an AS-NMD tracking mechanism.


Conflict of interest statement

The authors have declared that no competing interests exist.

Figures

Figure 1
Figure 1. Ptbp1 regulates the choice between alternate 5′ and 3′ splice sites for an extensive set of genes.
(A) Data analysis workflow used to identify regulated A5C and A3C splice junctions. (B) Summary of newly identified events regulated by Ptbp1. The pie chart on the left classifies A5C and A3C events based on whether Ptbp1 and Ptbp2 bias the AS choice towards upstream or downstream splice site alternative. The other two pie charts categorize A5C and A3C events according to their effect on mRNA function. (C) CAD cells were treated with Ptbp1-specific siRNA (siPtbp1), a mixture of siPtbp1 and Ptbp2-specific siRNA (siPtbp2) or control siRNA (siControl) and the expression levels of Ptbp1 and Ptbp2 mRNAs were analyzed by RT-qPCR. Data are averaged from 3 independent experiments ±SD. (D) RT-PCR validation of examples of the four splicing topologies (Ptbp1-biased choice of u5′ss, d5′ss, u3′ss or d3′ss) in CAD samples treated as in (C). ψ (percent spliced in) values shown at the bottom indicate the abundance of the longer splice product isoform as percentage of the total. Data are averaged from 3 independent analyses.
Figure 2
Figure 2. Ptbp1 regulates Hps1 mRNA abundance through AS-NMD.
(A) Hps1 gene structure with a close-up of the exon 15-exon 19 segment. The arrowhead indicates premature termination codon (PTC) in the longer (L) isoform of exon 18 and the half-arrows underneath correspond to PCR primers used in this study. PTC-containing sequence between the alternate u5′ss and d5′ss is shown at the bottom. (B) CAD cells transfected with siControl, siPtbp1 or siPtbp1/2 were treated with cycloheximide (CHX) or DMSO (control) and the Hps1 splicing pattern was analyzed by RT-PCR with F1/R1 primers. Note that knock-down of Ptbp1 alone or together with Ptbp2 promote utilization of d5′ss and that the corresponding PTC-containing splice product is further stabilized by CHX treatment. (C) Relative utilization of the d5′ss quantified from (B). (D) RT-qPCR analysis of the CAD samples from (B) with F2/R2 primers shows that reduced expression of Ptbp1 diminishes Hps1 mRNA expression levels and that this effect is rescued by CHX. (E–G) 3′-terminal part of the Hps1 gene is sufficient for Ptbp1-dependent control at the protein level. (E) Top, expression construct encoding EGFP-Hps1 fusion protein. Bottom, CAD cells treated with indicated siRNAs were transfected with constructs encoding either EGFP-Hps1 or unmodified EGFP and splicing patterns of the recombinant transcripts were analyzed by RT-qPCR using F3/R3 primers. (F) Immunoblot analysis of EGFP-containing proteins in CAD samples prepared as in (E). Ptbp1- and Ptbp2-specific antibodies were used to validate corresponding knockdown efficiencies, whereas Gapdh-specific antibody was used as a lane loading control. (G) Quantitation of the results in (F). Data in (C, D and G) are averaged from at least three independent experiments ±SD.
Figure 3
Figure 3. Hps1 is co-expressed with Ptbp1 in vivo.
(A) RT-qPCR analysis of Ptbp1 expression in embryonic (E12.5) and adult mouse tissues. Expression level in adult mouse liver is set to 1. (B) RT-qPCR quantitation of Hps1 mRNA expression levels in the same set of mouse tissues as in (A) averaged from three independent experiments ±SD. (C) RT-PCR analysis of the Hps1 exon18-exon19 tissue-specific splicing patterns. Relative abundances of the d5′ss-spliced products [ψ(d5′ss)] averaged from two independent experiments ±SD are indicated at the bottom. (D–E) Scatter plots showing significant positive correlation between Ptbp1 and Hps1 mRNA expressions and negative correlation between Ptbp1 expression and Hps1 ψ(d5′ss) values.
Figure 4
Figure 4. Ptbp1 binds to pyrimidine-rich sequences between u5′ss and d5′ss and directly regulates Hps1 A5C.
(A) Minigene construct encoding Hps1 exon 18-intron 18-exon 19 segment. Putative Ptbp1 binding motifs, Py1 and Py2, and their mutated versions are depicted below. (B) CAD cells treated with indicated siRNAs were transfected with either the wild-type (WT) TRE-mini-1819 construct or its Py1-mut or Py2-mut derivatives and analyzed by RT-PCR using F1/R4 primers. Considerable accumulation of minigene-specific d5′ss-spliced transcripts in this experiment and Fig. S6B is likely a result of their NMD resistance due to the lack of ORF. (C) Quantitation of the relative abundances of the d5′ss-spliced form [ψ(d5′ss)] in (B) averaged from three independent experiments ±SD. (D) Top, Ptbp1-RNA binding assay. Bottom, immunoblot analysis showing readily detectable Ptbp1 interaction with the wild-type mini-1819 RNA, reduced interaction with the Py1-mut mini-1819 RNA and severely diminished interaction with the Py2-mut mini-1819 RNA. NTC is a no-template control. (E) Splicing of the Hps1 or AdV RNA substrates was assayed in vitro using control-treated or Ptbp1-immunodepleted NEs and the reaction products were analyzed using RT-PCR at the 0- and 60-minute time points. (F) Quantitation of the results from (E) showing relative abundance of the d5′ss-spliced form [ψ(d5′ss)] averaged from two independent experiments ±SD. (G) Ptbp1-immunodepleted splicing reactions were supplemented with indicated amounts of purified recombinant Ptbp1 protein and the reaction products were analyzed as in (E). (H) Relative abundance of the d5′ss-spliced form [ψ(d5′ss)] in (G) averaged from two independent experiments ±SD.
Figure 5
Figure 5. Ptbp1 functions by stimulating u5′ss usage rather than repressing d5′ss.
(A) TRE-mini-1719 minigene constructs used in this experiment. Red crosses indicate mutational inactivation of the corresponding splice sites. (B) CAD cells treated with indicated siRNAs were transfected with either WT or mutated (u5′ss-mut or d5′ss-mut) TRE-mini-1719 constructs and analyzed by multiplex RT-PCR combining two primer pairs, F1/R5 and F4/R4, to detect the ratio between spliced and total minigene-specific transcript levels. (C) Relative splicing efficiencies of TRE-mini-1719(u5′ss-mut) the TRE-mini-1719(d5′ss-mut) samples in (B) calculated as a ratio between spliced and total transcript abundance. Data are averaged from three independent experiments ±SD. (D–E) Splicing of mini-1819(d5′ss-mut) RNA was assayed in the presence of control-treated or Ptbp1-immunodepleted NE and the reaction products were analyzed by multiplex RT-PCR. (F) Quantitation of the results from (E), represented as average splicing efficiency from two independent experiments, ±SD. (G) Ptbp1-immunodepleted reactions were rescued with increasing concentration of recombinant Ptbp1 protein and analyzed by RT-PCR. (H) Quantitation of the results from (G), represented as splicing efficiency averaged from two independent experiments, ±SD.
Figure 6
Figure 6. Hps1 regulation depends on u5′ss being weaker than d5′ss.
(A) TRE-mini-1819 minigenes containing either a wild-type (top) or a permuted arrangement of the two 5′ss. (B) CAD cells pre-treated with indicated siRNAs were transfected with the TRE-mini-1819 constructs introduced in (A) and analyzed by RT-PCR using minigene-specific primers F1/R4. Note that the upstream 5′ splice position is constitutively used in all permuted minigene samples. (C) Utilization of the topologically downstream 5′ splice site [ψ(down)] in (B) averaged from three independent experiments ±SD.
Figure 7
Figure 7. Hps1-like A5C regulation may recur in other genes.
(A) Empirical cumulative distribution function (ECDF) plot of Ptbp1 motif density within exon segments demarcated by the two 5′ss alternatives in A5C genes. (B) Density plot of the difference between d5′ss and u5′ss strengths. Median values are shown by vertical colored lines. (C) Model of Ptbp1-dependent AS-NMD regulation of Hps1 expression. Ptbp1 stimulates usage of the intrinsically weak u5′ss thus giving rise to functional Hps1 mRNA. The choice is shifted towards the naturally strong d5′ss in neurons and muscle cells where Ptbp1 is expressed at relatively low levels. This destabilizes Hps1 mRNA through NMD.

Similar articles

Cited by

References

    1. Wang Z, Burge CB (2008) Splicing regulation: from a parts list of regulatory elements to an integrated splicing code. RNA 14: 802–813. - PMC - PubMed
    1. Nilsen TW, Graveley BR (2010) Expansion of the eukaryotic proteome by alternative splicing. Nature 463: 457–463. - PMC - PubMed
    1. Kalsotra A, Cooper TA (2011) Functional consequences of developmentally regulated alternative splicing. Nat Rev Genet 12: 715–729. - PMC - PubMed
    1. Braunschweig U, Gueroussov S, Plocik AM, Graveley BR, Blencowe BJ (2013) Dynamic integration of splicing within gene regulatory pathways. Cell 152: 1252–1269. - PMC - PubMed
    1. Black DL (2003) Mechanisms of alternative pre-messenger RNA splicing. Annu Rev Biochem 72: 291–336. - PubMed

Publication types