. 2014 Nov 6;10(11):e1004775.
doi: 10.1371/journal.pgen.1004775. eCollection 2014 Nov.

Genomic evidence of rapid and stable adaptive oscillations over seasonal time scales in Drosophila

Affiliations

Genomic evidence of rapid and stable adaptive oscillations over seasonal time scales in Drosophila

Alan O Bergland et al. PLoS Genet. .

Abstract

In many species, genomic data have revealed pervasive adaptive evolution indicated by the fixation of beneficial alleles. However, when selection pressures are highly variable along a species' range or through time adaptive alleles may persist at intermediate frequencies for long periods. So called "balanced polymorphisms" have long been understood to be an important component of standing genetic variation, yet direct evidence of the strength of balancing selection and the stability and prevalence of balanced polymorphisms has remained elusive. We hypothesized that environmental fluctuations among seasons in a North American orchard would impose temporally variable selection on Drosophila melanogaster that would drive repeatable adaptive oscillations at balanced polymorphisms. We identified hundreds of polymorphisms whose frequency oscillates among seasons and argue that these loci are subject to strong, temporally variable selection. We show that these polymorphisms respond to acute and persistent changes in climate and are associated in predictable ways with seasonally variable phenotypes. In addition, our results suggest that adaptively oscillating polymorphisms are likely millions of years old, with some possibly predating the divergence between D. melanogaster and D. simulans. Taken together, our results are consistent with a model of balancing selection wherein rapid temporal fluctuations in climate over generational time promotes adaptive genetic diversity at loci underlying polygenic variation in fitness related phenotypes.


Conflict of interest statement

The authors have declared that no competing interests exist.

Figures

Figure 1
Figure 1. Experimental design and genomic turnover through time and space.
(A) Map of sampling locations in North America used in this study. Grey boxes represent individual samples from each locale. Genome-wide differentiation among spatially (B) and temporally (C) separated samples, measured as genome-wide average FST (y-axis). Lines represent the predicted value of FST based on the linear (A; y = a+bx) and non-linear (B; y = abX) regression. Note: Pennsylvanian samples are not represented in (B) and the negative FST in (B) results from the conservative correction of heterozygosity , . In addition, please note that there are four estimates of pairwise FST between the two replicate Maine and Florida samples (corresponding to a difference in latitude of 20°) and that there are two estimates of FST between each of the remaining clinal populations and each Maine and Florida replicate sample. Error bars represent 95% confidence intervals based on 500 blocked bootstrap samples of ∼2000 SNPs.
Figure 2
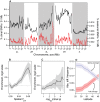
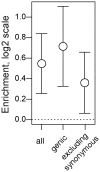
Figure 2. Genomic features of seasonal SNPs.
(A) Allele frequency change at each of the ∼1750 seasonal SNPs. Allele frequencies are polarized so that spring allele frequencies are higher than fall allele frequencies. (B) Power to detect seasonal SNPs (black line) is limited and we estimate that we have only identified ∼10% (red line) of all SNPs that repeatedly change in frequency through time (black line). The units of the x-axis (S) are the cumulative selection coefficient. See the Materials and Methods for the definition of S. (C) Enrichment (log2 odds ratio) of seasonal SNPs that are annotated for each class of genetic element relative to control polymorphisms. (D) Seasonal FST surrounding seasonal SNPs decays to background levels by ∼500 bp. (E) Allele frequency estimates at seasonal SNPs outside any large, cosmopolitan inversion (non-inv) or within the cosmopolitian inversions (diamonds) during the spring (blue) or fall (red). Allele frequency estimates at SNPs perfectly linked to the inversion during the spring and fall are denoted by circles. Error bars (C) and confidence bands (D) represent 95% confidence intervals based on blocked bootstrap resampling.
Figure 3
Figure 3. Spatial and temporal variation in allele frequencies.
(A) Genomic distribution of clinal (black line) and seasonal SNPs (red line) per megabase per common polymorphism used in this study (Table S1). (B). Enrichment (log2 odds ratio) of seasonal SNPs with spatial FST greater than or equal to value on x-axis relative to control SNPs. (C) Enrichment (log2 odds ratio) of seasonal SNPs with –log10(spatial q-value) greater than or equal to value on x-axis relative to control SNPs. (D) Absolute difference between average spring (blue) and fall (red) frequencies in the Pennsylvanian population and frequency estimates along the cline. Confidence bands represent 95% confidence intervals based on blocked bootstrap resampling.
Figure 4
Figure 4. Adaptive evolution to frost.
(A) Temperature records at a weather station close to the focal orchard. Grey lines indicate collection dates for pre- and post-frost samples. (B) Probability that post-frost allele frequencies at seasonal and control SNPs overshoot the long-term average (based on 2009 and 2010 estimates) allele frequency at each site. Confidence intervals based on blocked bootstrap resampling.
Figure 5
Figure 5. Association with seasonally variable phenotypes.
Enrichment (log2 odds ratio) of seasonal SNPs that change in frequency in the expected direction at SNPs associated with chill coma recovery time (A) and starvation tolerance (B) relative to contronl SNPs. The x-axis represents the threshold -log10(GWAS p-value), i.e. values along the x-axis represent the minimum -log10(GWAS p-value) for SNPs under consideration. Error bars represent 95% confidence intervals based on blocked bootstrap resampling.
Figure 6
Figure 6. Long term balancing selection.
Enrichment (log2 odds ratio) of seasonal SNPs among SNPs that polymorphic and identical by state among 6 lineages of D. simulans relative to control SNPs. Error bars represent 95% confidence intervals based on blocked bootstrap resampling.
Figure 7
Figure 7. Demographic models.
(A) Expected value of FST between simulated spring and fall samples (y-axis), conditional on overwintering effective population size and the number of seasonally adaptive alleles (color key). Dotted line represents observed average, genome-wide after FST between spring and fall samples from the Pennsylvanian population. (B) Expected number of SNPs that would vary repeatedly between seasons three times in a row conditional on founding deme size for a simple model of recolonization of the orchard population. Dotted line represents the observed number of seasonal SNPs and the corresponding founding deme size required, in this case 5 flies. (C) Minimum population size (y-axis) for the required for varying number of seasonally selected loci (x-axis) under a truncation selection model assuming independent response to selection at each locus. Dotted line represents our best guess of fall population size and corresponding number of loci that could independently respond to truncation selection. Confidence bands based on resampling of observed allele frequency change at seasonal SNPs.

References

    1. Gillespie JH (1973) Polymorphism in Random Environments. Theoretical Population Biology 4: 193–195.
    1. Ellner S, Sasaki A (1996) Patterns of genetic polymorphism maintained by fluctuating selection with overlapping generations. Theor Popul Biol 50: 31–65. - PubMed
    1. Korol AB, Kirzhner VM, Ronin YI, Nevo E (1996) Cyclical environmental changes as a factor maintaining genetic polymorphism. 2. Diploid selection for an additive trait. Evolution 50: 1432–1441. - PubMed
    1. Ewing EP (1979) Genetic-Variation in a Heterogeneous Environment. 7. Temporal and Spatial Heterogeneity in Infinite Populations. American Naturalist 114: 197–212.
    1. Gillespie JH, Langley CH (1974) General Model to Account for Enzyme Variation in Natural-Populations. Genetics 76: 837–884. - PMC - PubMed

Publication types