

doi: 10.1103/PhysRevE.90.042304.
Epub 2014 Oct 8.
Phase separation and emergent structures in an active nematic fluid
Affiliations
- PMID: 25375491
- PMCID: PMC4459651
- DOI: 10.1103/PhysRevE.90.042304
Item in Clipboard
Phase separation and emergent structures in an active nematic fluid
Phys Rev E Stat Nonlin Soft Matter Phys.
2014 Oct.
Abstract
We consider a phenomenological continuum theory for an active nematic fluid and show that there exists a universal, model-independent instability which renders the homogeneous nematic state unstable to order fluctuations. Using numerical and analytic tools we show that, in the vicinity of a critical point, this instability leads to a phase-separated state in which the ordered regions form bands in which the direction of nematic order is perpendicular to the direction of the density gradient. We argue that the underlying mechanism that leads to this phase separation is a universal feature of active fluids of different symmetries.
Figures
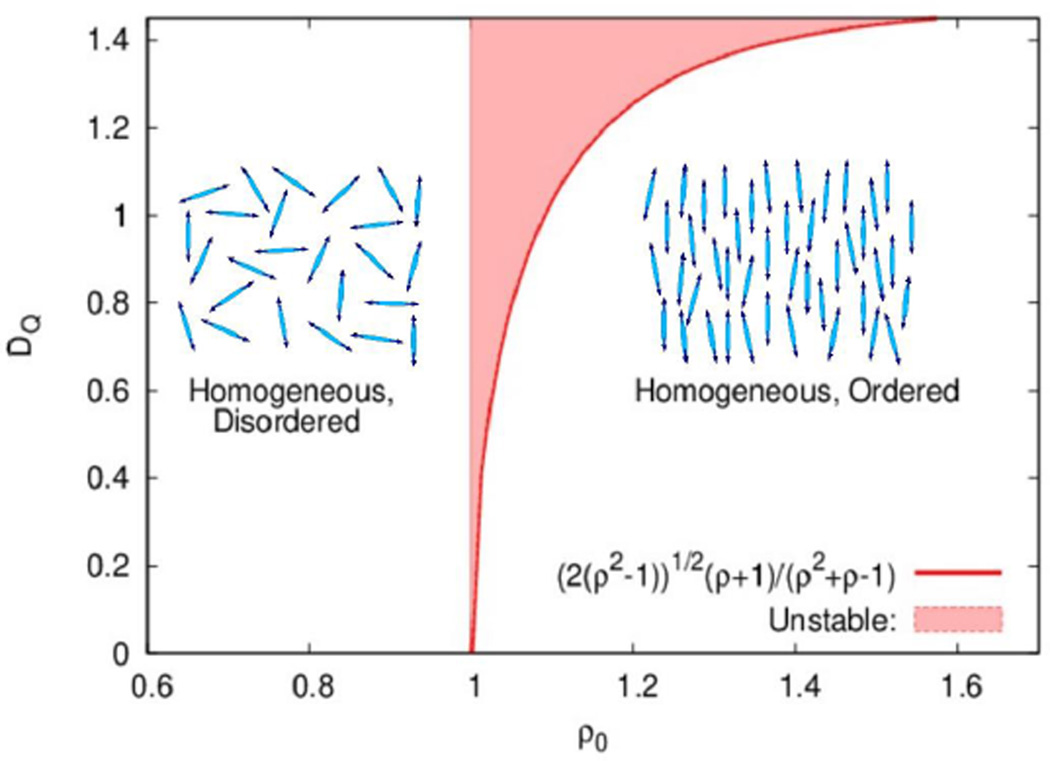
(color online) Phase behavior of the system as a function of the mean
density of the system (ρ0) and the activity
(DQ). Below the critical density for the
order disorder transition (i.e., ρ < 1) the homogeneous
disordered state is stable. For any density ρ ≥ 1, there is an
activity DQ above which the homogeneous ordered
state is unstable. This region, in which there is no stable homogeneous state,
is shown in red.
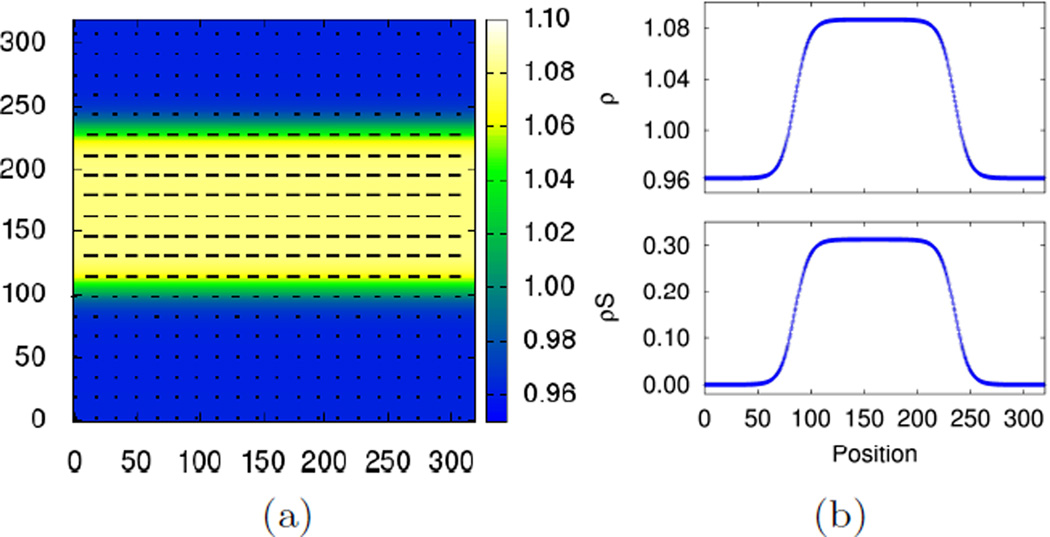
(color online) (a) A plot of the density and order of a typical system
(ρ0 = 1.01, DQ = 0.8) that
has phase-separated into bands. The lines show the magnitude (by the length) and
direction of nematic ordering. The light region is a band of high density with
nematic ordering along the band. The axes show the position in the system in
dimensionless ‘diffusion lengths’ and the scale bar shows the
density. (b) Profiles of the density (top) and order
(ρS, on bottom), taken perpendicular to the
direction of ordering in the bands.
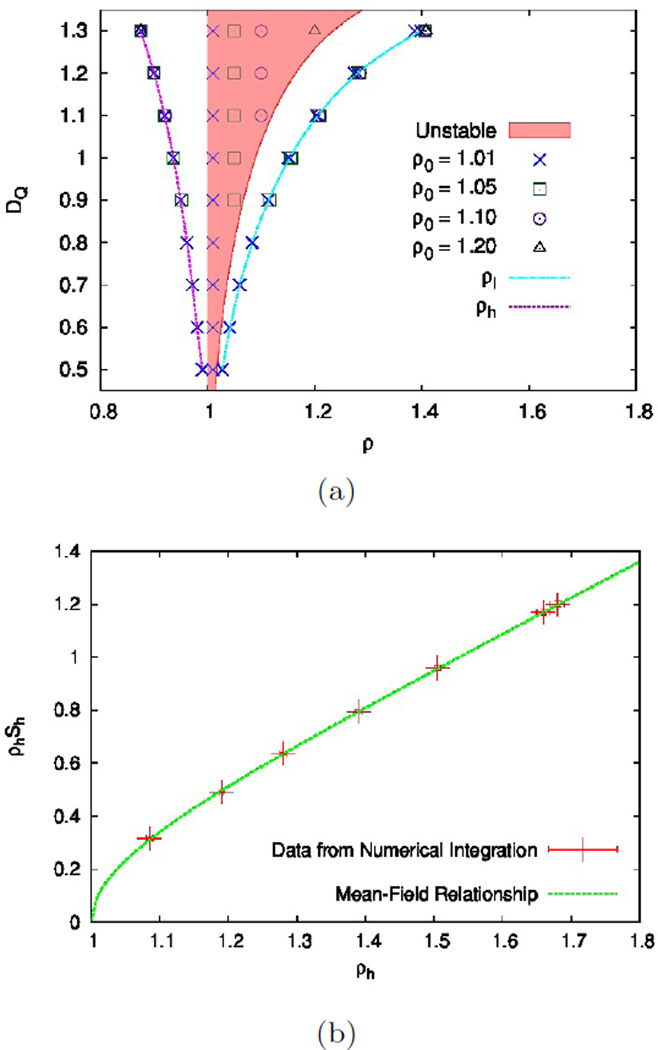
(color online) (a) For fixed activity, several initial densities in the
unstable region are chosen. The final densities in the banded state
(ρh and
ρl) are found to be independent of
the initial density, as the points for different initial densities fall on the
same curve. (b) The measured value of order (ρS) as a
function of ρh. The solid line is the mean
field prediction . Excellent agreement is found substantiating the picture that
the bands are just phase coexistence between a high density nematic and a low
density isotropic state.
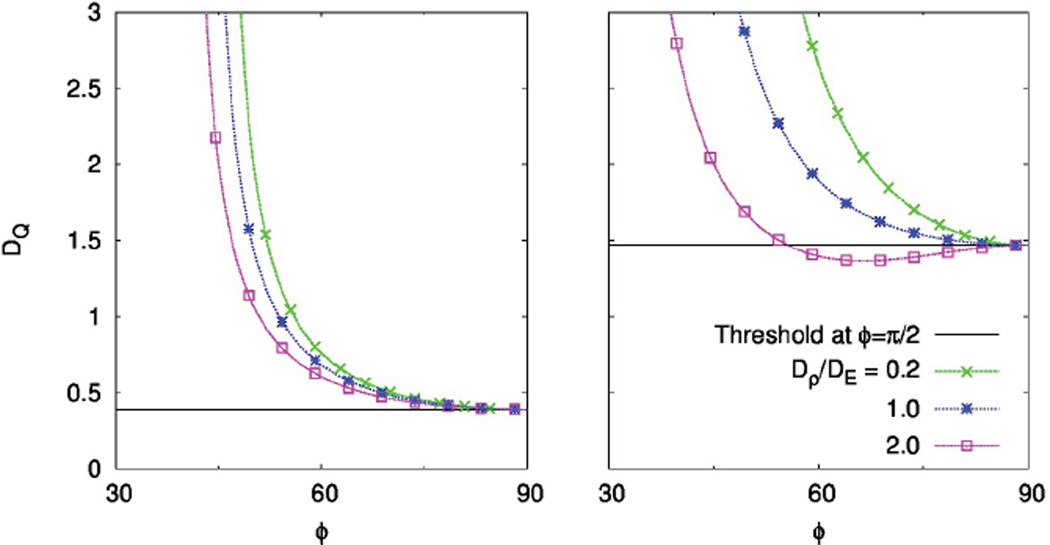
(color online) Plot of DQ(ϕ), the
value of activity at which spatial fluctuations in the direction ϕ
become unstable. Left panel : ρ = 1.01, close to the critical point,
when DQ is monotonic and is smallest in the
ϕ = 90° direction. Right panel : ρ = 2.0,
DQ becomes non monotonic when the Frank
elastic constant becomes small compared to the kinetic terms. The horizontal
line at DQ(90°) is a guide to the eye.
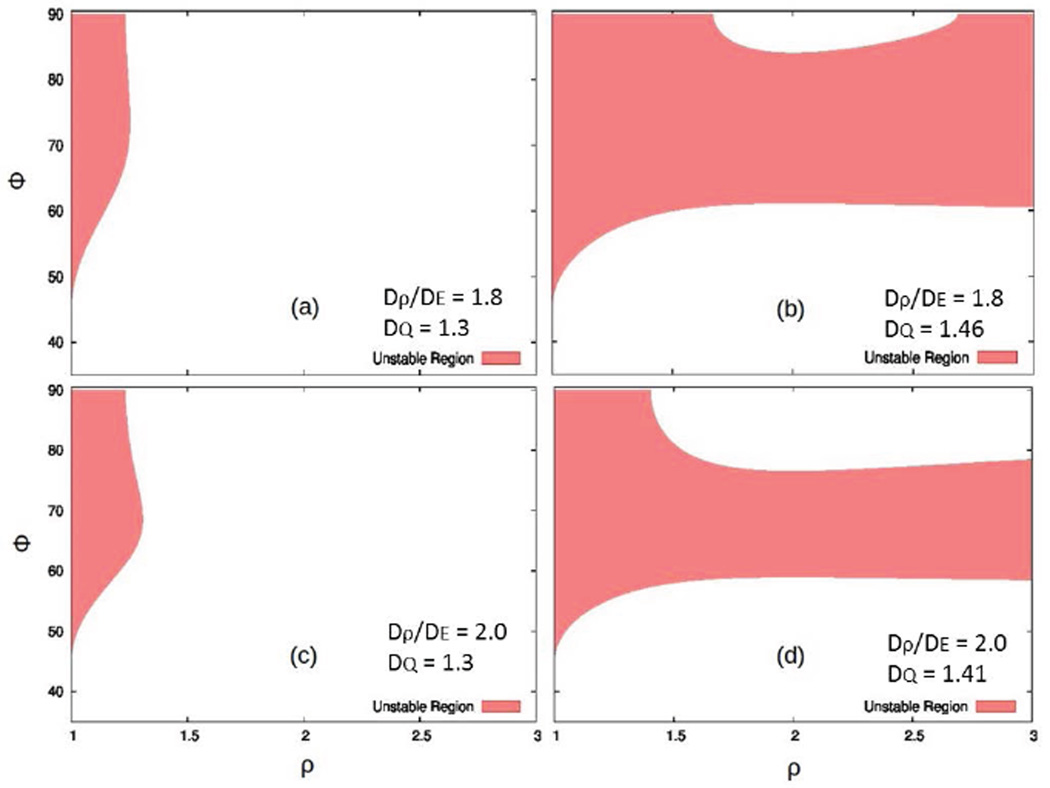
(color online) Identifying the directions in space associated with
destabilizing fluctuations for different choices of parameters of the continuum
theory. When
Dρ/DE
becomes large, the instability persists to large values of density and is spread
over a wider range of ϕ
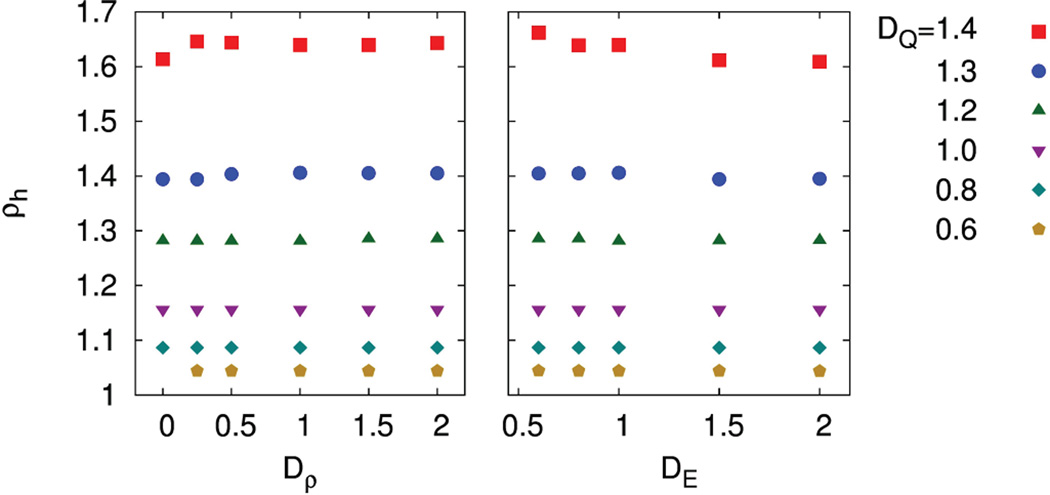
(color online) The density of the ordered phase
(ρh) is shown for a range of
Dρ, DE, and
DQ respectively.
ρh is insensitive to
Dρ and DE,
especially for small DQ.
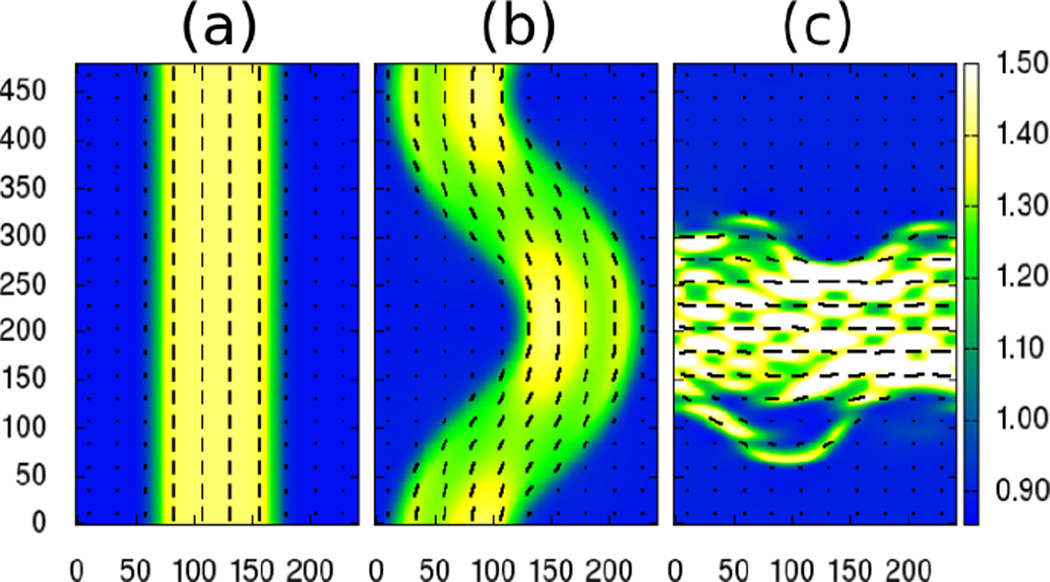
(color online) The plots above show the progression of the structures
which form as
Dρ/DE is
increased. The density is represented as a heat map, and the magnitude and
direction of order is represented by the length and orientation of the lines (as
in Fig. 2) after 90,000 diffusion times.
These systems all have parameters ρ0 = 1.10,
DQ = 1.30 and DE
= 1.20. (a) For Dρ =
0.80DE, the band of the ordered phase is
stable. (b) For Dρ =
1.20DE the band is unstable to a large
wave-length instability which causes it to bend and eventually break. (c) For
Dρ =
2.50DE the band breaks down quickly and a
structure with fluctuations on a much smaller length scale forms. This structure
is dynamical, and the order at the edges fluctuates, but it persists for over a
hundred thousand of diffusion times.
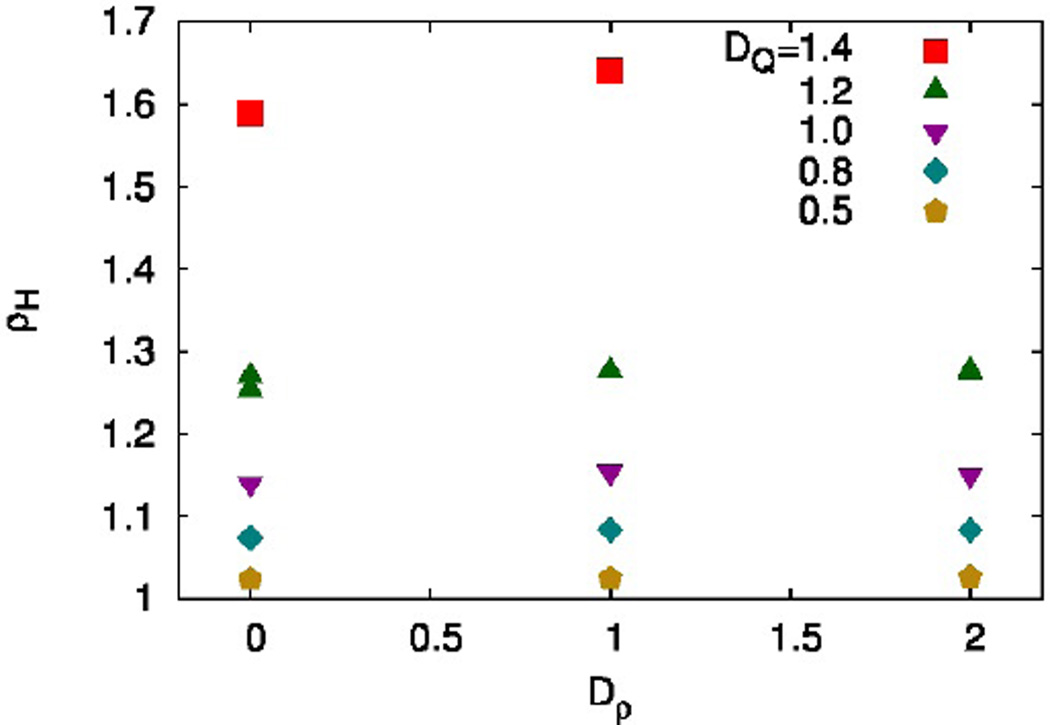
(color online) The density of the ordered phase
(ρH) is shown for a few different
values of the coefficient of the kinetic term
(Dρ) in the case where that kinetic term
is proportional to S. When compared to the plot on the left in
Fig. 6 it can be seen that the change
to the kinetic term has not significantly altered the density of the ordered
phase.
Similar articles
-
Self-regulation in self-propelled nematic fluids.Eur Phys J E Soft Matter. 2012 Sep;35(9):95. doi: 10.1140/epje/i2012-12095-8. Epub 2012 Sep 28. Eur Phys J E Soft Matter. 2012. PMID: 23053844
-
Experimental and theoretical approach for the clustering of globally coupled density oscillators based on phase response.Phys Rev E. 2016 Jan;93(1):012212. doi: 10.1103/PhysRevE.93.012212. Epub 2016 Jan 20. Phys Rev E. 2016. PMID: 26871078
-
Phase transitions in wave turbulence.Phys Rev E Stat Nonlin Soft Matter Phys. 2012 Jan;85(1 Pt 1):010101. doi: 10.1103/PhysRevE.85.010101. Epub 2012 Jan 3. Phys Rev E Stat Nonlin Soft Matter Phys. 2012. PMID: 22400497
-
Spontaneous division and motility in active nematic droplets.Phys Rev Lett. 2014 Apr 11;112(14):147802. doi: 10.1103/PhysRevLett.112.147802. Epub 2014 Apr 10. Phys Rev Lett. 2014. PMID: 24766017
-
Active turbulence and spontaneous phase separation in inhomogeneous extensile active gels.Soft Matter. 2023 Jan 4;19(2):189-198. doi: 10.1039/d2sm01188c. Soft Matter. 2023. PMID: 36503973
Cited by
-
On the mechanism of long-range orientational order of fibroblasts.Proc Natl Acad Sci U S A. 2017 Aug 22;114(34):8974-8979. doi: 10.1073/pnas.1707210114. Epub 2017 Aug 7. Proc Natl Acad Sci U S A. 2017. PMID: 28784754 Free PMC article.
-
Aspects of the density field in an active nematic.Philos Trans A Math Phys Eng Sci. 2014 Nov 28;372(2029):20130364. doi: 10.1098/rsta.2013.0364. Philos Trans A Math Phys Eng Sci. 2014. PMID: 25332390 Free PMC article.
-
Spontaneous flow in polar active fluids: the effect of a phenomenological self propulsion-like term.Eur Phys J E Soft Matter. 2016 Jan;39(1):1. doi: 10.1140/epje/i2016-16001-2. Epub 2016 Jan 14. Eur Phys J E Soft Matter. 2016. PMID: 26769011
-
Self-organized dynamics and the transition to turbulence of confined active nematics.Proc Natl Acad Sci U S A. 2019 Mar 12;116(11):4788-4797. doi: 10.1073/pnas.1816733116. Epub 2019 Feb 25. Proc Natl Acad Sci U S A. 2019. PMID: 30804207 Free PMC article.
-
Instabilities, defects, and defect ordering in an overdamped active nematic.Soft Matter. 2016 May 7;12(17):3854-9. doi: 10.1039/c6sm00268d. Epub 2016 Mar 17. Soft Matter. 2016. PMID: 26983376 Free PMC article.
References
Publication types
MeSH terms
Grants and funding
LinkOut - more resources
Full Text Sources
Other Literature Sources