. 2014 Nov 6;10(11):e1004735.
doi: 10.1371/journal.pgen.1004735. eCollection 2014 Nov.

Genome-wide associations between genetic and epigenetic variation influence mRNA expression and insulin secretion in human pancreatic islets

Affiliations

Genome-wide associations between genetic and epigenetic variation influence mRNA expression and insulin secretion in human pancreatic islets

Anders H Olsson et al. PLoS Genet. .

Erratum in

  • PLoS Genet. 2014 Dec;10(12):e1004886

Abstract

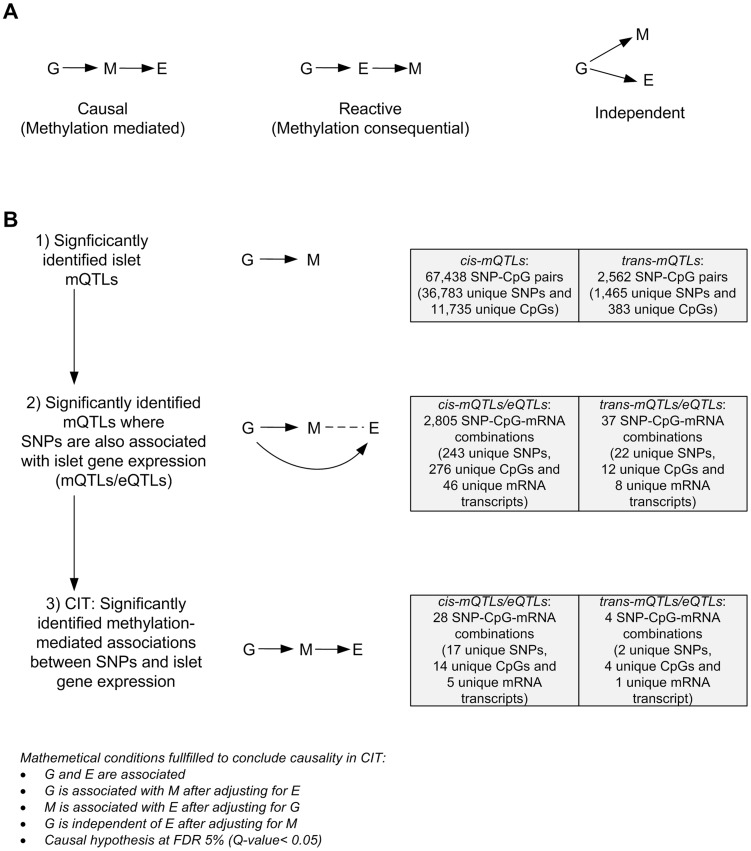
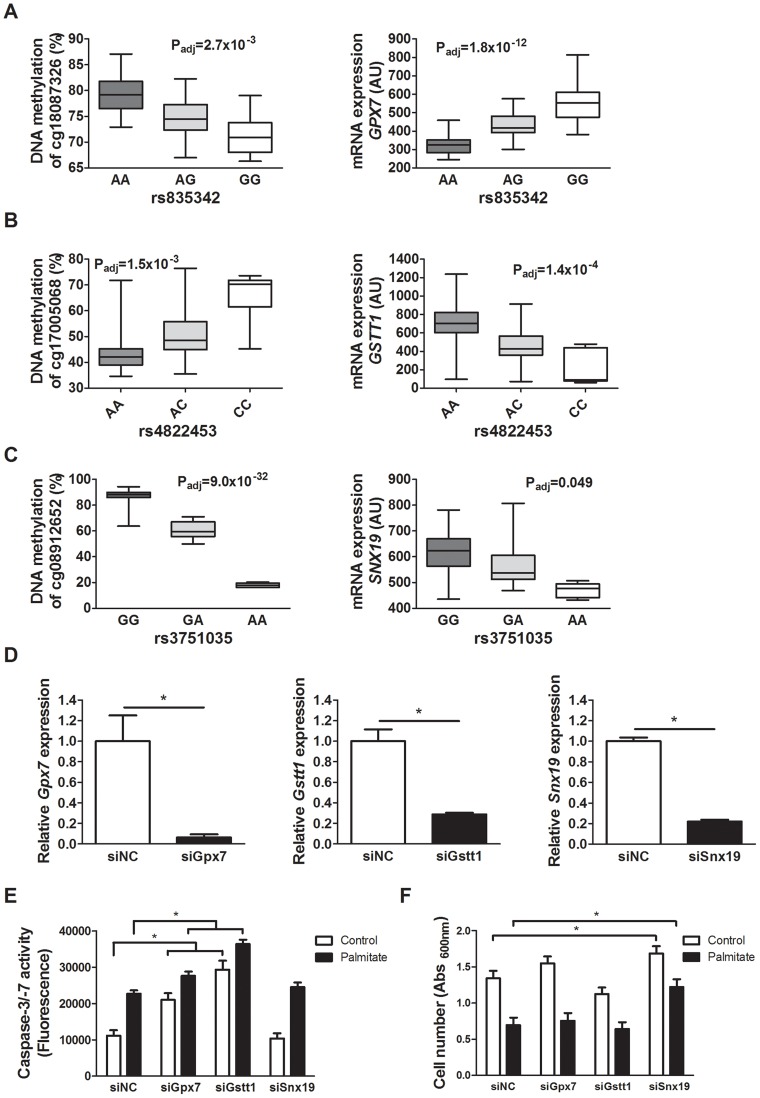
Genetic and epigenetic mechanisms may interact and together affect biological processes and disease development. However, most previous studies have investigated genetic and epigenetic mechanisms independently, and studies examining their interactions throughout the human genome are lacking. To identify genetic loci that interact with the epigenome, we performed the first genome-wide DNA methylation quantitative trait locus (mQTL) analysis in human pancreatic islets. We related 574,553 single nucleotide polymorphisms (SNPs) with genome-wide DNA methylation data of 468,787 CpG sites targeting 99% of RefSeq genes in islets from 89 donors. We identified 67,438 SNP-CpG pairs in cis, corresponding to 36,783 SNPs (6.4% of tested SNPs) and 11,735 CpG sites (2.5% of tested CpGs), and 2,562 significant SNP-CpG pairs in trans, corresponding to 1,465 SNPs (0.3% of tested SNPs) and 383 CpG sites (0.08% of tested CpGs), showing significant associations after correction for multiple testing. These include reported diabetes loci, e.g. ADCY5, KCNJ11, HLA-DQA1, INS, PDX1 and GRB10. CpGs of significant cis-mQTLs were overrepresented in the gene body and outside of CpG islands. Follow-up analyses further identified mQTLs associated with gene expression and insulin secretion in human islets. Causal inference test (CIT) identified SNP-CpG pairs where DNA methylation in human islets is the potential mediator of the genetic association with gene expression or insulin secretion. Functional analyses further demonstrated that identified candidate genes (GPX7, GSTT1 and SNX19) directly affect key biological processes such as proliferation and apoptosis in pancreatic β-cells. Finally, we found direct correlations between DNA methylation of 22,773 (4.9%) CpGs with mRNA expression of 4,876 genes, where 90% of the correlations were negative when CpGs were located in the region surrounding transcription start site. Our study demonstrates for the first time how genome-wide genetic and epigenetic variation interacts to influence gene expression, islet function and potential diabetes risk in humans.


Conflict of interest statement

The authors have declared that no competing interests exist.

Figures

Figure 1
Figure 1. Flow-chart showing the analysis pipeline.
Direction of the arrows represents the workflow of the study design with performed analysis indicated. Solid lines indicate analysis performed within data of human pancreatic islets. Dashed lines indicate analysis performed against external databases. Light grey boxes indicate input data of human pancreatic islets. Dark grey boxes indicate output of significant data. White boxes indicate follow-up studies for look-up or functional- and biological validation of significant results.
Figure 2
Figure 2. Depiction and distance analysis of associations between genotype and DNA methylation of significant mQTLs in human pancreatic islets.
Depiction of (A) the most significant cis-mQTL; rs1771445 vs. cg02372404, and (B) the least significant cis-mQTL; rs196489 vs. cg06433283, among all identified cis-mQTLs in human pancreatic islets. Data is presented as Box and Whisker plots with P-values adjusted for multiple testing. (C) Distance analysis between SNPs and CpG sites of significant cis-mQTLs plotted as the number of identified mQTLs within each distance bin. Distance summary: minimum = 0 kb, 10%ile = 1.88 kb, 25%ile = 7.62 kb, 50%ile = 26.31 kb, 75%ile = 74.76 kb, 90%ile = 164.5 kb, maximum = 499.6 kb. (D) The strength of associations plotted against the distance between SNPs and CpG sites of significant cis-mQTLs after correction for multiple testing. Depiction of (E) the most significant trans-mQTL; rs17660464 vs. cg22968622, and (F) the least significant trans-mQTL; rs6440971 vs. cg10438649, among all identified trans-mQTLs in human pancreatic islets. Data is presented as Box and Whisker plots with P-values adjusted for multiple testing. (G) Quantile-Quantile plots (Q-Q plots) of –log10 (P-values) illustrating the distribution of P-values for all analyzed SNP-CpG pairs in the cis- (red dots) and trans- (blue dots) mQTL analysis in relation to a theoretical null distribution (grey diagonal line). Bold dots indicate significant mQTLs identified in the cis- (red dots) and trans-(blue dots) mQTL analysis after correction for multiple testing.
Figure 3
Figure 3. Genomic distribution of CpG sites of significantly identified mQTLs in human pancreatic islets.
(A) Chromosomal distribution of CpG sites of significant cis- and trans-mQTLs in comparison to all analyzed CpG sites on the Infinium Human Methylation450 BeadChip. (B) All analyzed CpG sites on the Infinium Human Methylation450 BeadChip have been annotated to genomic regions based on their relation to the nearest gene (TSS: proximal promoter, defined as 200 bp or 1500 bp upstream of transcription start site; UTR: untranslated region) or in relation to the nearest CpG island (CpG island: DNA stretch of 200 bp or more with a C+G content of >50% and an observed CpG/expected CpG in excess of 0.6; Shore: the flanking region of CpG islands, 0–2000 bp; Shelf: regions flanking island shores, i.e., covering 2000–4000 bp distant from the CpG island). Distribution of CpG sites of significant mQTLs in relation to (C) the nearest gene and (D) in relation to CpG islands. *Significantly different distribution (P<0.05) of CpGs of significant cis- or trans-mQTLs from what is expected by chance based on a Chi-squared-test when compared with all analyzed CpG sites on the Infinium HumanMethylation450 BeadChip.
Figure 4
Figure 4. CIT analysis identifies mQTLs where DNA methylation potentially mediates genetic associations with mRNA expression in human pancreatic islets.
(A) Depiction of possible relationship models between genotype as a causal factor (G), DNA methylation as a potential mediator (M) and islet mRNA expression as a phenotypic outcome (E). Left diagram: The causal or methylation mediated model. Middle diagram: The reactive or methylation-consequential model (reverse causality). Right diagram: The independent model. (B) Illustration of the study approach to identify if DNA methylation of CpG sites potentially mediates the causal association between SNPs and islet mRNA expression. Left: Workflow steps. Middle: Tested relationships between G, M and E in the different steps. Right: Number of identified sites in each step. Bottom: Conditions that must be fulfilled to conclude a mathematical definition of a causal relationship between G, M and E. Significantly called as causal at 5% FDR (causal hypothesis Q<0.05).
Figure 5
Figure 5. Identified mQTL/eQTL candidate genes GPX7, GSTT1 and SNX19 affect β-cell number and apoptosis.
Associations identified in the mQTL/eQTL analyses of human pancreatic islets. (A) rs835342 located approximately 5 kb upstream of GPX7 associates with DNA methylation of cg18087326 located 406 bp upstream of the GPX7 transcription start site (TSS) as well as with mRNA expression of GPX7. (B) rs4822453 located ∼121 kb downstream of GSTT1 associates with DNA methylation of cg17005068 located 241 bp upstream of the GSTT1 TSS as well as with mRNA expression of GSTT1. (C) rs3751035 located within exon 1 of SNX19 associates with DNA methylation of cg08912652 located within the gene body of SNX19 as well as with mRNA expression of SNX19. Data are presented as Box and Whisker plots with P-values adjusted for multiple testing. (D) qPCR quantification of siRNA mediated knockdown of Gpx7 (siGpx7), Gstt1 (siGstt1) and Snx19 (siSnx19) compared to negative control siRNA (siNC). * P<0.01, the graphs show the average of four independent knockdown experiments presented as mean ± SEM. (E) Knockdown of Gpx7 and Gstt1 resulted in increased combined caspase-3/7 activity compared to negative control siRNA under both control (white bars) and lipotoxic (black bars) conditions. * P<0.05, the graph shows the average of three independent knockdown experiments presented as mean ± SEM. (F) Knockdown of Snx19 (siSnx19) resulted in increased cell number compared to negative control siRNA (siNC) under both control (white bars) and lipotoxic (black bars) conditions. * P<0.05, the graph shows the average of six independent knockdown experiments presented as mean ± SEM.
Figure 6
Figure 6. Diabetes SNPs reported by GWAS associate with DNA methylation in human pancreatic islets.
Depiction of some identified associations between SNP and DNA methylation in islets of reported type 1 diabetes loci: (A) INS, (B) HLA and (C) PTPN2; type 2 diabetes loci: (D) KCNJ11, (E) WFS1 and (F) ADCY5; and glucose-trait loci: (G) PDX1 and (H) GRB10. P-values adjusted for multiple testing. HLA rs1063355 and WFS1 rs1801216 were identified through proxy search and are in linkage with the GWAS reported diabetes SNPs HLA rs9272346 and WFS1 rs1801214, respectively.
Figure 7
Figure 7. Distribution of CpG sites significantly associated with one or more mRNA transcripts, separated based on negative or positive correlations.
(A) 20,376 combinations in the region 0–500 kb upstream of transcription start site and (B) 5,718 intragenic combinations. Negative correlations were enriched in the region surrounding the transcription start site, both (C) upstream and (D) downstream. (E) 5,221 combinations 0–100 kb downstream of the gene. Associations corrected for multiple testing using false discovery rate at 5% (Q<0.05).
Figure 8
Figure 8. mQTLs/eQTLs of GPX7 and SNX19 identified in the genome-wide analysis were biologically validated in pancreatic islets from a different set of human donors.
Biological validation of associations for (A) GPX7 rs835342 with DNA methylation of cg18087326 as well as with mRNA expression of GPX7 and (B) SNX19 rs3751035 with DNA methylation of cg08912652 as well as with mRNA expression of SNX19 in a set of human pancreatic islets from donors (n = 37) not included in the genome-wide mQTL/eQTL analysis. DNA methylation was analyzed using Pyrosequencing and mRNA expression using Affymetrix microarray. Data are presented as Box and Whisker plots with P-values.

Similar articles

Cited by

References

    1. Bird A (2002) DNA methylation patterns and epigenetic memory. Genes Dev 16: 6–21. - PubMed
    1. Lister R, Pelizzola M, Dowen RH, Hawkins RD, Hon G, et al. (2009) Human DNA methylomes at base resolution show widespread epigenomic differences. Nature 462: 315–322. - PMC - PubMed
    1. Robertson KD, Wolffe AP (2000) DNA methylation in health and disease. Nat Rev Genet 1: 11–19. - PubMed
    1. Chong S, Whitelaw E (2004) Epigenetic germline inheritance. Curr Opin Genet Dev 14: 692–696. - PubMed
    1. Anway MD, Cupp AS, Uzumcu M, Skinner MK (2005) Epigenetic transgenerational actions of endocrine disruptors and male fertility. Science 308: 1466–1469. - PMC - PubMed

Publication types

MeSH terms