. 2014 Nov 6;9(11):e111453.
doi: 10.1371/journal.pone.0111453. eCollection 2014.

Cell proliferation and neurogenesis in adult mouse brain

Affiliations

Cell proliferation and neurogenesis in adult mouse brain

Olivia L Bordiuk et al. PLoS One. .

Abstract

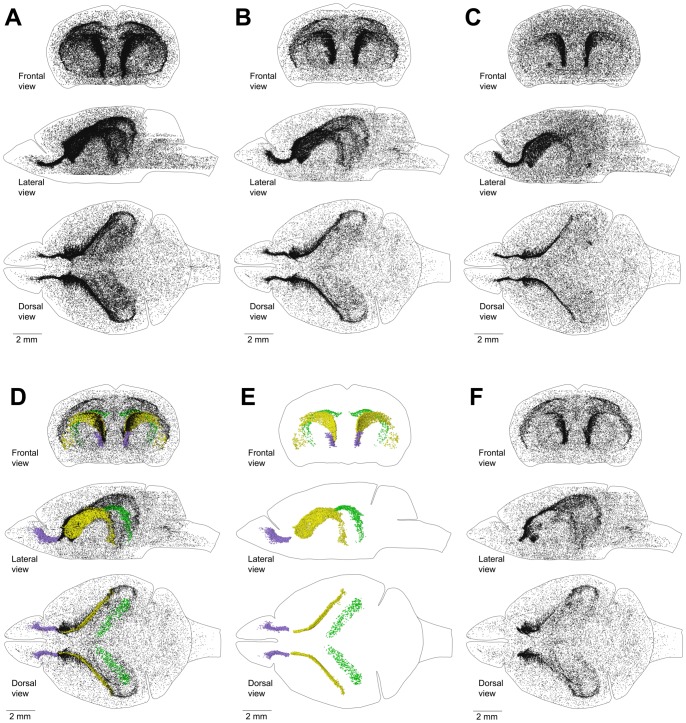
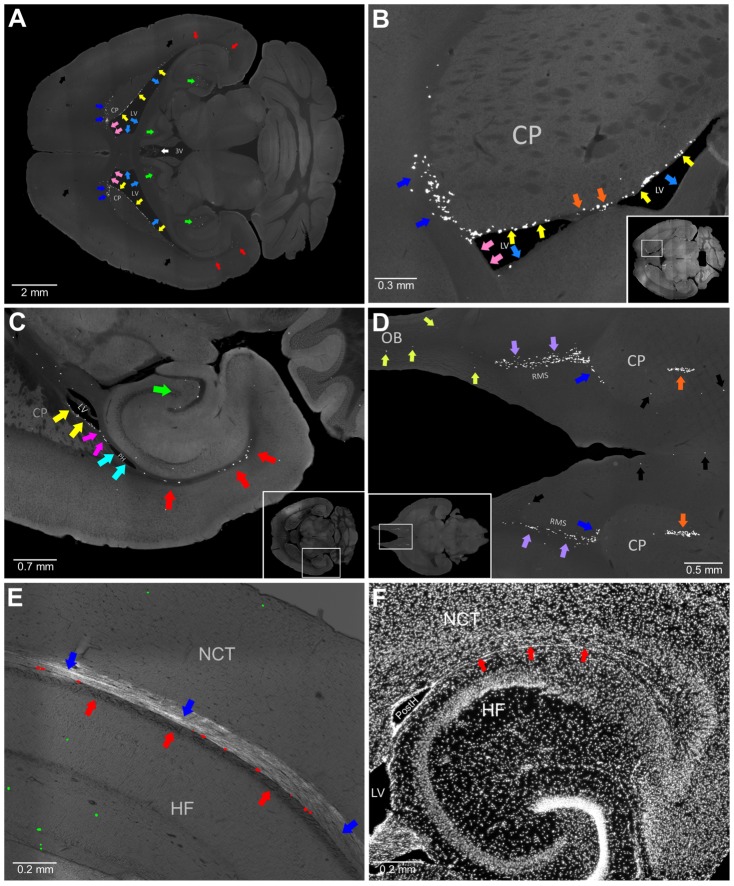
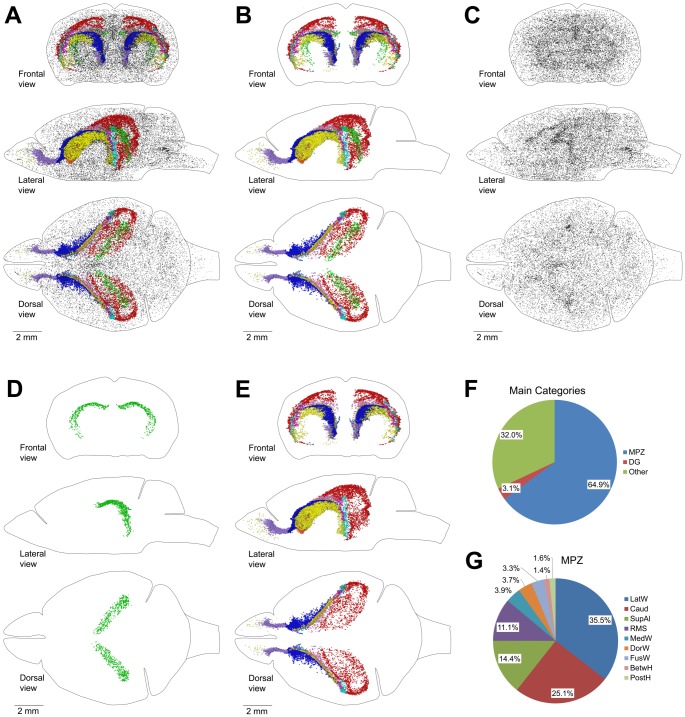
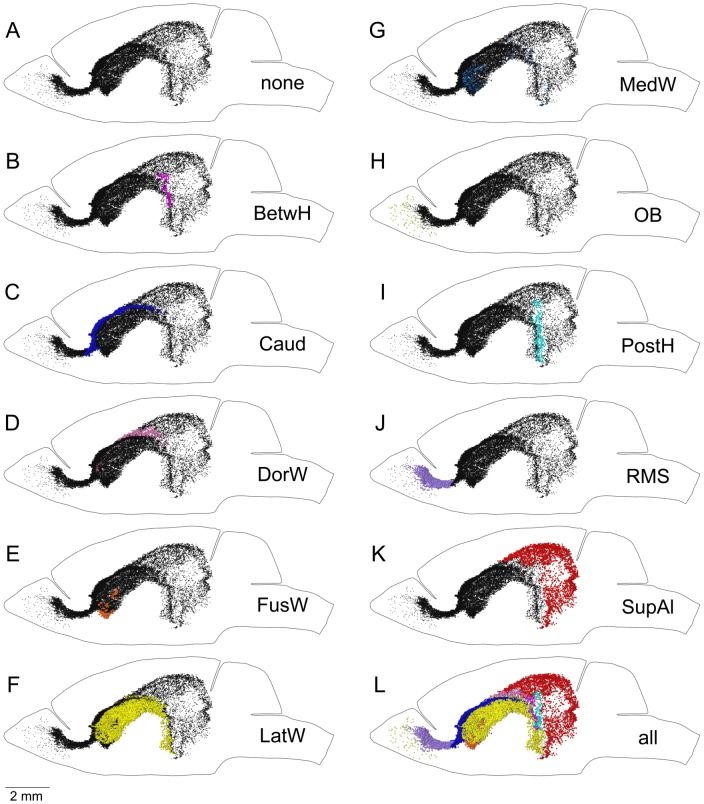
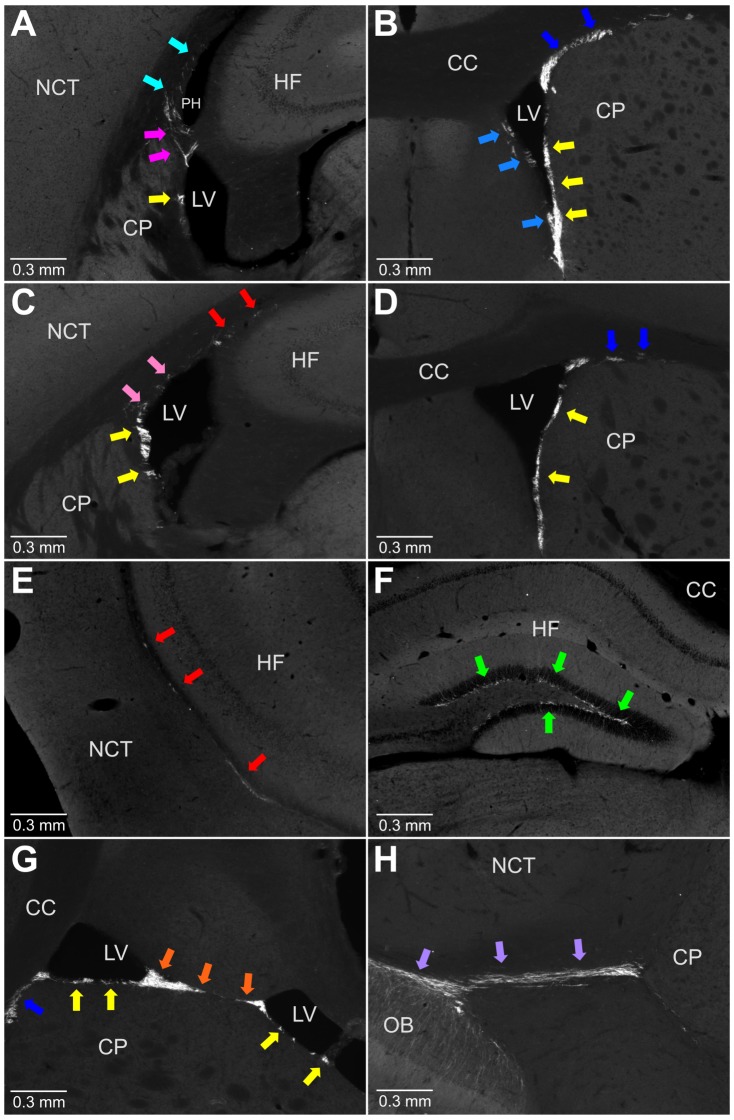
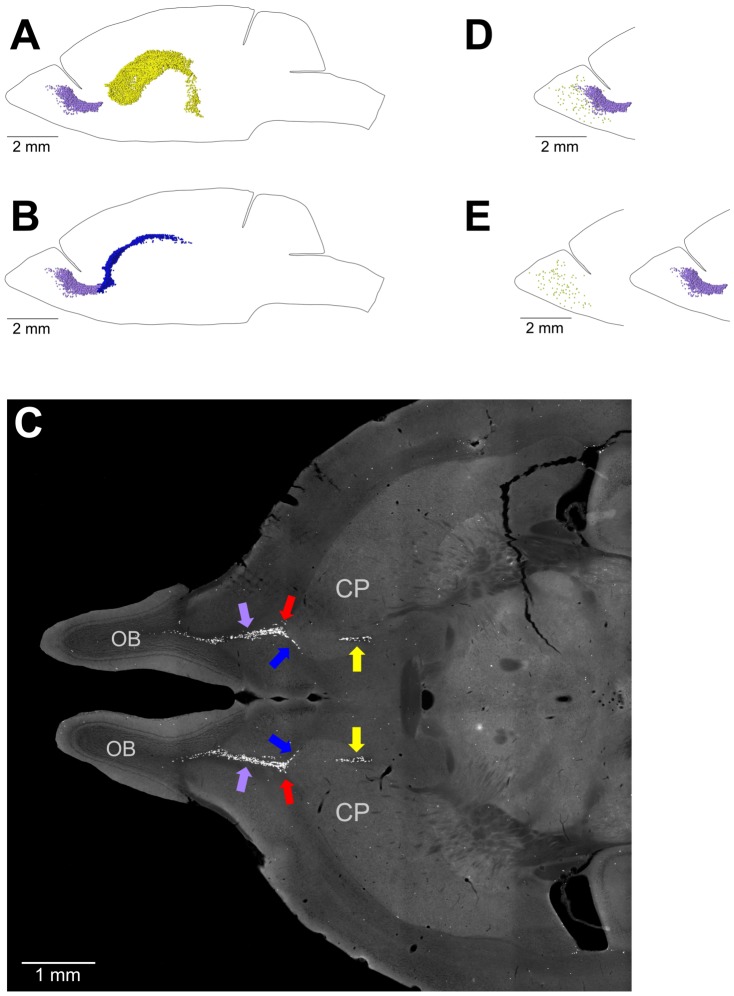
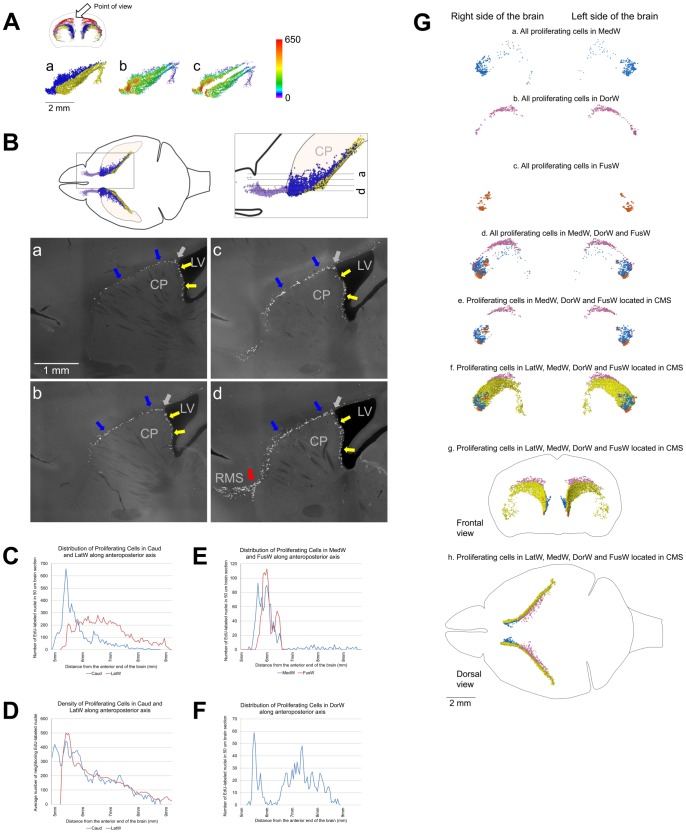
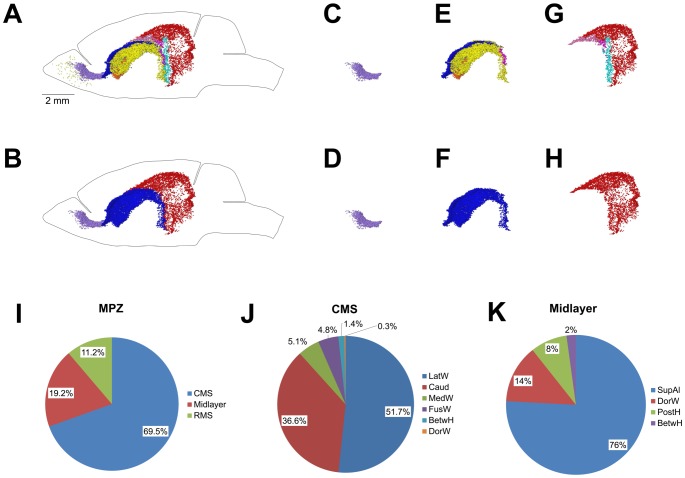
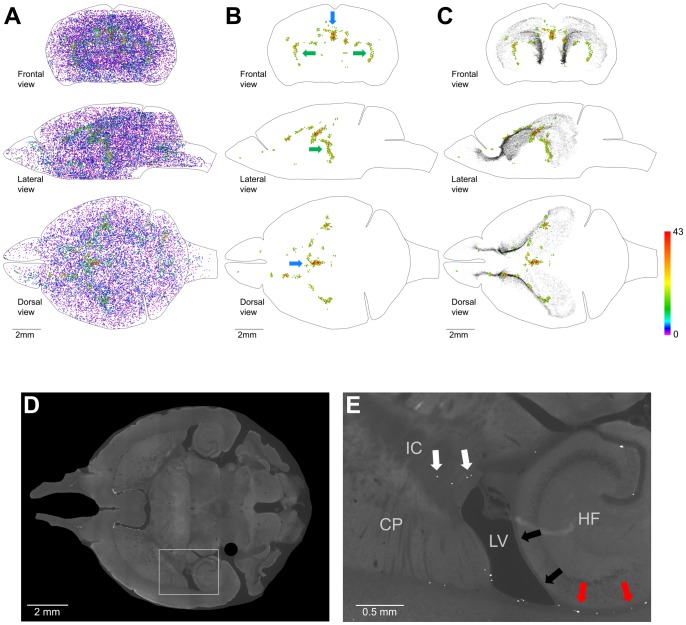
Neurogenesis, the formation of new neurons, can be observed in the adult brain of many mammalian species, including humans. Despite significant progress in our understanding of adult neurogenesis, we are still missing data about the extent and location of production of neural precursors in the adult mammalian brain. We used 5-ethynyl-2'-deoxyuridine (EdU) to map the location of proliferating cells throughout the entire adult mouse brain and found that neurogenesis occurs at two locations in the mouse brain. The larger one we define as the main proliferative zone (MPZ), and the smaller one corresponds to the subgranular zone of the hippocampus. The MPZ can be divided into three parts. The caudate migratory stream (CMS) occupies the middle part of the MPZ. The cable of proliferating cells emanating from the most anterior part of the CMS toward the olfactory bulbs forms the rostral migratory stream. The thin layer of proliferating cells extending posteriorly from the CMS forms the midlayer. We have not found any additional aggregations of proliferating cells in the adult mouse brain that could suggest the existence of other major neurogenic zones in the adult mouse brain.


Conflict of interest statement

Competing Interests: The authors have declared that no competing interests exist.

Figures

Figure 1
Figure 1. EdU staining.
A. EdU staining has a low and homogeneous background. a. EdU staining of a transverse brain section in a 120 day-old mouse one hour post EdU injection. b. 3D surface plot of the area is outlined with a white box on panel (a). c. EdU positive nuclei identified with Find Maxima Process (Fiji image processing package). Each identified nucleus is shown as a magenta dot surrounded by a white crosshair. B. 60% of dividing cells become labeled with EdU two hours after EdU injection. A section of the brain of a 120 day-old mouse stained for phospho-Histone H3 to identify mitotic cells (pH3), EdU (EdU) and phospho-Histone H3 and EdU (pH3+EdU) double stained. a. One hour after EdU injection. b–d. Two hours after EdU injection. Panel b shows a cell at the prophase stage of cell cycle; panel c shows two cells at the metaphase stage; and d a cell at the anaphase stage. e, f. Pie charts showing the number of nuclei stained positive for phospho-Histone H3 alone (blue) and phospho-Histone H3 and EdU (red) ((e) one hour and (f) two hours after EdU injection). C. Structure of the lateral ventricles of the brain of a 120 day-old mouse. The structure was reconstructed using serial transverse sections of the mouse brain, (a) Frontal and (b) lateral view. D. EdU-labeled nuclei are stained through the entire thickness of brain sections. Maximum intensity projections of a 50 µm transverse section of the brain stained for EdU. A point of the rostral migratory stream departure for the anterior end of the caudoputamen is shown. a, Projection along X axis; b, along Z axis; and c, along Y axis. Section thickness along Z axis are shown with brackets. 120 days-old mouse one hour post EdU injection.
Figure 2
Figure 2. Distribution of proliferating cells in a mouse brain.
A–C. Distribution of proliferating cells in the brain of a 60 day-old mouse (A), 120 day-old mouse (B), and 240 day-old mouse (C). Each EdU-labeled nucleus is shown as a black dot. D–F. Distribution of proliferating cells in the lateral walls of the lateral ventricles (LatW), the dentate gyrus of the hippocampus (DG) and the rostral migratory stream (RMS) of a 120 day-old mouse. Each EdU-labelled nucleus is shown as a yellow dot in the LatW, a green dot in the DG, and a lilac dot in the RMS. EdU-labelled nuclei outside of these three structures are shown as black dots of smaller size. D. All proliferating cells in the brain. E. Proliferating cells in the LatW, DG and RMS. F. Proliferating cells located outside the LatW, DG and RMS. The brain shape is outlined with a black line. Frontal, lateral, and dorsal views of the brain are shown. Mice are labeled with EdU for one hour.
Figure 3
Figure 3. Brain structures appear to be enriched with an abundance of proliferating cells.
A. The apparent abundance of proliferating cells is in the supra alveus (SupAl) (red arrows), the dentate gyrus (DG) (green arrows), the lateral walls of the lateral ventricles (LatW) (yellow arrows), the dorsal walls of the lateral ventricles (DorW) (pink arrows), the medial walls of the lateral ventricles (MedW) (light blue arrows), the dorsal and anterior walls of the caudate (Caud) (blue arrows), the choroid plexus in the third ventricle (white arrow), and other parts of the brain (black arrows). B. The apparent abundance of proliferating cells is in the LatW (yellow arrows), the DorW (pink arrows), the MedW (light blue arrows), the Caud (blue arrows), and at the fusion of the lateral and medial walls of the lateral ventricles (FusW) (orange arrows). C. The apparent abundance of proliferating cells is in the SupAl (red arrows), the DG (green arrow), between the posterior Horn and the lateral ventricles (BetH) (magenta arrows), and the lateral wall of the Posterior Horn (PostH) (cyan arrows). D. The apparent abundance of proliferating cells is in the olfactory bulbs (OB) (olive arrows), the rostral migratory stream (RMS) (lilac arrows), the Caud (blue arrows), and the FusW (orange arrows). E. Proliferating cells in the SupAl. EdU-labeled nuclei in the dorsal area of the SupAl are shown as red dots. Other EdU-labeled nuclei are shown as green dots. The image of EdU-labeled nuclei is superimposed on the DIC image of the brain section. The white matter bundles forming the alveus are shown with red arrows and the white matter bundles connecting the thalamus with the cortex with blue arrows. F. A transverse section of the mouse brain stained with Hoechst. The midlayer, identified with red arrows, is a thin sheet of densely packed cells. 3rd ventricle (3V), Caudoputamen (CP), Hippocampal Formation (HF), Lateral Ventricles (LV), Neocortex (NCT), Olfactory Bulbs (OB), Posterior Horn (PostH). Rostral Migratory Stream (RMS). 120 days-old mouse one hour post EdU injection.
Figure 4
Figure 4. Main Proliferative Zone (MPZ).
A–E. Distribution of proliferating cells in the brain of a 120 day-old mouse labeled with EdU after one hour. Each EdU-labeled nucleus is shown as a colored dot with colors assigned according to the Table 2. The brain shape is outlined with a black line. Frontal, lateral, and dorsal views of the brain are shown. A. Distribution of EdU-labeled nuclei in the brain. B. Distribution of EdU-labeled nuclei in the aggregation. C. Distribution of EdU-labeled nuclei outside of the aggregation. D. Distribution of EdU-labeled nuclei in the dentate gyrus (DG). E. Distribution of EdU-labeled nuclei in the MPZ. F. Pie chart showing the percentage of EdU labeled nuclei located in the MPZ, DG and other parts of the adult mouse brain (Other). G. Pie chart showing the percentage of EdU labeled nuclei located in different parts of the MPZ. Abbreviated names are given according to Table 2.
Figure 5
Figure 5. The Main Proliferative Zone (MPZ) appears as an uninterrupted continuum in which EdU-labeled nuclei from each structure occupy well-defined locations.
A. Each EdU-labeled nucleus in the MPZ is shown as a black dot. B. Each EdU-labeled nucleus in the BetwH is shown as a magenta dot. EdU-labeled nuclei in other parts of the MPZ are shown as black dots. C. Each EdU-labeled nucleus in the Caud is shown as a blue dot. EdU-labeled nuclei in other parts of the MPZ are shown as black dots. D. Each EdU-labeled nucleus in the DorW is shown as a pink dot. EdU-labeled nuclei in other parts of the MPZ are shown as black dots. E. Each EdU-labeled nucleus in the FusW is shown as an orange dot. EdU-labeled nuclei in other parts of the MPZ are shown as black dots. F. Each EdU-labeled nucleus in the LatW is shown as a yellow dot. EdU-labeled nuclei in other parts of the MPZ are shown as black dots. G. Each EdU-labeled nucleus in the MedW is shown as a light blue dot. EdU-labeled nuclei in other parts of the MPZ are shown as black dots. H. Each EdU-labeled nucleus in the OB is shown as an olive dot. EdU-labeled nuclei in other parts of the MPZ are shown as black dots. I. Each EdU-labeled nucleus in the PostH is shown as a cyan dot. EdU-labeled nuclei in other parts of the MPZ are shown as black dots. J. Each EdU-labeled nucleus in the RMS is shown as a lilac dot. EdU-labeled nuclei in other parts of the MPZ are shown as black dots. K. Each EdU-labeled nucleus in the SupAl is shown as a red dot. EdU-labeled nuclei in other parts of the MPZ are shown as black dots. L. Each EdU-labeled nucleus in the MPZ is shown as a color dot with colors assigned according to the Table 2. Abbreviated names are given according to Table 2. The brain shape is outlined with a black line. Lateral view. 120 days-old mouse one hour post EdU injection.
Figure 6
Figure 6. Doublecortin expressing cells are present in all parts of the main proliferative zone.
A-F, coronal sections and G, H, transverse sections. A. Presence of doublecortin expressing cells in the LatW (yellow arrow), BetH (magenta arrows), and PostH (cyan arrows). B. Presence of doublecortin expressing cells in the LatW (yellow arrows), MedW (light blue arrows), and Caud (blue arrows). C. Presence of doublecortin expressing cells in the LatW (yellow arrows), DorW (pink arrows), and SupAl (red arrows). D. Presence of doublecortin expressing cells in the LatW (yellow arrows) and Caud (blue arrows). E. Presence of doublecortin expressing cells in the SupAl (red arrows). F. Presence of doublecortin expressing cells in the DG (green arrow). G. Presence of doublecortin expressing cells in the LatW (yellow arrows), FusW (orange arrows), and Caud (blue arrow). H. Presence of doublecortin expressing cells in the RMS (lilac arrows). Corpus Callosum (CC), Caudoputamen (CP), Hippocampal Formation (HF), Lateral Ventricles (LV), Neocortex (NCT), Olfactory Bulbs (OB), Posterior Horn of the lateral ventricles (PH). Abbreviated names are given according to Table 2. 120 day-old mouse.
Figure 7
Figure 7. The density of proliferating cells in the Main Proliferative Zone (MPZ).
A–D. Volume number density of proliferating cells in the MPZ (A), the rostral migratory stream (RMS)(B), the caudate migratory stream (CMS) (C), the midlayer (D). Each EdU-labeled nucleus is shown as a colored dot with colors assigned according to the number of neighboring EdU-labeled nuclei located closer than 200 µm to this nucleus. Scale is shown on the right. E–F. Average number of neighboring EdU-labeled nuclei located closer than 200 µm to each EdU-labeled nucleus from main categories of proliferating cells in the adult mouse brain (E) or different parts of the caudate migratory stream (F). Abbreviated names are given according to Table 2. G, I, K. Density of proliferating cells in the RMS (G), CMS (I) and midlayer (K) along the anteroposterior axis of the brain. The average number of neighboring EdU-labeled nuclei located closer than 200 µm to each EdU-labeled nucleus in a 50 µm brain section is shown along the vertical axis of the charts. The distance from the anterior end of the brain is shown along the horizontal axis of the charts. H, J, L. Distribution of proliferating cells in the RMS (G), CMS (I) and midlayer (K) along the anteroposterior axis of the brain. The number of EdU-labeled nuclei in a 50 µm brain section is shown along the vertical axis of the charts. The distance from the anterior end of the brain is shown along the horizontal axis of the charts. K, L. The blue line shows the density (K) and distribution (L) of all proliferating cells located in the midlayer. The red line shows the density (K) and distribution (L) of proliferating cells located in the midlayer, with the exception of 250 cells located close to the CMS (these cells are shown with black arrow on panel D). 120 days-old mouse one hour post EdU injection.
Figure 8
Figure 8. Transition between the Caudate Migratory Stream (CMS) and Rostral Migratory Stream (RMS) and the RMS and olfactory bulbs (OB).
A–C. Transition between the CMS and RMS. The RMS in the adult mouse brain departs from the most anterior end of the caudoputamen (CP). A. The distribution of EdU-labeled nuclei in the lateral walls of the lateral ventricles (shown as yellow dots) has no overlap with the distribution of EdU-labeled nuclei in the RMS (shown as lilac dots). B. The distribution of EdU-labeled nuclei in the dorsal and lateral caudate walls (shown as blue dots) overlaps with the distribution of EdU-labeled nuclei in the RMS (shown as lilac dots). C. Transverse section of the mouse brain stained for EdU. EdU-labeled nuclei in the caudate walls are shown with blue arrows, in the RMS with lilac arrows, in the lateral walls of the lateral ventricles with yellow arrows and the point of transition between the caudate walls and the RMS with red arrows. D, E. Transition between the RMS and OB. The stream of proliferating cells in the RMS does not extend into the olfactory bulbs. EdU-labeled nuclei in the RMS are shown as lilac dots and in the OB as olive dots. EdU-labeled nuclei in the RMS and OB are shown as they are located in the mouse brain (D) or virtually separated by 4 mm to show that the stream of proliferating cells in the RMS does not extend into the OB (E). 120 days-old mouse one hour post EdU injection.
Figure 9
Figure 9. Caudate Migratory Stream (CMS).
A–D. Proliferating cells in the medial wall of the caudate facing the lateral ventricles and in the dorsal and lateral walls have similar distribution. A. Distribution of proliferating cells in the lateral walls of the lateral ventricles (LatW) formed by the medial wall of the caudate and in the dorsal and lateral walls of the caudate. a. EdU-labeled nuclei in the LatW are shown as yellow dots and in the dorsal and lateral walls of the caudate as blue dots. b, c. Each EdU-labeled nucleus is shown as a colored dot with colors assigned according to the number of neighboring EdU-labeled nuclei located closer than 200 µm to this nucleus. Scale is shown on the right. EdU-labeled nuclei in the LatW and in the dorsal and lateral walls of the caudate are shown as they are located in the mouse brain (b) or virtually separated by 1 mm (c). B. Distribution of proliferating cells in the lateral walls of the lateral ventricles formed by the medial wall of the caudate and in the dorsal and lateral walls of the caudate. Proliferating cells in the medial caudate wall facing the lateral ventricles are shown with yellow arrows and in the dorsal and lateral walls with blue arrows. The point of transition between caudate walls facing the lateral ventricle and other walls is shown with the gray arrows. Sagittal sections. Section positions are shown on diagrams on the top. The red arrow on panel d shows the point of the RMS departure from the CMS. Lateral Ventricles (LV), Caudoputamen (CP), Rostral Migratory Stream (RMS). C. Distribution of proliferating cells in the LatW and in the dorsal and lateral walls of the caudate (Caud) along the anteroposterior axis of the brain. The number of EdU-labeled nuclei in a 50 µm brain section is shown along the vertical axis of the charts. The distance from the anterior end of the brain is shown along the horizontal axis of the charts. D. Density of proliferating cells in the LatW and Caud along the anteroposterior axis of the brain. The average number of neighboring EdU-labeled nuclei located closer than 200 µm to each EdU-labeled nucleus in a 50 µm brain section is shown along the vertical axis of the charts. The distance from the anterior end of the brain is shown along the horizontal axis of the charts. E–G. Distribution of proliferating cells in walls of the lateral ventricles. E, F. Distribution of proliferating cells in the medial wall of the lateral ventricles (MedW) and at the place of the lateral and medial wall fusion in the anterior part of the lateral ventricles (FusW) (E) and in the dorsal wall of the lateral ventricles (DorW) (F). The number of EdU-labeled nuclei in a 50 µm brain section is shown along the vertical axis of the charts. The distance from the anterior end of the brain is shown along the horizontal axis of the charts. G. Distribution of proliferating cells in walls of the lateral ventricles. (a–f. Lateral view; g. Frontal view and h. Dorsal view). The cell location is indicated on the figure. Each EdU-labeled nucleus is shown as a colored dot with colors assigned according to Table 2. Abbreviated names are given according to Table 2. 120 days-old mouse one hour post EdU injection.
Figure 10
Figure 10. Distribution of proliferating cells in the Main Proliferative Zone (MPZ).
A–H. Distribution of proliferating cells in the MPZ (A, B), RMS (C, D), CMS (E, F), and midlayer (G, H). Lateral view. Each EdU-labeled nucleus is shown as a colored dot with colors assigned according to Table 2 (A, C, E, G). Each EdU-labeled nucleus located in the RMS is shown as a lilac dot, in the CMS as a blue dot, and in the midlayer as a red dot (B, D, F, H). I–K. Pie chart showing the percentage of EdU-labeled nuclei located in different parts of the MPZ (I), CMS (J), and midlayer (K). Abbreviated names are given according to Table 2. 120 days-old mouse one hour post EdU injection.
Figure 11
Figure 11. Distribution of proliferating cells outside of the Main Proliferative Zone (MPZ) and the dentate gyrus of the hippocampus (DG).
A–C. Volume number density of proliferating cells. Each EdU-labeled nucleus is shown as a colored dot with colors assigned according to the number of neighboring EdU-labeled nuclei located closer than 200 µm to this nucleus. Scale is shown on the right. A. All EdU-labeled nuclei located outside of the MPZ and DG. B, C. 600 EdU-labeled nuclei that have 16 or more neighboring EdU-labeled nuclei located closer than 200 µm. EdU-labeled nuclei in the MPZ and DG are shown as black dots of smaller size (C). The brain shape is outlined with a black line. Frontal, lateral, and dorsal views of the brain are shown. D, E. Proliferating cells in the inner capsule are shown with white arrows (E). The presence of proliferating cells in places where the alveus is in contact with a layer of white matter formed by bundles connecting the thalamus with the cortex is shown with red arrows and the absence in places where no such contact with black arrows (E). The position of the images shown on panel E is indicated on panel D with the white rectangle. Caudoputamen (CP), Hippocampal Formation (HF), Lateral Ventricles (LV), Inner Capsule (IC). 120 days-old mouse one hour post EdU injection.

References

    1. Clelland CD, Choi M, Romberg C, Clemenson GD, Fragniere A, et al. (2009) A Functional Role for Adult Hippocampal Neurogenesis in Spatial Pattern Separation. Science 325: 210–213 10.1126/science.1173215 - DOI - PMC - PubMed
    1. Van Praag H, Schinder AF, Christie BR, Toni N, Palmer TD, et al. (2002) Functional neurogenesis in the adult hippocampus. Nature 415: 1030–1034 10.1038/4151030a - DOI - PMC - PubMed
    1. Sahay A, Scobie KN, Hill AS, O′Carroll CM, Kheirbek MA, et al. (2011) Increasing adult hippocampal neurogenesis is sufficient to improve pattern separation. Nature 472: 466–470 10.1038/nature09817 - DOI - PMC - PubMed
    1. Braun SMG, Jessberger S (2014) Adult neurogenesis: mechanisms and functional significance. Dev Camb Engl 141: 1983–1986 10.1242/dev.104596 - DOI - PubMed
    1. Ihrie RA, Alvarez-Buylla A (2011) Lake-front property: a unique germinal niche by the lateral ventricles of the adult brain. Neuron 70: 674–686 10.1016/j.neuron.2011.05.004 - DOI - PMC - PubMed

Publication types