. 2014 Nov 6;8(11):e3241.
doi: 10.1371/journal.pntd.0003241. eCollection 2014.

Epidemiological trends of dengue disease in Thailand (2000-2011): a systematic literature review

Affiliations

Epidemiological trends of dengue disease in Thailand (2000-2011): a systematic literature review

Kriengsak Limkittikul et al. PLoS Negl Trop Dis. .

Abstract

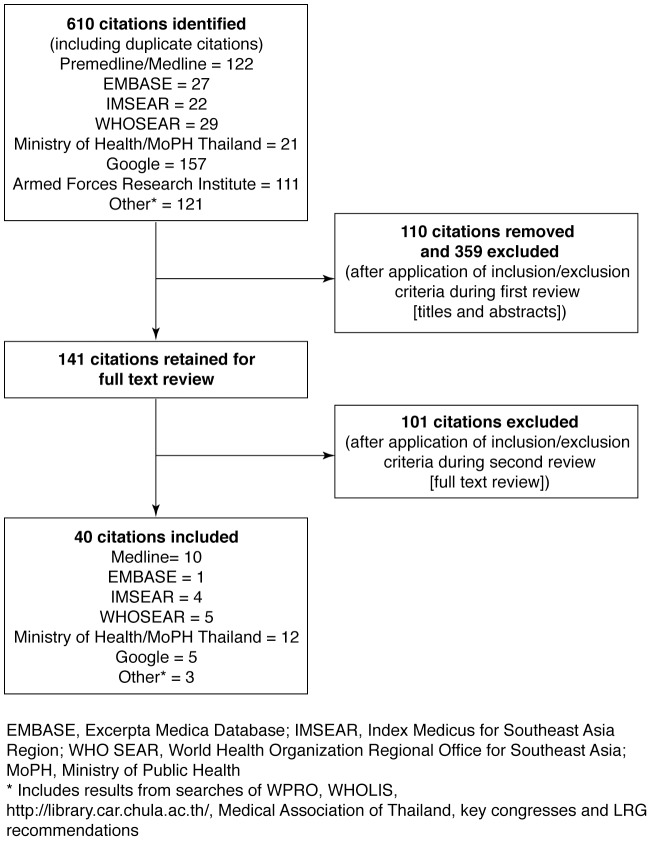
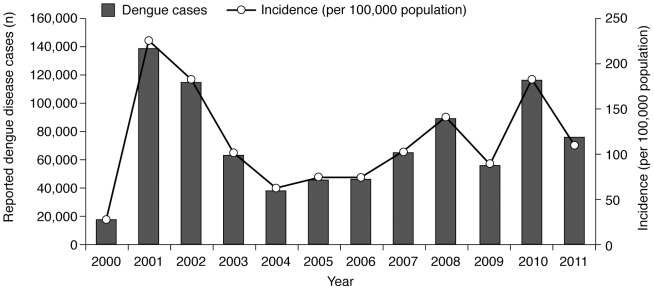
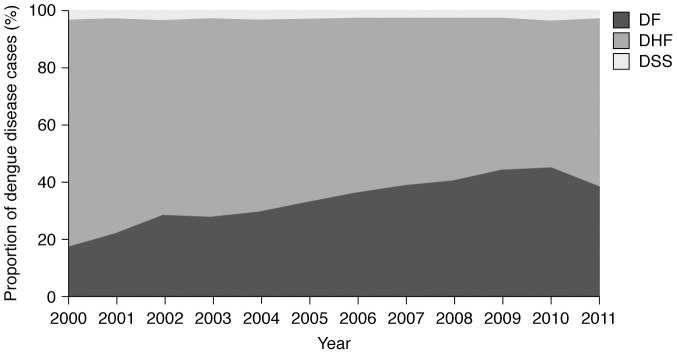
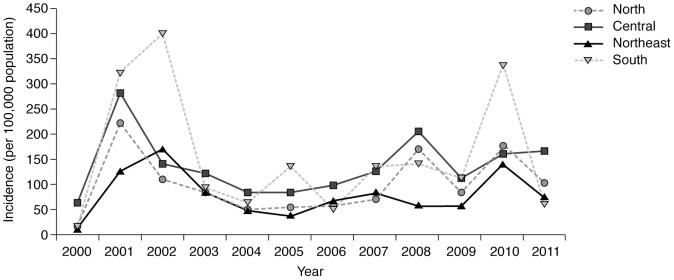
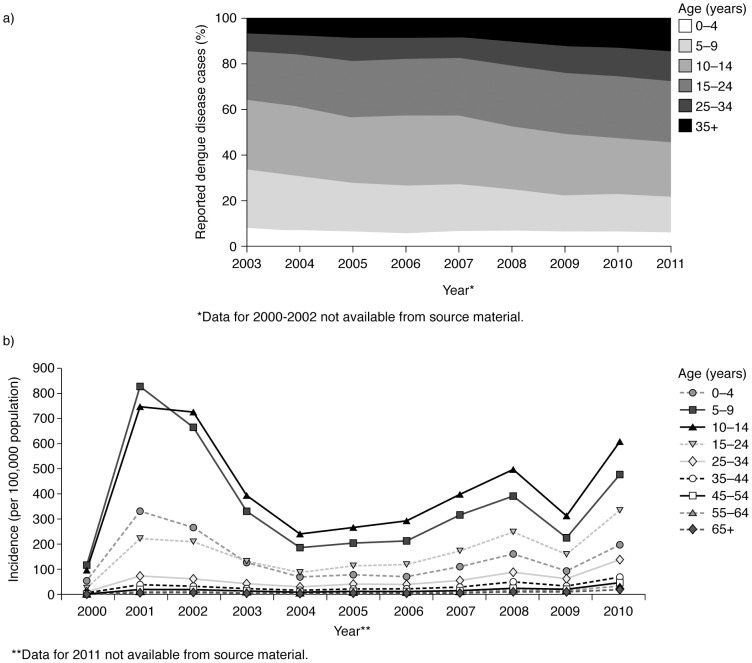
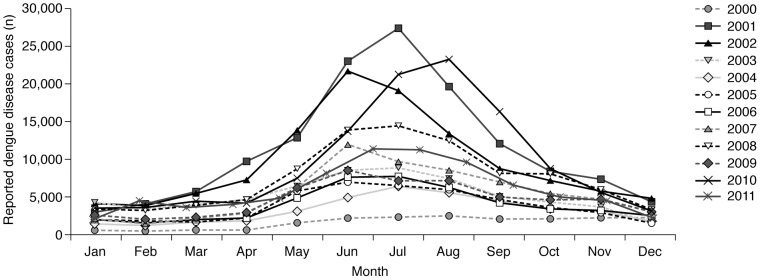
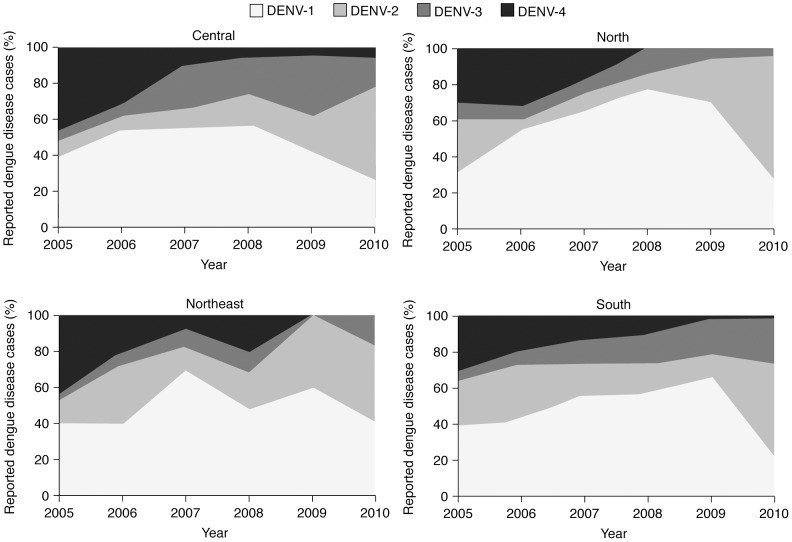
A literature survey and analysis was conducted to describe the epidemiology of dengue disease in Thailand reported between 2000 and 2011. The literature search identified 610 relevant sources, 40 of which fulfilled the inclusion criteria defined in the review protocol. Peaks in the number of cases occurred during the review period in 2001, 2002, 2008 and 2010. A shift in age group predominance towards older ages continued through the review period. Disease incidence and deaths remained highest in children aged ≤ 15 years and case fatality rates were highest in young children. Heterogeneous geographical patterns were observed with higher incidence rates reported in the Southern region and serotype distribution varied in time and place. Gaps identified in epidemiological knowledge regarding dengue disease in Thailand provide several avenues for future research, in particular studies of seroprevalence.

Protocol registration: PROSPERO CRD42012002170.


Conflict of interest statement

KL declares no conflicts of interest. JB is employed by sanofi-aventis Singapore Pte Ltd and ML is employed by Sanofi Pasteur. This does not alter our adherence to all PLoS policies on sharing data and materials.

Figures

Figure 1
Figure 1. Results of literature search and evaluation of identified data sources according PRISMA.
Duplicates and articles that did not satisfy the inclusion criteria were removed following evaluation of the titles and abstracts. The full text of these documents was examined to facilitate the final selection of relevant articles. Included publications were collated and summarized using a data extraction instrument developed as a series of spreadsheets, as described in the protocol.
Figure 2
Figure 2. Number of reported dengue disease cases and dengue disease incidence, Thailand, 2000–2011 –.
The number of reported dengue disease cases is plotted against the left-hand vertical axis. Peaks in the number of cases (national epidemics) that were above the 75th percentile for the period occurred in 2001, 2002 and 2010; another peak (which was at the 70th percentile) occurred in 2008. The incidence of dengue disease per 100,000 population is plotted against the right-hand vertical axis. The incidence averaged 115 cases annually between 2000 and 2011. No clear trend over time in the number or incidence of reported dengue disease cases could be discerned as the pattern over the review period was complicated by epidemic years.
Figure 3
Figure 3. Reported cases of dengue fever, dengue haemorrhagic fever and dengue shock syndrome, Thailand, 2000–2011 –.
The contribution of DSS to the total number of dengue disease cases remained relatively stable over the decade. Over the same period, the proportion of the total dengue disease cases classified as DF tended to increase year-on-year (with the exception of 2010–2011) whereas the contribution of DHF to the total number of dengue disease cases decreased. DF, dengue fever; DHF, dengue haemorrhagic fever; DSS, dengue shock syndrome.
Figure 4
Figure 4. Reported dengue disease incidence by region, Thailand, 2000–2011 –.
The patterns of regional dengue disease case numbers broadly reflected those observed nationally. The reported incidence of dengue disease was highest in the South region in 2001, 2002, 2005, 2007 and 2010.
Figure 5
Figure 5. Pattern of reported cases and incidence of dengue disease, by age, Thailand, 2000–2011 –.
Dengue disease is a disease of children and young adults in Thailand. Panel (a) shows that most reported cases between 2003 and 2011* are in individuals aged between 5 and 24 years. There was a shift in age group predominance of dengue disease over the survey period from younger towards older individuals. The age-related incidence per 100,000 population between 2000 and 2010 (b) reveals the highest incidence rates were in those aged 10–14 years. *Age bands for 2011 differ (0–5, 6–10, 11–14, 15–24, 25–34, 35–44, 45–54, 55+) and do not match bands for disease numbers: consequently, some 2011 incidence figures are estimates.
Figure 6
Figure 6. Number of reported cases due to dengue disease, by month, Thailand, 2000–2012 –.
Most of Thailand has a tropical wet and dry or savannah climate, where the wettest months are usually August–October. Country-wide, average annual temperatures range from 19°C to 38°C, with higher temperatures in the dry season (November to March). The available data show a seasonal peak in the numbers of cases due to dengue between May and September reflecting seasonal changes in climate and the association between the wettest months and vector activity.
Figure 7
Figure 7. Change in pattern of circulating dengue virus serotypes by year and region, Thailand, 2005–2010 –.
Regional DENV serotype data for the period 2005–2010 show similar patterns in each region. Broadly, there was a reduction in the proportion of DENV-1 and an increase in the proportion of DENV-2 in all regions. The proportion of DENV-3 was variable by time and between regions, whereas DENV-4 only remained in circulation throughout this 5-year period in the Central region. DENV, dengue virus. *Data for 2000–2004 not available from source material.

References

    1. WHO. Global alert and response (GAR). Impact of dengue. Available: http://www.who.int/csr/disease/dengue/en/index.html. Accessed 19 October 2012.
    1. Scientific Working Group on Dengue (2007) Report of the Scientific Working Group on Dengue, 1–5 October 2006. Geneva: World Health Organization.
    1. World Health Organization. Dengue and dengue haemorrhagic fever. Fact sheet number 117 (Revised January 2012). Available: http://www.who.int/mediacentre/factsheets/fs117/en/. Accessed 19 October 2012.
    1. Bhatt S, Gething PW, Brady OJ, Messina JP, Farlow AW, et al. (2013) The global distribution and burden of dengue. Nature 496: 504–507. - PMC - PubMed
    1. Hammon WM (1973) Dengue hemorrhagic fever – do we know its cause? Am J Trop Med Hyg 22: 82–91. - PubMed

Publication types