

State-level estimates of obesity-attributable costs of absenteeism
- PMID: 25376405
- PMCID: PMC4225558
- DOI: 10.1097/JOM.0000000000000298
State-level estimates of obesity-attributable costs of absenteeism
Abstract
Objective: To provide state-level estimates of obesity-attributable costs of absenteeism among working adults in the United States.
Methods: Nationally representative data from the National Health and Nutrition Examination Survey for 1998 to 2008 and from the Behavioral Risk Factor Surveillance System for 2012 are examined. The outcome is obesity-attributable workdays missed in the previous year because of health and their costs to states.
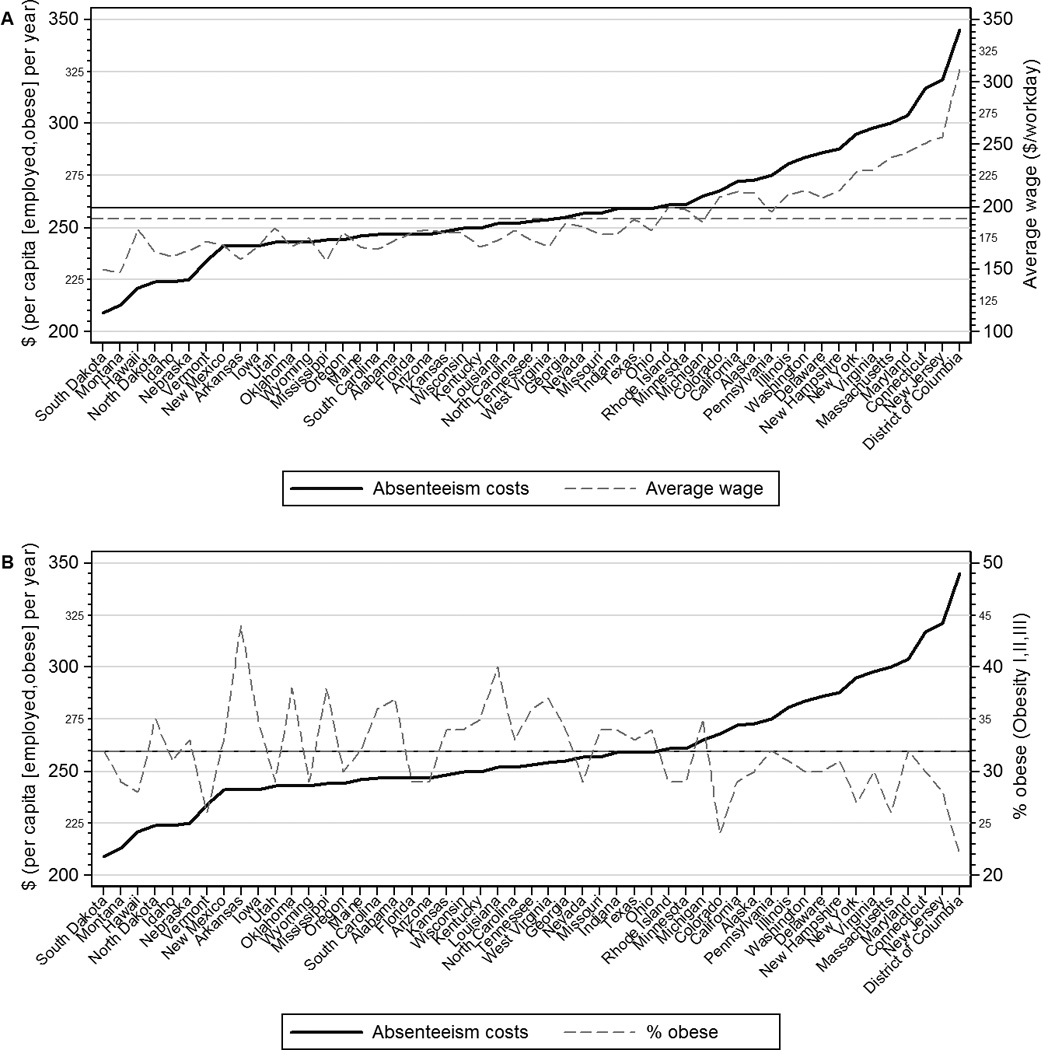
Results: Obesity, but not overweight, is associated with a significant increase in workdays absent, from 1.1 to 1.7 extra days missed annually compared with normal-weight employees. Obesity-attributable absenteeism among American workers costs the nation an estimated $8.65 billion per year.
Conclusions: Obesity imposes a considerable financial burden on states, accounting for 6.5% to 12.6% of total absenteeism costs in the workplace. State legislatures and employers should seek effective ways to reduce these costs.
Conflict of interest statement
Figures
References
-
- Finkelstein EA, Trogdon JG, Cohen JW, Dietz W. Annual medical spending attributable to obesity: payer- and service-specific estimates. Health Aff (Millwood) 2009;28:w822–w831. - PubMed
-
- Janssens H, Clays E, Kittel F, De Bacquer D, Casini A, Braeckman L. The association between body mass index class, sickness absence, and presenteeism. J Occup Environ Med. 2012;54(5):604–609. - PubMed
-
- Trogdon JG, Finkelstein EA, Hylands T, Dellea PS, Kamal-Bahl SJ. Indirect costs of obesity: a review of the current literature. Obes Rev. 2008;9(5):489–500. - PubMed
-
- Finkelstein EA, Di Bonaventura MD, Burgess SM, Hale BC. The costs of obesity in the workplace. J Occup Environ Med. 2010;52(10):971–976. - PubMed
Publication types
MeSH terms
Grants and funding
LinkOut - more resources
Full Text Sources
Other Literature Sources
Medical
