. 2015 Feb;29(2):443-54.
doi: 10.1096/fj.14-259564. Epub 2014 Nov 5.

IKKα is required for the homeostasis of regulatory T cells and for the expansion of both regulatory and effector CD4 T cells

Affiliations

IKKα is required for the homeostasis of regulatory T cells and for the expansion of both regulatory and effector CD4 T cells

Xin Chen et al. FASEB J. 2015 Feb.

Abstract

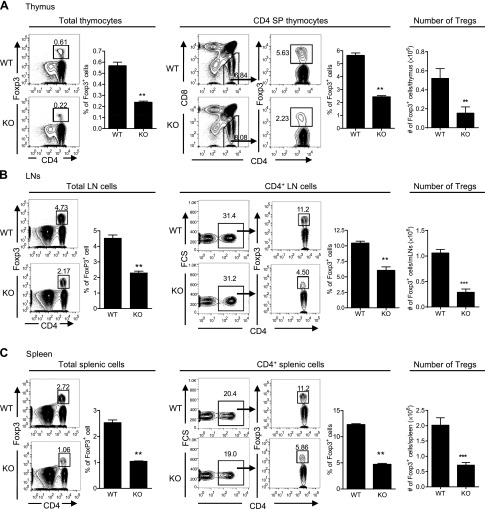
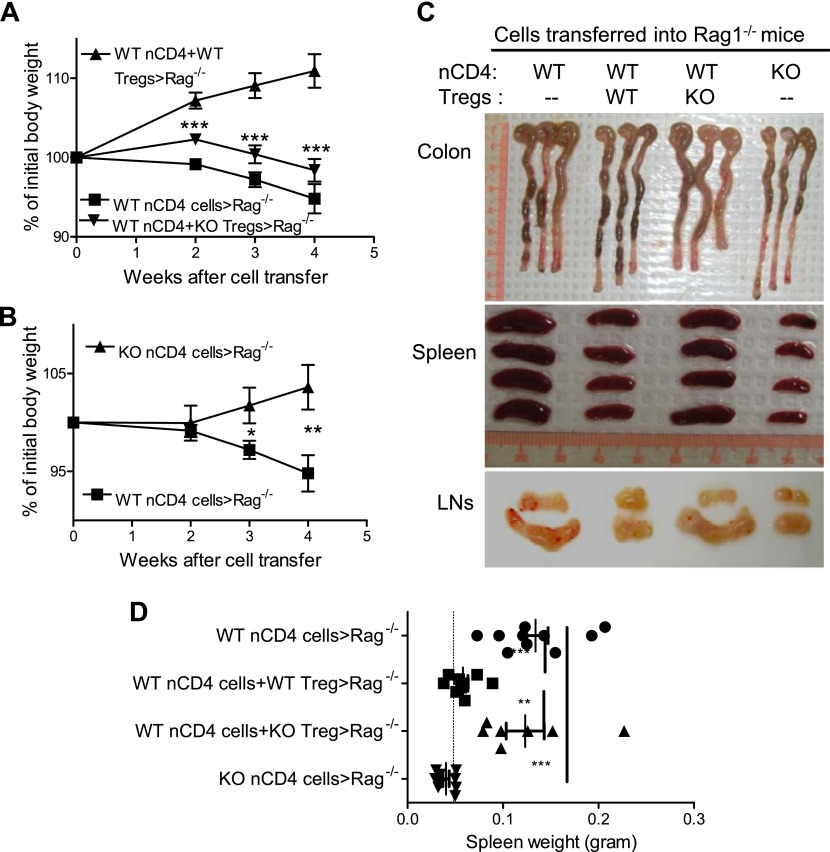
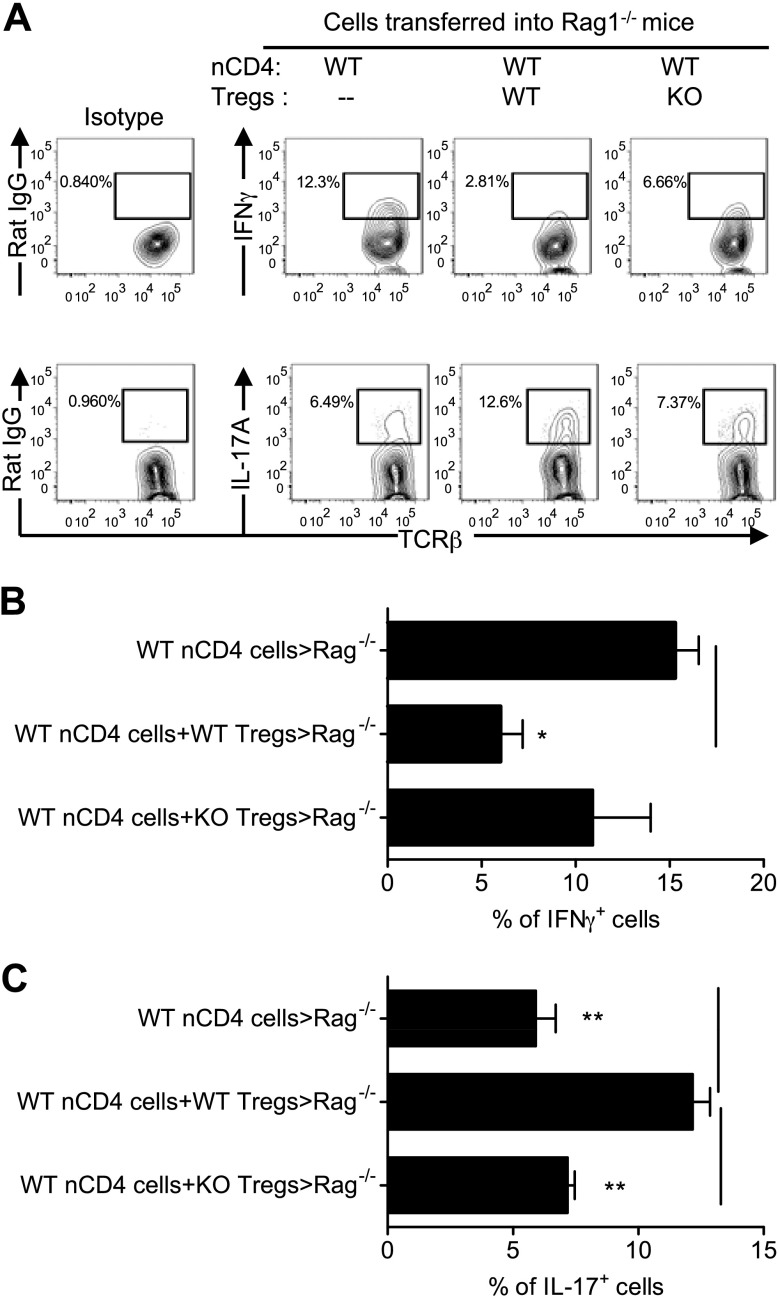
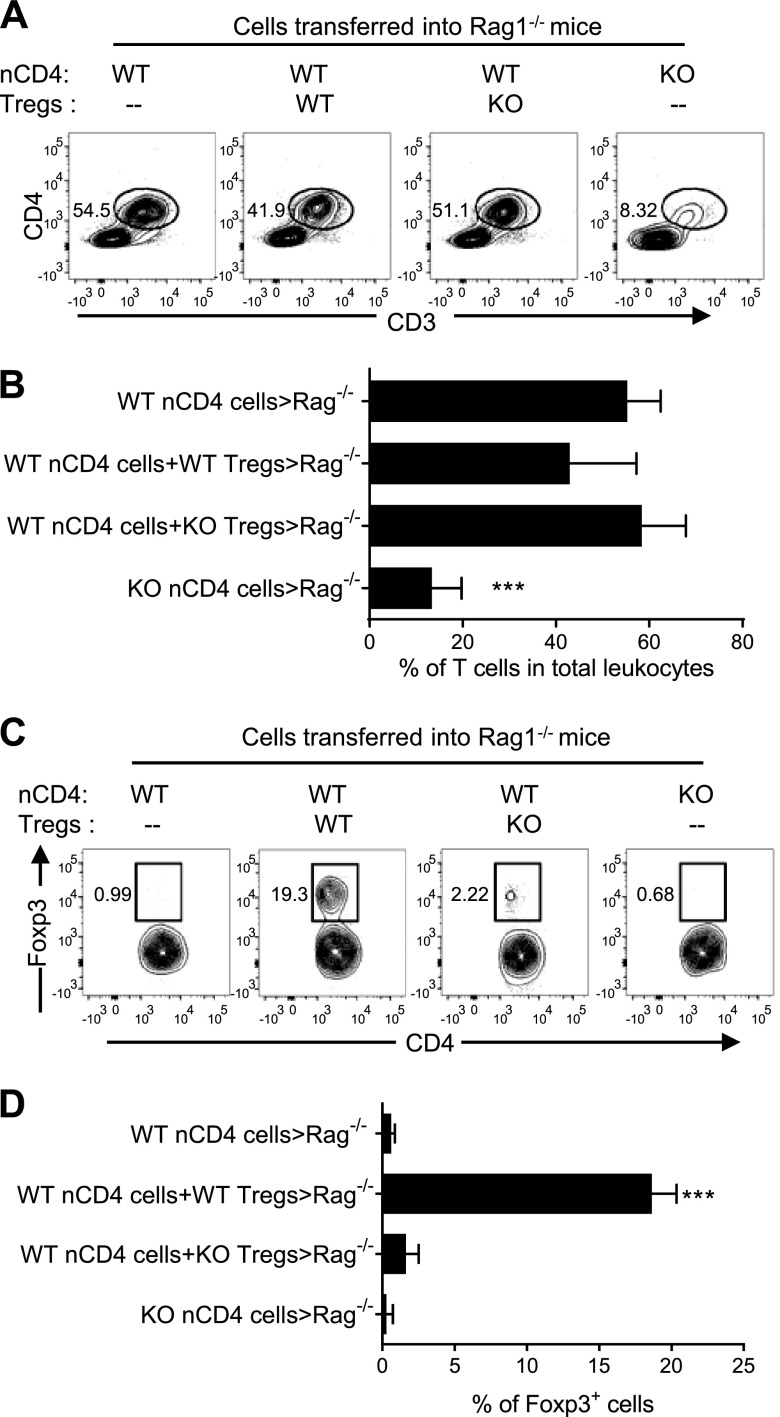
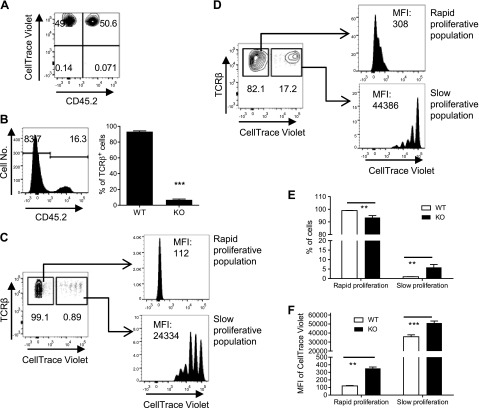
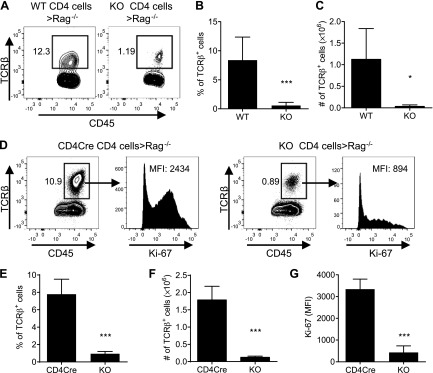
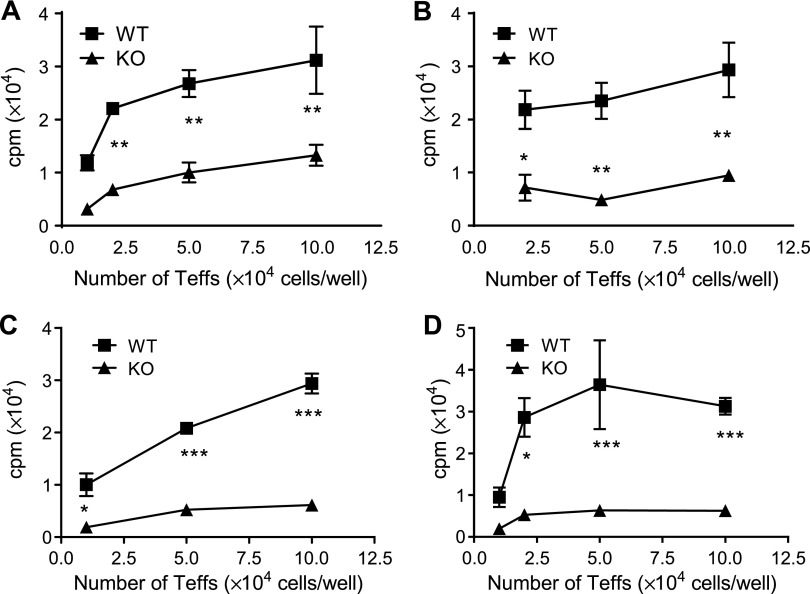
It was reported that TNF receptor type II signaling, which has the capacity to stimulate CD4+ forkhead box P3+ (Foxp3+) regulatory T cells (Tregs), activated the noncanonical NF-κB pathway in an IKKα-dependent manner. Therefore, we studied the role of IKKα in the homeostasis of Treg population. To this end, we generated a mouse strain with conditional knockout of IKKα in CD4 cells (Ikkα(f/f):CD4.Cre) that showed a >60% reduction in the number of Tregs in the thymus and peripheral lymphoid tissues, whereas the number of Foxp3- effector T cells (Teffs) remained at a normal level. The function of Tregs deficient in IKKα was examined using Rag1(-/-) mice cotransferred with naive CD4 cells (nCD4s). Although wild-type (WT) Tregs inhibited colitis induced by transfer of WT nCD4s, IKKα-deficient Tregs failed to do so, which was associated with their inability to reconstitute Rag1(-/-) mice. Furthermore, nCD4s deficient in IKKα also failed to reconstitute Rag1(-/-) mice and were defective in proliferative responses in vitro and in vivo. Thus, our study reveals a novel role of IKKα in the maintenance of a normal Treg population and in the control of expansion of CD4 T cells. These properties of IKKα may be exploited as therapeutic strategies in the treatment of major human diseases.

Keywords: Foxp3; colitis; lymphopenic mouse; proliferation.


Figures

Figure 1.
Figure 1.
The number of Tregs in Ikkαf/f:CD4.Cre mice is markedly reduced. Cells from the thymus, spleen, and LNs of WT mice and KO mice were stained with CD45, CD3, CD4, CD8, and Foxp3 Abs. The proportion of Foxp3+ cells was analyzed by FACS. A) Proportion of Foxp3+ cells in total thymocytes, in CD4+CD8 SP thymocytes, and the number of Foxp3+ cells in the thymus. B) Proportion of Foxp3+ cells in total LN cells, in CD4+ LN cells (pooled from mesenteric, axillary, and inguinal regions), and the number of Foxp3+ cells in the mLNs. C) Proportion of Foxp3+ cells in total splenic cells, in CD4+ splenic cells, and the number of Foxp3+ cells in spleen. Number in the FACS data indicates the proportion of gated cells. The summary of proportion or number of Tregs is shown as mean ± SD. Data shown are representatives of at least 3 separate experiments with similar results. Comparison (n = 3–5 mice per group, 2-tailed Student’s t test) between indicated groups is shown: **P < 0.01; ***P < 0.001.
Figure 2.
Figure 2.
In vivo effect of Tregs and Teffs from Ikkαf/f:CD4.Cre mice on the development of colitis in Rag 1−/− mice. nCD4s (CD4+CD25CD45RBhi) and Tregs (CD4+CD25+CD45RBlo) were flow sorted from WT mice and Ikkαf/f:CD4.Cre mice. WT nCD4s (4 × 10⁵ cells/mouse) were transferred alone or cotransferred with WT or KO Tregs at a 5:1 ratio into Rag1−/− mice. As a comparison, KO nCD4s (4 × 10⁵ cells/mouse) were also transferred alone into Rag 1−/− mice. A) Body weight change of mice transferred with WT nCD4s alone or cotransferred with WT Tregs or KO Tregs. B) Body weight change of mice transferred with WT nCD4s or KO nCD4s. Comparison (2-tailed Student’s t test) between WT nCD4-transfer group with other groups is shown: * P < 0.05; ** P < 0.01; *** P < 0.001. C) Representative photographs of colon, spleen, and LNs. D) Weight of spleens (n = 7–10). Dashed line indicates the weight of Rag1−/− mouse spleen without transfer of T cells. Data shown are representative of 3 separate experiments with similar results. Comparison (1-way ANOVA test) between indicated groups is shown: **P < 0.01; ***P < 0.001.
Figure 3.
Figure 3.
IKKα-deficient Tregs failed to suppress pathogenic Th1 responses in vivo. nCD4s and Tregs from WT mice and Ikkαf/f:CD4.Cre mice were transferred alone or cotransferred with WT or KO Tregs at a 5:1 ratio into Rag1−/− mice, as described in Fig. 2. After 8 wk, cLPLs were isolated. The intracellular expression of IFNγ and IL-17A by initially transferred naive WT CD4 cells presented in the cLPLs was analyzed by FACS, gating on TCRβ+CD4+Foxp3 cells. Representative FACS plot (A) and summary (B and C, mean ± SEM; n = 3–8) are shown. Data shown are representative of 3 separate experiments with similar results. Comparison (1-way ANOVA test) of indicated groups is shown: *P < 0.05; **P < 0.01.
Figure 4.
Figure 4.
IKKα is required for the repopulation of nCD4 T cells and Tregs in Rag1−/− mice. nCD4s and Tregs from WT mice and Ikkαf/f:CD4.Cre mice were transferred alone or cotransferred with WT or KO Tregs at a 5:1 ratio into Rag1−/− mice, as described in Fig. 2. After 8 wk, mice were sacrificed. A and B) The proportion of transferred CD4 T cells in the total CD45+ leukocyte population in mLNs of recipient Rag 1−/− mice was analyzed by FACS. (A) shows the representative FACS analysis (gating on CD45+ cells), and (B) shows the summary of data (mean ± SD; n = 7–9). Comparison (1-way ANOVA test) of KO nCD4 transfer alone with other groups is shown: ***P < 0.001, C, D) The proportion of Foxp3+ cells in transferred CD4 T cells present in the mLNs of recipient Rag 1−/− mice was analyzed by FACS, gating on CD45+CD3+CD4+ cells. The typical FACS data are shown in (C), and summary of data is shown in (D) (mean ± SD; n = 7–9). Compared (1-way ANOVA test) of WT nCD4s plus WT Tregs with other groups is shown: ***P < 0.001. The number in the FACS data indicates the proportion of cells in the respective gating. Data shown are representative of 3 separate experiments with similar results.
Figure 5.
Figure 5.
IKKα is crucial for competitive expansion of CD4 T cells in Rag1−/− mice. CD4 cells from spleens of Ly5.2 WT B6 mice (CD45.2) or Ikkαf/f:CD4.Cre mice (CD45.2+) were isolated by MACS and mixed at a 1:1 ratio and were labeled with CellTraceth Violet (A). The cells (2 × 10⁶ cells/mouse) were transferred into Rag1−/− mice. After 2 wk, recipient Rag1−/− mice were sacrificed. The proportion of WT and KO T cells in total transferred T cells (CD45+CD4+TCRβ+ cells) present in the spleen was analyzed by FACS (B) (left shows the typical FACS histogram, and right shows the summary; n = 3). Data shown are representatives of 3 separate experiments with similar results. Proliferation of WT CD4 cells (C) or KO CD4 cells (D) was analyzed by FACS, gating on their respective congenic marker. Typical FACS data are shown in (C) and (D). Summary of proportion of spontaneous and homeostatic proliferation cells is shown in (E), and the MFI of FxCycle Violet of both forms of proliferation is shown in (F) (n = 10), pooled from 2 separate experiments. Number in the FACS data indicates the proportion of gated cells or MFI. Comparison (2-tailed Student’s t test) between indicated groups is shown: **P < 0.01; ***P < 0.001.
Figure 6.
Figure 6.
Impaired capacity of unfractionated CD4 T cells to repopulate in Rag 1−/− mice. A–C) CD4 cells from WT (Ikkαf/f mice) and Ikkαf/f:CD4.Cre mice were isolated by MACS. The cells (1.6 × 10⁶ cells/mouse) were transferred into Rag1−/− mice. After 17 d, recipient Rag1−/− mice were sacrificed. The proportion of WT and KO T cells (TCRβ+ cells) in total CD45+ leukocytes present in the spleen was analyzed by FACS. A) Representative FACS plots. The analysis of TCRβ+ cells was gated on CD45+ splenic cells. B) Summary of the proportion of TCRβ+ cells in CD45+ splenic cells (mean ± SD; n = 4–6). C) The number of transferred cells in the recipient mouse spleen (mean ± SD; n = 4–6). D–G) CD4 cells from CD4.Cre mice or KO (Ikkαf/f:CD4.Cre) mice were isolated by MACS. The cells (4 × 10⁶ cells/mouse) were transferred into Rag1−/− mice. After 14 d, recipient Rag1−/− mice were sacrificed. The proportion and Ki-67 expression by CD4.Cre or KO T cells (TCRβ+ cells) present in the spleen were analyzed by FACS. D) Representative FACS plots. The analysis of TCRβ+ cells was gated on CD45+ splenic cells, and analysis of Ki-67 was gated on TCRβ+ cells. E) Summary of the proportion of TCRβ+ cells in CD45+ splenic cells (mean ± SD; n = 4). F) The number of transferred cells in the recipient mouse spleen (mean ± SD; n = 4). G) Summary of Ki-67 expression (MFI, mean fluorescence intensity) by transferred cells. Data shown are representative of 2 separate experiments with similar results. Number in the FACS data indicates the proportion of gated cells or MFI. Comparison (2-tailed Student’s t test) between indicated groups is shown: *P < 0.05; ***P < 0.001.
Figure 7.
Figure 7.
Proliferative responses of nCD4s from Ikkαf/f:CD4.Cre mice to TCR stimulation. CD4+CD25 cells were flow sorted from spleens and LNs pooled from 3 WT or 3 Ikkαf/f:CD4.Cre mice. The cells were seeded to the round-bottom 96-well plate at 104–105 cells/well in triplicate. The cells were stimulated with soluble anti-CD3 Ab and APCs from WT mice (A) or from Ikkαf/f:CD4.Cre mice (B), or cells were stimulated with plate-bound anti-CD3 Ab alone (C) or plate-bound anti-CD3 Ab and soluble anti-CD28 Ab (D) for 72 h. Proliferation was measured by [3H]thymidine incorporation assay. Data (mean ± SD; n = 3) shown are representatives of 3 separate experiments with similar results. Data were analyzed with 2-way ANOVA test: *P < 0.05; **P < 0.01; ***P < 0.001.

References

    1. Zhu J., Yamane H., Paul W. E. (2010) Differentiation of effector CD4 T cell populations (*). Annu. Rev. Immunol. 28, 445–489 - PMC - PubMed
    1. Kaech S. M., Wherry E. J., Ahmed R. (2002) Effector and memory T-cell differentiation: implications for vaccine development. Nat. Rev. Immunol. 2, 251–262 - PubMed
    1. Sakaguchi S., Yamaguchi T., Nomura T., Ono M. (2008) Regulatory T cells and immune tolerance. Cell 133, 775–787 - PubMed
    1. Zou W. (2006) Regulatory T cells, tumour immunity and immunotherapy. Nat. Rev. Immunol. 6, 295–307 - PubMed
    1. Dev A., Iyer S., Razani B., Cheng G. (2011) NF-κB and innate immunity. Curr. Top. Microbiol. Immunol. 349, 115–143 - PubMed

Publication types

LinkOut - more resources