

Review
doi: 10.1039/c4dt02958e.
MR imaging probes: design and applications
Affiliations
- PMID: 25376893
- PMCID: PMC5155710
- DOI: 10.1039/c4dt02958e
Item in Clipboard
Review
MR imaging probes: design and applications
Dalton Trans.
.
Abstract
This perspective outlines strategies towards the development of MR imaging probes that our lab has explored over the last 15 years. Namely, we discuss methods to enhance the signal generating capacity of MR probes and how to achieve tissue specificity through protein targeting or probe activation within the tissue microenvironment.
Figures
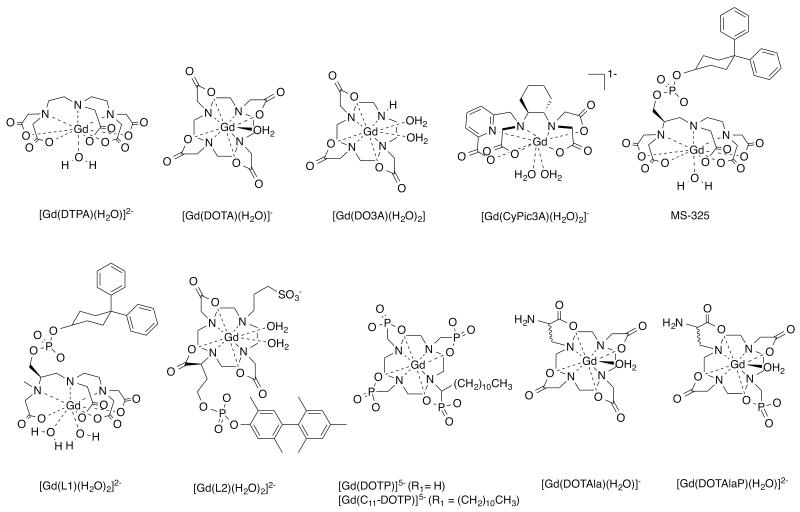
Gadolinium and manganese complexes described and discussed in this perspective.
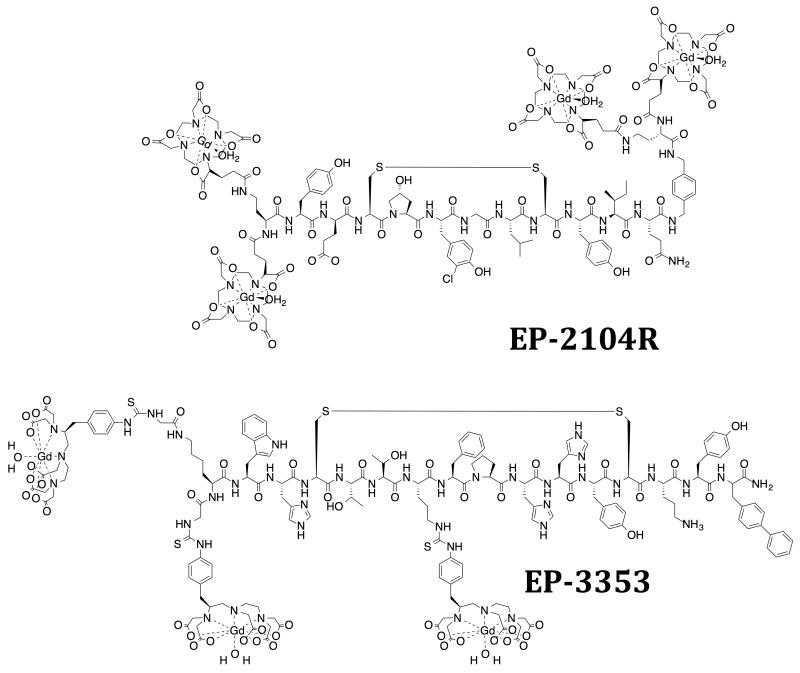
Fibrin-targeting probe EP-2104R and type I collagen targeting probe EP-3353. Charges omitted for clarity.
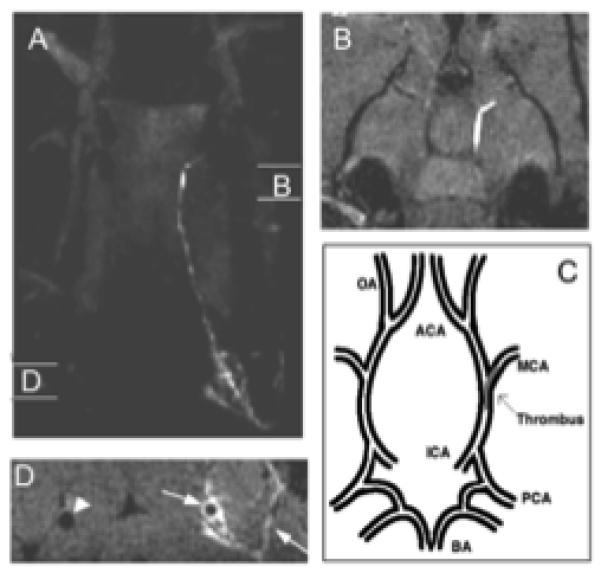
Panel A shows a maximum projection image of the head of a rat with an intracranial thrombus taken after injection of EP-2104R. The regions denoted “B” and “D” show the sites of the two dimensional images shown in panels B and D, respectively. Panel B shows a region of bright signal located in the internal carotid artery (ICA) and branching into the middle cerebral artery (MCA). Panel C shows a description of the vascular anatomy in the region of the brain represented in Panel B. Panel D shows cross sectional images of the common carotid arteries. The arrows denote mural thrombus along the vessel wall and of clotted side branches. The arrowhead shows the patent contralateral carotid artery. Adapted with permission from reference 60.
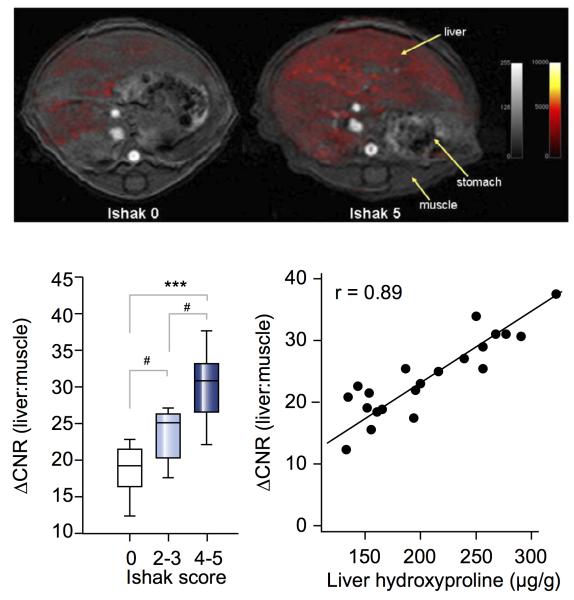
Top: Axial T1-weighted image (4.7T) of liver in healthy control (Ishak 0, left) and severely fibrotic (Ishak 5, right) mice. False color scale depicts difference in liver to muscle contrast to noise (ΔCNR) ratio pre- and post-injection of EP-3353. Bottom Left: Correlation between ΔCNR and Ishak score. Bottom right: Correlation between ΔCNR and liver hydroxyproline concentration calculated ex vivo. Adapted with permission from reference 71.
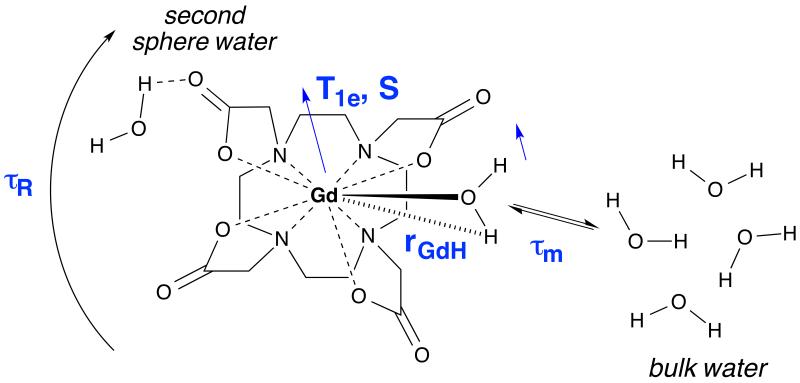
Molecular parameters that influence inner- and 2nd-sphere relaxivity.
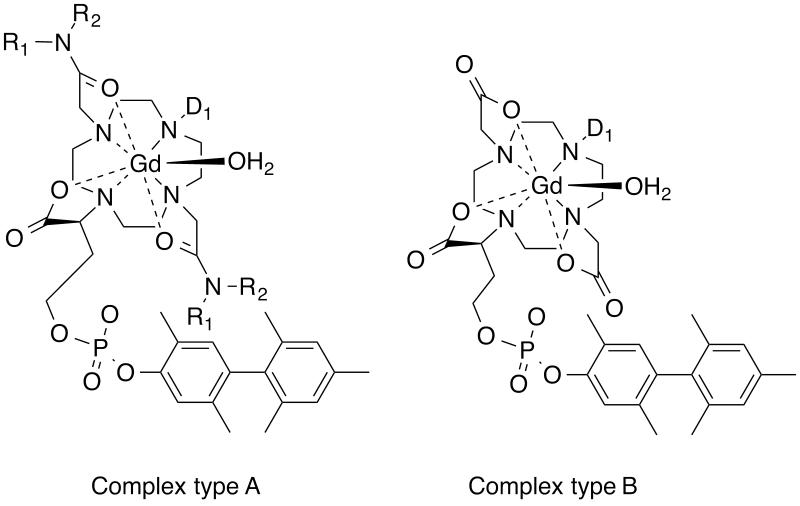
Libraries of HSA-binding Gd complexes. Complex type A was a library where R1 and R2 groups were varied to enhance second sphere relaxivity, while the D1 donor group was varied to offset the slow water exchange effect of the two acetamide donors. Complex type B was a library that explored the effect of a single donor group D1 variation on water exchange kinetics, electronic relaxation, and how these affected relaxivity. See also Figure 8.
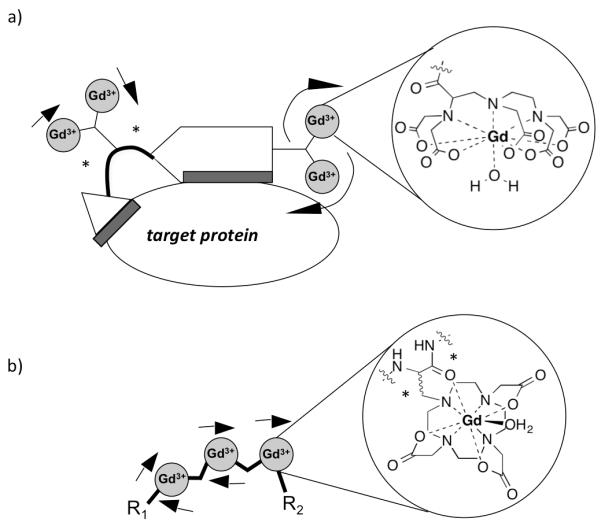
Strategies to closely control rotational dynamics. a) Binding of two protein binding groups to one targeting molecule results in restriction of the rotation of two of the chelates (as indicated by small arrows) by dual attachment (indicated in blue). b) A multimer of the single amino acid Gd chelate Gd(DOTAla) also provides dual attachment of the Gd complex through the α carbon, as well as the carbonyl of the peptide backbone (indicated by asterisks). It is also important to note that in both cases, the chelators were attached using short linkers to ensure maximum rigidity.
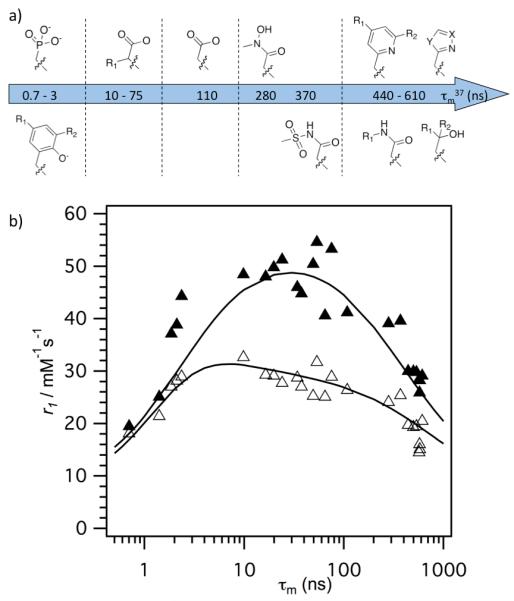
a) Varied donor group D1 from Figure 6, complex type B, resulting in q=1, HSA binding complexes with Gd. b) Relaxivity of these complexes in HSA solution at 37 °C plotted versus measured water residency time at 37 °C with data at 20 MHz (▴) and 60 MHz (▵). It is evident that τm limits relaxivity at a given field strength if it is either too long or too short, and that there is an optimal water exchange rate range for high relaxivity that becomes larger at higher fields. Reproduced with permission from reference 90.
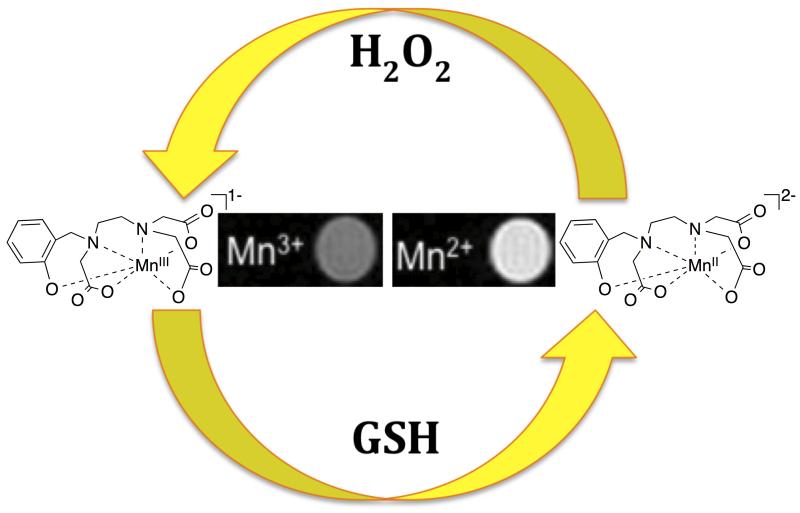
For [MnIIHBET]2−/1−, reversible switching between the Mn(II) and Mn(III) oxidation states can be achieved using glutathione (GSH) to increase relaxivity or H2O2 to decrease relaxivity. Adapted with permission from reference 155.
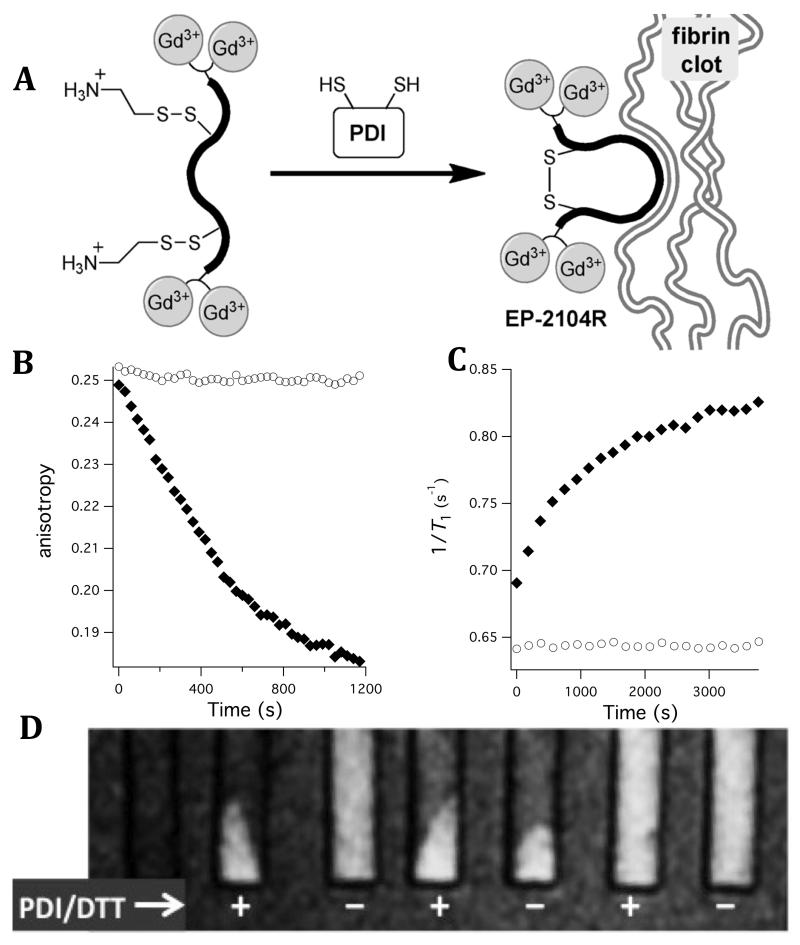
(A) PDI activation of mixed disulphide prodrug to fibrin binding EP-2104R. (B) In the presence of PDI (filled symbols) but not the absence (open symbols), the prodrug activated and can displace a fluorescent probe bound to the soluble fibrin fragment DD(E). (C) PDI activation of the prodrug is also monitored by the increase in relaxivity upon binding to DD(E); filled symbols show 1/T1 in presence of PDI and open symbols show no change in T1 in absence of PDI. (D) T1-weighted images of pelleted fibrin at 1.4T. From left to right: fibrin alone, prodrug +PDI, prodrug −PDI, EP-2104R (positive fibrin binding control) +/−PDI, linear thioether (negative control) +/−PDI. Prodrug only shows binding to fibrin in presence of PDI. Adapted with permission from reference 157.
Similar articles
-
Molecular Magnetic Resonance Imaging with Gd(III)-Based Contrast Agents: Challenges and Key Advances.J Am Chem Soc. 2019 Oct 30;141(43):17025-17041. doi: 10.1021/jacs.9b09149. Epub 2019 Oct 17. J Am Chem Soc. 2019. PMID: 31593630 Free PMC article. Review.
-
Basic MR relaxation mechanisms and contrast agent design.J Magn Reson Imaging. 2015 Sep;42(3):545-65. doi: 10.1002/jmri.24787. Epub 2015 May 14. J Magn Reson Imaging. 2015. PMID: 25975847 Free PMC article. Review.
-
Multifunctional Magnetic Resonance Imaging Probes.Recent Results Cancer Res. 2020;216:189-226. doi: 10.1007/978-3-030-42618-7_6. Recent Results Cancer Res. 2020. PMID: 32594388 Review.
-
Development and in vitro study of a bi-specific magnetic resonance imaging molecular probe for hepatocellular carcinoma.World J Gastroenterol. 2019 Jun 28;25(24):3030-3043. doi: 10.3748/wjg.v25.i24.3030. World J Gastroenterol. 2019. PMID: 31293339 Free PMC article.
-
PET-MR and SPECT-MR multimodality probes: Development and challenges.Theranostics. 2018 Nov 29;8(22):6210-6232. doi: 10.7150/thno.26610. eCollection 2018. Theranostics. 2018. PMID: 30613293 Free PMC article. Review.
Cited by
-
Nanogels as imaging agents for modalities spanning the electromagnetic spectrum.Mater Horiz. 2016 Jan 21;3(1):21-40. doi: 10.1039/c5mh00161g. Epub 2015 Oct 19. Mater Horiz. 2016. PMID: 27398218 Free PMC article. Review.
-
Molecular Magnetic Resonance Imaging Using a Redox-Active Iron Complex.J Am Chem Soc. 2019 Apr 10;141(14):5916-5925. doi: 10.1021/jacs.9b00603. Epub 2019 Mar 28. J Am Chem Soc. 2019. PMID: 30874437 Free PMC article.
-
An ultra-sensitive T 2-weighted MR contrast agent based on Gd3+ ion chelated Fe3O4 nanoparticles.RSC Adv. 2020 May 12;10(31):18054-18061. doi: 10.1039/d0ra01807d. eCollection 2020 May 10. RSC Adv. 2020. PMID: 35517217 Free PMC article.
-
Free-base porphyrins as CEST MRI contrast agents with highly upfield shifted labile protons.Magn Reson Med. 2019 Aug;82(2):577-585. doi: 10.1002/mrm.27753. Epub 2019 Apr 10. Magn Reson Med. 2019. PMID: 30968442 Free PMC article.
-
Screening of ligands for redox-active europium using magnetic resonance imaging.Bioorg Med Chem. 2018 Oct 15;26(19):5274-5279. doi: 10.1016/j.bmc.2018.04.001. Epub 2018 Apr 4. Bioorg Med Chem. 2018. PMID: 29653832 Free PMC article.
References
-
- Young IR. Methods in Biomedical Magnetic Resonance Imaging and Spectroscopy. John Wiley & Sons Ldt.; Chichester: 2000.
-
- Edelman GM, Hesselink JR, Zlatkin MB, Crues JV., III . Clinical Magneic Resonance Imaging. Volume 3. Elsevier Health; St. Louis: 2006.
-
- Ward K, Aletras A, Balaban R. J. Magn. Res. 2000;143:79. - PubMed
-
- Harvey P, Blamire AM, Wilson JI, Finney K-LN, Funk AM, Senanayake PK, Parker D. Chem. Sci. 2013;4:4251.
Publication types
MeSH terms
Substances
Grants and funding
LinkOut - more resources
Full Text Sources
Other Literature Sources
Medical
Miscellaneous