

The reef-building coral Siderastrea siderea exhibits parabolic responses to ocean acidification and warming
- PMID: 25377455
- PMCID: PMC4240989
- DOI: 10.1098/rspb.2014.1856
The reef-building coral Siderastrea siderea exhibits parabolic responses to ocean acidification and warming
Abstract
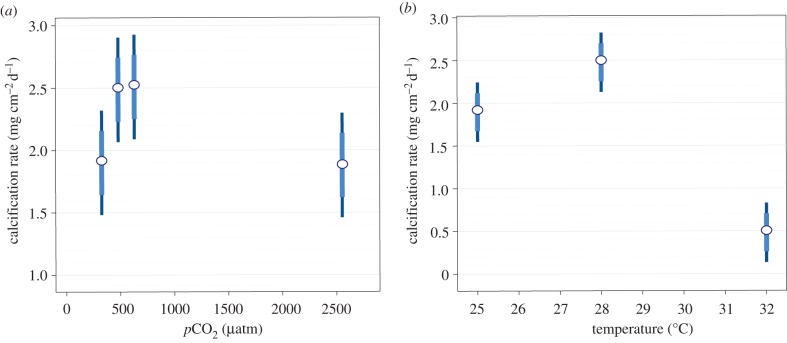
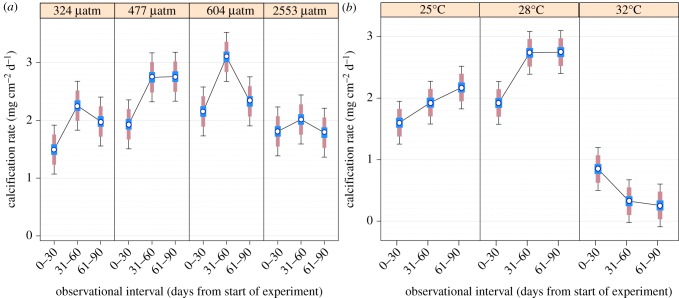
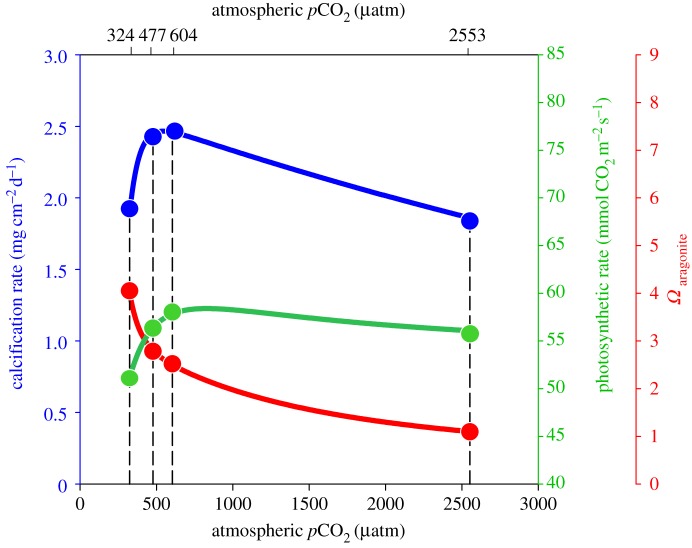
Anthropogenic increases in atmospheric CO2 over this century are predicted to cause global average surface ocean pH to decline by 0.1-0.3 pH units and sea surface temperature to increase by 1-4°C. We conducted controlled laboratory experiments to investigate the impacts of CO2-induced ocean acidification (pCO2 = 324, 477, 604, 2553 µatm) and warming (25, 28, 32°C) on the calcification rate of the zooxanthellate scleractinian coral Siderastrea siderea, a widespread, abundant and keystone reef-builder in the Caribbean Sea. We show that both acidification and warming cause a parabolic response in the calcification rate within this coral species. Moderate increases in pCO2 and warming, relative to near-present-day values, enhanced coral calcification, with calcification rates declining under the highest pCO2 and thermal conditions. Equivalent responses to acidification and warming were exhibited by colonies across reef zones and the parabolic nature of the corals' response to these stressors was evident across all three of the experiment's 30-day observational intervals. Furthermore, the warming projected by the Intergovernmental Panel on Climate Change for the end of the twenty-first century caused a fivefold decrease in the rate of coral calcification, while the acidification projected for the same interval had no statistically significant impact on the calcification rate-suggesting that ocean warming poses a more immediate threat than acidification for this important coral species.
Keywords: Caribbean; Siderastrea siderea; calcification; ocean warming, ocean acidification; tropical scleractinian coral.
Figures
References
-
- Keeling R, Piper S, Bollenbacher A, Walker J. 2009. Atmospheric CO2 records from sites in the SIO air sampling network. In Trends: a compendium of data on Global Change, Carbon Dioxide Information Analysis Center. Oak Ridge, TN: Oak Ridge National Laboratory, US Department of Energy.
-
- Raven J, Caldeira K, Elderfield H, Hoegh-Guldberg O, Liss P, Riebesell U, Shephard J, Turley C, Watson A. 2005. Ocean acidification due to increasing atmospheric carbon dioxide. Policy Document 12/05 London, UK: The Royal Society.
-
- Trenberth KE, et al. 2007. In Climate Change 2007: The Physical Science Basis Contribution of Working Group I to the Fourth Assessment Report of the Intergovernmental Panel on Climate Change (eds S Solomon, D Qin, M Manning, Z Chen, M Marquis, KB Averyt, M Tignor, HL Miller). Cambridge, UK and New York, NY, USA: Cambridge University Press.
Publication types
MeSH terms
Grants and funding
LinkOut - more resources
Full Text Sources
Other Literature Sources
Medical
Research Materials
Miscellaneous
