Review
. 2015 Jan;53(1):82-104.
doi: 10.1002/dvg.22832. Epub 2014 Nov 12.

Insulin-like genes in ascidians: findings in Ciona and hypotheses on the evolutionary origins of the pancreas

Affiliations
Review

Insulin-like genes in ascidians: findings in Ciona and hypotheses on the evolutionary origins of the pancreas

Jordan M Thompson et al. Genesis. 2015 Jan.

Abstract

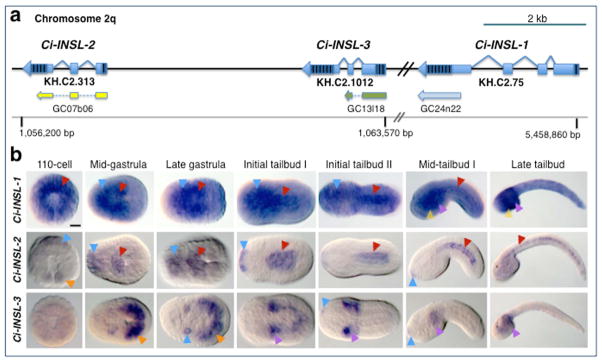
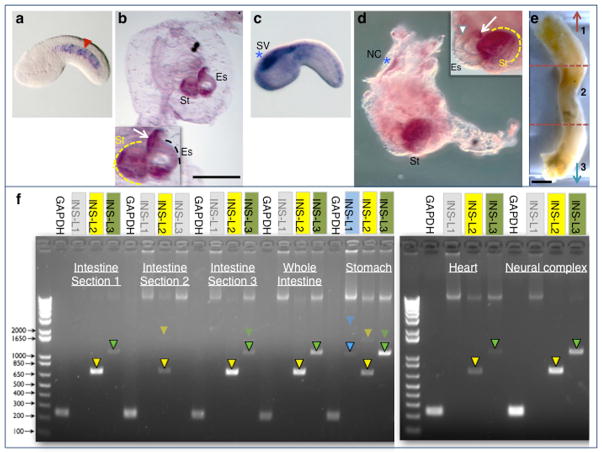
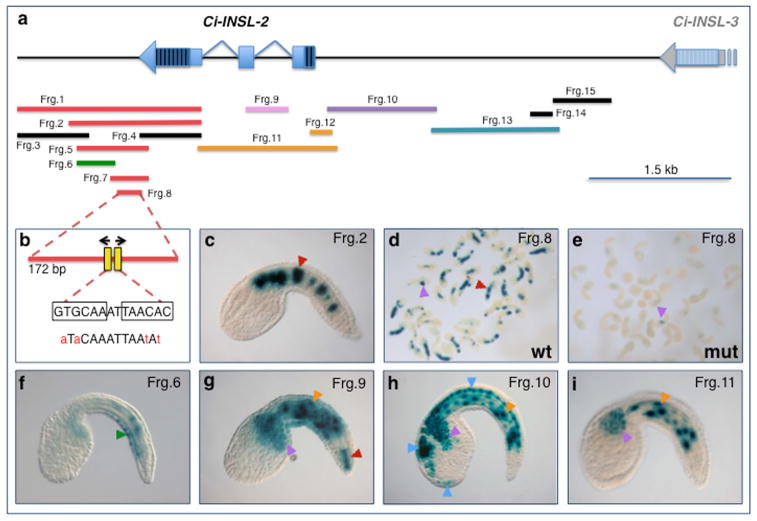
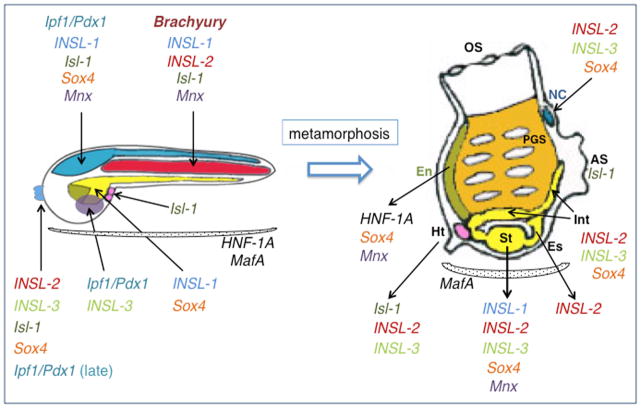
Insulin plays an extensively characterized role in the control of sugar metabolism, growth and homeostasis in a wide range of organisms. In vertebrate chordates, insulin is mainly produced by the beta cells of the endocrine pancreas, while in non-chordate animals insulin-producing cells are mainly found in the nervous system and/or scattered along the digestive tract. However, recent studies have indicated the notochord, the defining feature of the chordate phylum, as an additional site of expression of insulin-like peptides. Here we show that two of the three insulin-like genes identified in Ciona intestinalis, an invertebrate chordate with a dual life cycle, are first expressed in the developing notochord during embryogenesis and transition to distinct areas of the adult digestive tract after metamorphosis. In addition, we present data suggesting that the transcription factor Ciona Brachyury is involved in the control of notochord expression of at least one of these genes, Ciona insulin-like 2. Finally, we review the information currently available on insulin-producing cells in ascidians and on pancreas-related transcription factors that might control their expression.

Keywords: Brachyury; Ciona; ascidian; cis-regulatory module; insulin; notochord; pancreas; transcription factor.


Figures

Figure 1
Figure 1. Genomic organization and embryonic expression of Ciona insulin-like genes
a: Schematic representation of the regions of Ciona intestinalis chromosome 02q that contain the genomic loci of Ci-INSL-2, Ci-INSL-3 and Ci-INSL-1. Genes are represented as light-blue bars (exons) and angled lines (introns); striped areas indicate untranslated regions. Current gene model identifiers are indicated underneath each gene. The ESTs used for in situ hybridizations are depicted below each gene model in yellow, green, and light blue, respectively, along with the coordinates that allow their identification within the Ciona intestinalis Gene Collection (Satou et al., 2002). A grey horizontal line symbolizes the chromosomal DNA and reports the location of essential mapping landmarks in base pairs (bp). b: Microphotographs of Ciona intestinalis whole-mount embryos at the stages indicated on top of each column, hybridized in situ with digoxygenin-labeled antisense RNA probes synthesized from the EST clones shown in a, essentially as previously described (Oda-Ishii and Di Gregorio, 2007). Gene names are indicated on the left side of each row. 110-cell embryos are shown in vegetal views, the remaining embryos are shown with anterior to the left. Arrowheads point at representative regions of larger structures, and are color-coded as follows: red, notochord; blue, nervous system and primordium of the adhesive organ, which represents the anterior-most structure in tailbud embryos; orange, muscle precursors; purple, mesenchyme; yellow, endoderm. Scale bar: ~25 microns.
Figure 2
Figure 2. Expression of Ciona insulin-like genes after metamorphosis
a: Mid-tailbud I Ciona whole-mount embryo hybridized in situ with the Ci-INSL-2 digoxygenin-labeled antisense RNA probe. Red arrowhead: notochord, showing expression. b: Whole-mount Ciona stage 4 juvenile (Chiba et al., 2004) hybridized in situ with the Ci-INSL-2 digoxygenin-labeled antisense RNA probe, as in a. Expression is seen in esophagus (Es) and stomach (St) (both magnified in inset). The stomach is partially encircled by a yellow dashed line; the esophagus is contoured by a dashed black line. c: Mid-tailbud I Ciona whole-mount embryo hybridized in situ with the Ci-Na+/K+-transporting ATPase alpha3-1 (aka ATP1A1/2/3/4, gene model: KH.L157.5) digoxygenin-labeled antisense RNA probe. Blue asterisk: sensory vesicle (SV), showing expression. d: Whole-mount Ciona juvenile, around stage 6 (Chiba et al., 2004), hybridized in situ with the Ci-Na+/K+-transporting ATPase alpha3-1 probe. Expression is seen in part of the stomach and possibly in part of the rim of the esophagus (inset), as well as in the neural complex (NC). The blue asterisks in c and d refer to the persistence of cells of the sensory vesicle in the adult neural complex. Inset shows a higher magnification view of the esophagus and stomach, as seen on a different plane of focus. The white arrow points at the rim of the esophagus; the white arrowhead highlights the ventral groove of the esophagus, an anatomical point of reference. The stomach is partially encircled by a yellow dashed line. e: Dissected intestine of an adult Ciona, which was used for the detection of the expression of Ci-INSL-1, Ci-INSL-2 and Ci-INSL-3 by RT-PCR. The intestine was arbitrarily subdivided into three sections of similar length, indicated as 1-3 and separated by dashed lines. The red arrow points towards the stomach, the teal arrow towards the anus. Scale bars: in b, 200 microns; in e, 2 millimiters. f: Gel electrophoresis of RT-PCR products obtained from RNAs extracted from different regions of the intestine and the stomach of an adult Ciona individual, and from hearts and neural complexes pooled from multiple animals. Gel lanes are labeled on top with the names of the genes that were monitored. Gene names were colored in transparent grey to symbolize lack of expression. Unlabeled lanes contain a molecular weight marker; the sizes of its most informative bands are indicated on the left side. Expression of the housekeeping gene GAPDH (Glyceraldehyde 3-phosphate dehydrogenase) was monitored in each experiment as a positive control. Expected sizes of PCR products: GAPDH, 250 bp; INS-L1, 1,074 bp for spliced transcript (blue arrowhead) and ~2.2 kb for genomic (faded blue arrowhead); INS-L2, 710 bp for spliced transcript (yellow arrowheads) and ~1.55 kb for genomic (faded yellow arrowheads); INS-L3, 1,069 bp, for spliced transcript (green arrowheads) and ~1.47 kb for genomic (faded green arrowheads). Conditions for RT-PCR: RNA was extracted by dissecting adult animals and by processing organ tissues as recommended by the Qiagen RNeasy kit (QIAGEN). DNAse treatment was used to minimize genomic contamination, according to the manufacturer’s instructions. cDNA synthesis was then conducted for each sample using the designed primers and standard RT-PCR protocol with Superscript III reverse transcriptase (Invitrogen), according to the manufacturer’s instructions. PCR conditions included an initial denaturation step at 94°C for 2.5 minutes, and 27 cycles as follows: 94°C for 15 seconds, 60°C for 30 seconds, 72°C for 30 seconds. After a last step at 72°C for 10 minutes, samples were cooled at 16°C and then stored at −20°C. cDNA products were subsequently used to amplify specific regions of the GAPDH control and of each Ci-INSL gene. Forward and reverse primers for GAPDH and each Ci-INSL gene were designed in the first and in the last exons. The sequences of the primers were: GAPDH.F 5′-GCAGGAGCTGGCATTGCAC-3′ and GAPDH.R 5′-ACAGTAAGATTGCATGCAACAG-3′ for GAPDH; IL-1.V1.F 5′-TCTTTTATAGGACACAGCGCATTA-3′ and IL-1.V2.R 5′-TAAACGACCATCACAGAACAATG-3′ for Ci-INSL-1; IL-2.V1.F 5′-CAGCTTTGTAACAGGACAGTGAAT-3′ and IL-2.Int.R1 5′-TGTGCAAAGCTGTGTTTTCCAAGC-3′ for Ci-INSL-2; IL-3.V1.F 5′-AGATAAAGGGATTAGGCAGAAGTG-3′ and IL-3.V2.R 5′-GCTGTCGTACTGGGGTGTAAATA-3′ for Ci-INSL-3. For the PCR amplification of GAPDH and Ci-INS-L genes, an initial 2.5-minute cycle at 94°C preceded 30 cycles as follows: 94°C for 30 seconds, 55°C for 30 seconds and 68°C for 3 minutes. After a last step at 68°C for 30 minutes, samples were cooled at 16°C for at least 15 minutes before gel electrophoresis.
Figure 3
Figure 3. Identification and characterization of a notochord CRM and various cis-regulatory elements in the Ci-INSL-2 genomic locus
a: Schematic representation of the chromosomal region encompassing the Ci-INSL-2 gene and part of Ci-INSL-3. Genes are represented as light-blue bars (exons) and lines (introns); striped areas indicate untranslated regions. Part of the Ci-INSL-3 coding region is depicted for reference (grey box). Colored horizontal bars symbolize genomic fragments, abbreviated as “Frg.” followed by a number, that were individually cloned upstream of the Ci-fkh/FoxA-a basal promoter region (Oda-Ishii and Di Gregorio, 2007) and tested in vivo in Ciona embryos by electroporation (Di Gregorio and Levine, 2002). The bars are color-coded as follows: red, fragments that predominantly show activity in the notochord; pink, fragments active in secondary notochord and additional tissues; orange, fragments predominantly active in muscle; light purple, fragments active in muscle, nervous system and mesenchyme; green, fragments mainly active in epidermis; teal, fragments mainly active in muscle and nervous system; black, fragments with no detectable activity. b: schematic structure of the minimal 172-bp notochord CRM isolated from the 3′-region of Ci-INSL-2 (Frg. 8). Two putative Ci-Bra binding sites (Passamaneck et al., 2009) with inverted orientation were mutagenized as shown below the diagram; mutations are indicated in red and lower case. These mutations were sufficient to completely abolish notochord activity of the CRM. c: Representative transgenic embryo carrying one of the truncations of the notochord CRM (Frg. 2, 1.26 kb). d: Low-magnification microphotograph of a group of transgenic embryos electroporated with the wild-type (wt) 172-bp Ci-INSL-2 notochord CRM (Frg. 8). Notochord staining (red arrowhead) is seen in most embryos and is occasionally associated with mesenchyme staining (purple arrowhead). e: Low-magnification microphotograph of a group of transgenic embryos from the same clutch as the embryos shown in d, electroporated with the 172-bp Ci-INSL-2 notochord CRM carrying the mutations (mut) in the putative Ci-Bra binding sites illustrated in b and reared, fixed and stained in parallel with the embryos shown in d. Staining is only detected in mesenchyme cells (purple arrowhead). f–i: Representative transgenic embryos carrying the fragments indicated on the top right corner of each panel, photographed after X-gal staining. Arrowheads: red, notochord; green, epidermis and tail epidermal neurons; orange: muscle; purple, mesenchyme; blue, nervous system.
Figure 4
Figure 4. Graphic summary of the pre- and post-metamorphosis expression territories of Ciona orthologs of evolutionarily conserved pancreatic transcription factors
Simplified drawings of a Ciona tailbud embryo (left) and a Ciona juvenile (right), not drawn to scale. For simplicity, the only tissues depicted in the tailbud are the notochord (red), CNS and adhesive organ (blue), trunk endoderm and endodermal strand (yellow), presumptive endostyle (green), trunk ventral cells (pink), mesenchyme (purple). In the juvenile, the only organs depicted are the endostyle (green), pharynx (orange) and pharyngeal gill slits, heart (pink), neural complex (blue), esophagus, stomach and intestine (all yellow). Gene names are abbreviated as in Table 1. Black arrows connect the genes to the territories where their expression has been reported (Table 1 and references therein). For the sake of completeness, we have tentatively included in this figure the expression patterns of Ci-INSL-1 and Ci-INSL-3; however, these patterns were detected in adults and might not be fully preserved in juveniles. Dotted semi-circles neighboring gene names symbolize ubiquitous or semi-ubiquitous expression of that particular gene. Abbreviations: OS, oral siphon; NC, neural complex; AS, atrial siphon; Int, intestine; Es, esophagus; St, stomach; Ht, heart; En, endostyle; PGS, pharyngeal gill slits.

Similar articles

Cited by

References

    1. Ahlgren U, Pfaff SL, Jessell TM, Edlund T, Edlund H. Independent requirement for ISL1 in formation of pancreatic mesenchyme and islet cells. Nature. 1997;385:257–260. - PubMed
    1. Artner I, Blanchi B, Raum JC, Guo M, Kaneko T, Cordes S, Sieweke M, Stein R. MafB is required for islet beta cell maturation. Proc Natl Acad Sci U S A. 2007;104:3853–3858. - PMC - PubMed
    1. Baquié M, St-Onge L, Kerr-Conte J, Cobo-Vuilleumier N, Lorenzo PI, Jimenez Moreno CM, Cederroth CR, Nef S, Borot S, Bosco D, Wang H, Marchetti P, Pattou F, Wollheim CB, Gauthier BR. The liver receptor homolog-1 (LRH-1) is expressed in human islets and protects {beta}-cells against stress-induced apoptosis. Hum Mol Genet. 2011;20:2823–2833. - PubMed
    1. Bevis PJ, Thorndyke MC. Endocrine cells in the oesophagus of the ascidian Styela clava, a cytochemical and immunofluorescence study. Cell Tissue Res. 1978;187:153–158. - PubMed
    1. Bort R, Martinez-Barbera JP, Beddington RS, Zaret KS. Hex homeobox gene-dependent tissue positioning is required for organogenesis of the ventral pancreas. Development. 2004;131:797–806. - PubMed

Publication types

MeSH terms

LinkOut - more resources