. 2014 Nov 5;34(45):14845-53.
doi: 10.1523/JNEUROSCI.2820-14.2014.

Cerebellar-dependent expression of motor learning during eyeblink conditioning in head-fixed mice

Affiliations

Cerebellar-dependent expression of motor learning during eyeblink conditioning in head-fixed mice

Shane A Heiney et al. J Neurosci. .

Abstract

Eyeblink conditioning in restrained rabbits has served as an excellent model of cerebellar-dependent motor learning for many decades. In mice, the role of the cerebellum in eyeblink conditioning is less clear and remains controversial, partly because learning appears to engage fear-related circuits and lesions of the cerebellum do not abolish the learned behavior completely. Furthermore, experiments in mice are performed using freely moving systems, which lack the stability necessary for mapping out the essential neural circuitry with electrophysiological approaches. We have developed a novel apparatus for eyeblink conditioning in head-fixed mice. Here, we show that the performance of mice in our apparatus is excellent and that the learned behavior displays two hallmark features of cerebellar-dependent eyeblink conditioning in rabbits: (1) gradual acquisition; and (2) adaptive timing of conditioned movements. Furthermore, we use a combination of pharmacological inactivation, electrical stimulation, single-unit recordings, and targeted microlesions to demonstrate that the learned behavior is completely dependent on the cerebellum and to pinpoint the exact location in the deep cerebellar nuclei that is necessary. Our results pave the way for using eyeblink conditioning in head-fixed mice as a platform for applying next-generation genetic tools to address molecular and circuit-level questions about cerebellar function in health and disease.

Keywords: cerebellum; classical conditioning; interpositus; mouse; neurophysiology; timing.


Figures

Figure 1.
Figure 1.
Apparatus for head-fixed eyeblink conditioning. A, Photograph of assembled components, including side view of cylindrical treadmill with bearings (inset). For description of labels, see Table 1. B, Top view of head-fixed mouse standing on treadmill. C, Schematic drawing illustrating how the head plate is attached to fixed rods via screws. D, Close-up front view of a head-fixed mouse, including the needle that delivers the puff US, on the right.
Figure 2.
Figure 2.
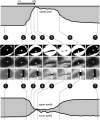
Eyelid movement detection algorithms. Illustration of algorithms used to measure eyelid closure using FEC (top panels) and eyelid edge position (bottom panels). Key time points during a paired CS–US trial are indicated by numbered lines connecting video frames to the corresponding points in the eyelid traces.
Figure 3.
Figure 3.
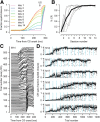
Learning curves for eyelid CRs. A, Average eyelid position traces during the ISI period (250 ms) for six mice throughout 14 d of conditioning to a light CS. Each trace is an average of the session-averaged traces of all six mice for the given session number. B, %CR during each session for the same six mice as in A. Gray traces are individual mice, and black trace is the average of all mice. C, Example eyelid traces in individual trials for one mouse during the first five sessions. Only the trace for every fifth trial is plotted for clarity. D, CR amplitudes of individual mice for every trial (gray dots). Black traces are moving averages of individual trials (11 trial window). Blue dotted lines indicate session boundaries. Mouse identification numbers are indicated in the top left of each panel.
Figure 4.
Figure 4.
Timing of eyelid CRs. A, Average eyelid position traces on CS-only trials for each ISI group. Trained ISI is indicated above each trace. Error clouds are SEM based on per mouse averages. Arrowheads indicate expected time of the puff. B, Scalar property of CR timing. Top, Average time of peak CR for individual mice from A (groups indicated by color). Error bars indicate SD. Bottom, SDs plotted against mean peak times for the same mice using the same color code. For an explanation of the arrows, see Results. The dotted line is a linear fit, with the corresponding R2 value, for data from all ISIs except 100 ms, which produced small and poorly timed CRs. C, Learned shifts of CR times. Top, Heat map of the average CR traces for CS-alone trials of each session during shifts from long to short and then short to long ISIs in a single mouse. Color indicates average CR amplitude at each time point (black < red < white). Each row is a different session, and the ISI for that session is indicated along the y-axis. Bottom, Average eyelid traces for the indicated sessions, which correspond to the last session before a switch (20, 32) or the final session (46). D, Average CR traces on CS-alone trials for five sessions from single mice trained with two different CS modalities that had different corresponding ISIs. Top, 200 ms vibrissa, 400 ms light. Bottom, 200 ms light, 400 ms vibrissa. All panels use similar color scheme to indicate ISIs as in A. Mouse identification numbers are indicated in the top left of each panel.
Figure 5.
Figure 5.
Pharmacological inactivation of DCN abolishes CRs. A, Bottom, Heat map showing average eyelid amplitude of seven mice during the ISI period (250 ms) on paired trials before and after muscimol infusion in the effective region (time of infusion indicated by red arrow). Top, Average traces for 25 trials before and 25 trials after infusion for the same mice (b, baseline; i, infusion). B, Same as A but for lidocaine in three mice (r, recovery period, indicated by a green arrow in the bottom panel). C, Schematic series of coronal sections through the cerebellum indicating locations of muscimol infusions that were highly effective (circles) or less effective (× symbols) at abolishing eyelid CRs. Distance from bregma (br) is indicated next to each section. D, Average %CR during control, infusion, or recovery period for mice in A and B for muscimol (musc; left), lidocaine (lidoc; middle), or vehicle (veh; right) infusions. Error bars indicate SEM. E, Location and extent of fluorescent muscimol diffusion (magenta) in one mouse. Cerebellar lobules and nuclei revealed by fluorescent Nissl counterstain (blue). Histograms on the left and top of the image show dorsoventral and mediolateral distribution of pixel intensities on the magenta (muscimol) channel for same section. The AIP, DLH, and LN outlined in white based on Nissl staining. Lobules IV/V and simplex (S) are labeled. Scale bar, 500 μm.
Figure 6.
Figure 6.
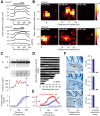
Electrophysiological localization of eyeblink hotspot. A, Individual traces of microstimulation-evoked eyelid movements at different depths near the hotspot for two different mice. Black bar indicates the duration of stimulation. B, Heat maps showing microstimulation-evoked eyelid amplitude at different dorsoventral (y-axis) and mediolateral (x-axis) locations for three different anteroposterior sections in the same two mice (anteroposterior coordinate of each section is indicated relative to bregma; br). Each small square is the eyelid closure produced by 5 μA (mouse 1) or 7 μA (mouse 2) microstimulation at that precise location, measured as the mean eyelid position in the last 50 ms of stimulation, averaged across three trials. Heat maps are normalized by maximal movement size in each experiment (color bar indicates value corresponding to maximum). The order of locations visited in microstimulation tracks was counterbalanced in the two mice. Arrows below the x-axis indicate the track corresponding to the traces in A. C, Example neuron recorded near the hotspot found using microstimulation as in A during paired trials in a mouse conditioned with a 200 ms ISI and a light CS. From the top, Extracellular signal during a single trial, raster of spike times for 10 paired trials, peristimulus time histogram, and eyelid position trials for the same 10 trials (light thin traces). Average eyelid position trace indicated by dark thick trace. D, Horizon plots showing the signal-to-noise ratio of recorded neurons over time (30 s moving average). Recordings were terminated after 1 h if the neuron was still isolated. E, Average firing rate (red) and eyelid position (blue) on paired trials for 16 neurons recorded in hotspot. Error cloud indicates SEM. F, Locations of lesions (triangles) in cresyl violet-stained coronal sections (left) and corresponding effect of lesion on CR amplitudes for three mice (right). Deep nuclei demarcated by dotted areas. Error bars indicate SEM.

Similar articles

Cited by

References

    1. Aiba A, Kano M, Chen C, Stanton ME, Fox GD, Herrup K, Zwingman TA, Tonegawa S. Deficient cerebellar long-term depression and impaired motor learning in mGluR1 mutant mice. Cell. 1994;79:377–388. doi: 10.1016/0092-8674(94)90205-4. - DOI - PubMed
    1. Berthier NE, Moore JW. Activity of deep cerebellar nuclear cells during classical conditioning of nictitating membrane extension in rabbits. Exp Brain Res. 1990;83:44–54. - PubMed
    1. Boele HJ, Koekkoek SKE, De Zeeuw CI. Cerebellar and extracerebellar involvement in mouse eyeblink conditioning: the ACDC model. Front Cell Neurosci. 2010;3:19. doi: 10.3389/neuro.03.019.2009. - DOI - PMC - PubMed
    1. Boele HJ, Koekkoek SKE, De Zeeuw CI, Ruigrok TJH. Axonal sprouting and formation of terminals in the adult cerebellum during associative motor learning. J Neurosci. 2013;33:17897–17907. doi: 10.1523/JNEUROSCI.0511-13.2013. - DOI - PMC - PubMed
    1. Boneau CA. The interstimulus interval and the latency of the conditioned eyelid response. J Exp Psychol. 1958;56:464–471. doi: 10.1037/h0044940. - DOI - PubMed

Publication types

LinkOut - more resources