. 2014 Nov 5;34(45):14934-47.
doi: 10.1523/JNEUROSCI.2289-14.2014.

Effects of luminance contrast on the color selectivity of neurons in the macaque area v4 and inferior temporal cortex

Affiliations

Effects of luminance contrast on the color selectivity of neurons in the macaque area v4 and inferior temporal cortex

Tomoyuki Namima et al. J Neurosci. .

Abstract

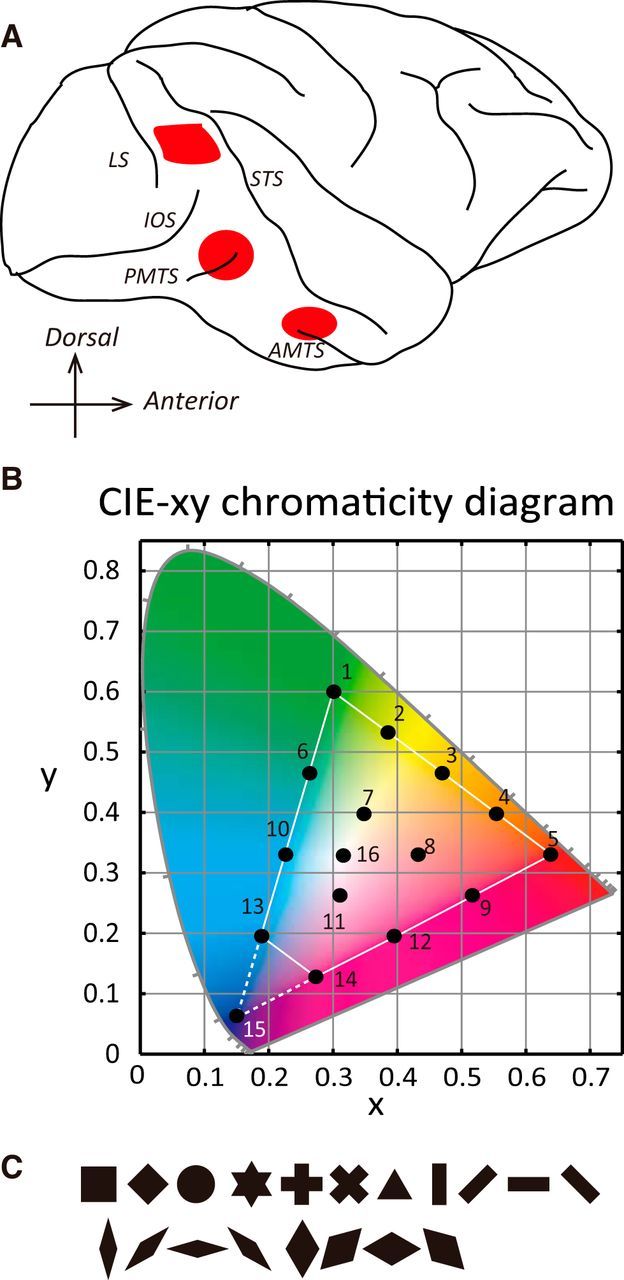
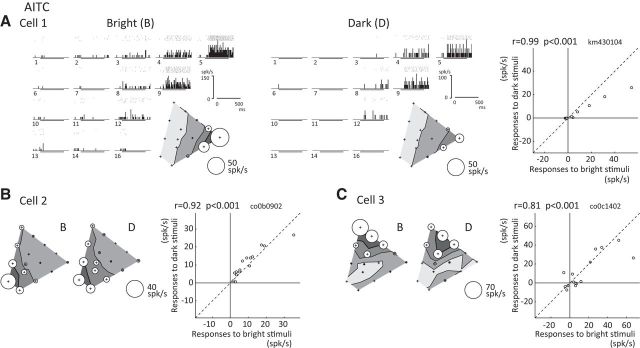
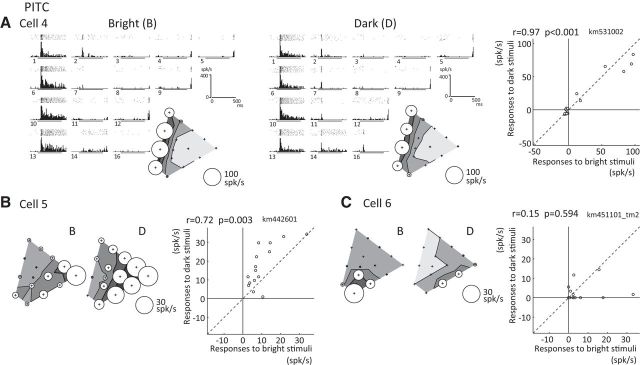
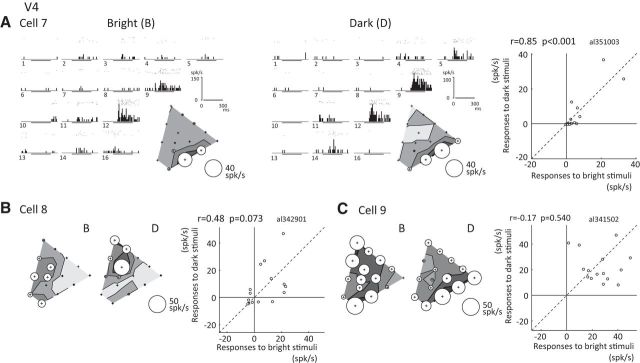
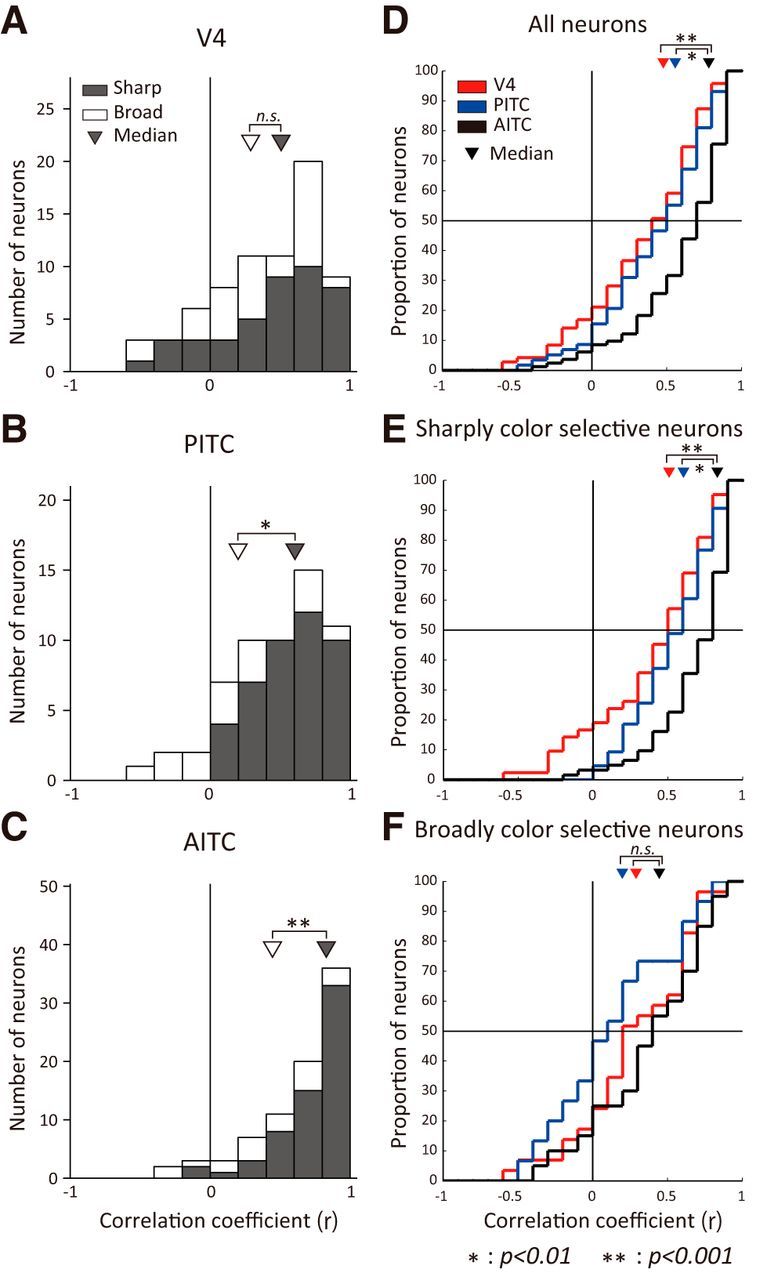
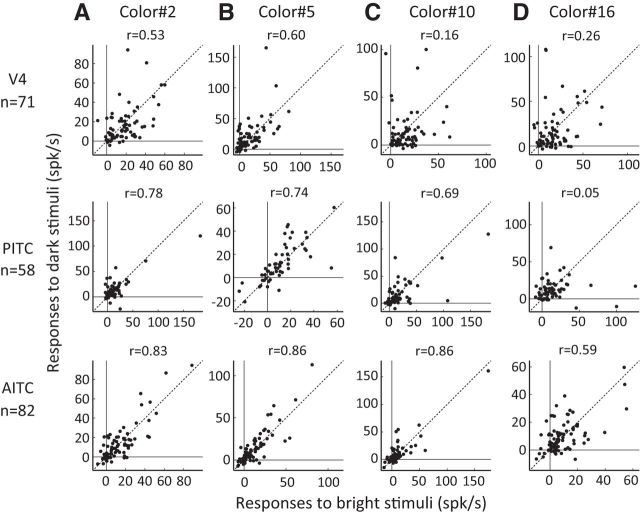
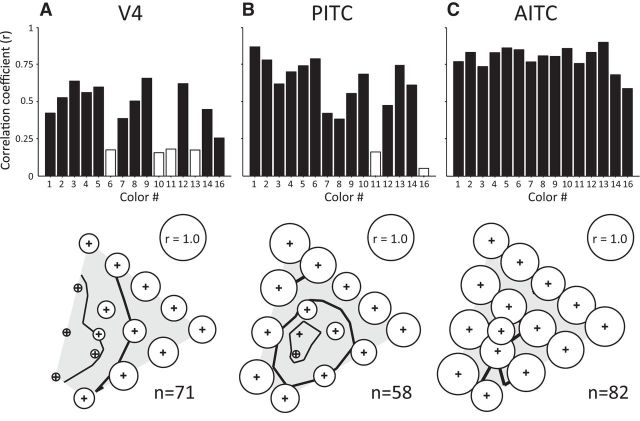
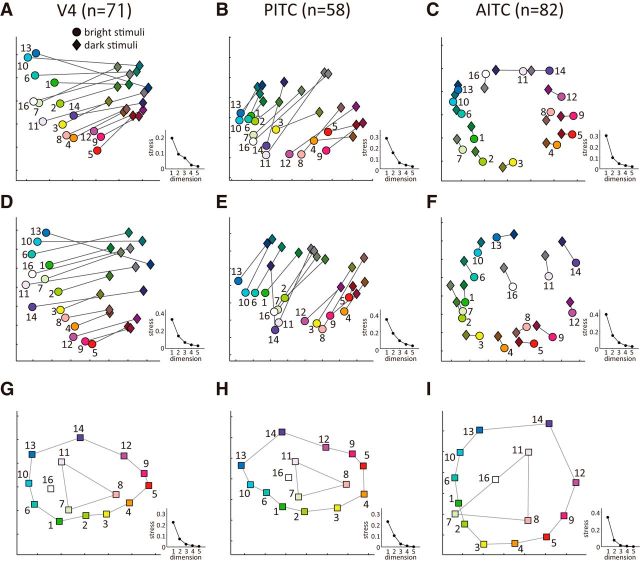
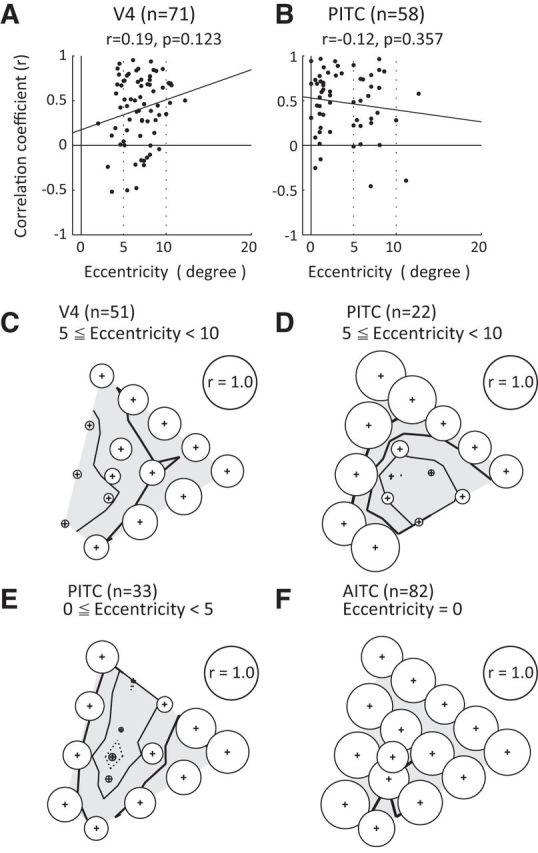
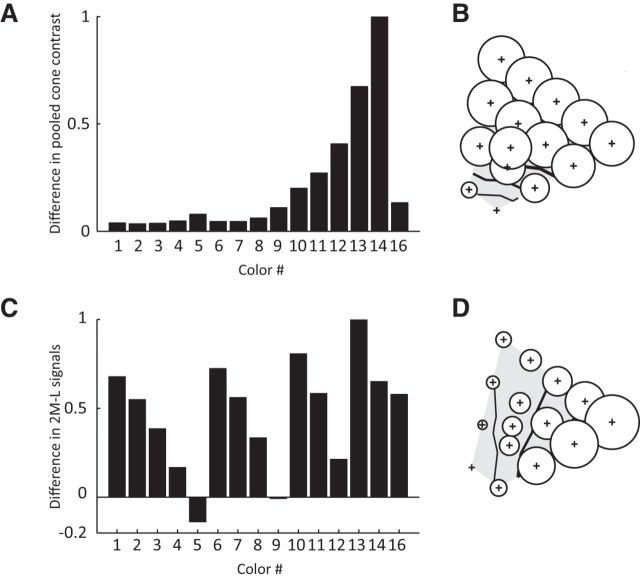
Appearance of a color stimulus is significantly affected by the contrast between its luminance and the luminance of the background. In the present study, we used stimuli evenly distributed on the CIE-xy chromaticity diagram to examine how luminance contrast affects neural representation of color in V4 and the anterior inferior temporal (AITC) and posterior inferior temporal (PITC) color areas (Banno et al., 2011). The activities of single neurons were recorded from monkeys performing a visual fixation task, and the effects of luminance contrast on the color selectivity of individual neurons and their population responses were systematically examined by comparing responses to color stimuli that were brighter or darker than the background. We found that the effects of luminance contrast differed considerably across V4 and the PITC and AITC. In both V4 and the PITC, the effects of luminance contrast on the population responses of color-selective neurons depended on color. In V4, the size of the effect was largest for blue and cyan, whereas in the PITC, the effect gradually increased as the saturation of the color stimulus was reduced, and was especially large with neutral colors (white, gray, black). The pattern observed in the PITC resembles the effect of luminance contrast on color appearance, suggesting PITC neurons are closely involved in the formation of the perceived appearance of color. By contrast, the color selectivities of AITC neurons were little affected by luminance contrast, indicating that hue and saturation of color stimuli are represented independently of luminance contrast in the AITC.

Keywords: color; extrastriate; luminance; monkey; perception.


Figures

Figure 1.
Figure 1.
Recording sites and color stimuli. A, Approximate recording sites (red marks) in a lateral view of the right hemisphere of a monkey (top, V4; middle, PITC; bottom, AITC). B, Chromaticity coordinates of the stimuli in the color stimulus set plotted on the CIE-xy chromaticity diagram. Each color stimulus set contained 16 colors, including 15 chromatic colors whose chromaticity coordinates were evenly distributed on the chromaticity diagram (colors 1–15) and one achromatic color whose chromaticity coordinate was equal to the gray background (color 16). Fifteen stimuli (all except color 15) were presented at two different luminances (bright set, 20 cd/m2; dark set, 5cd/m2). Because the luminance of blue (color 15) in the bright set was different from the other colors, we omitted responses to that color elicited in both the bright and dark sets from the quantitative analysis. The white triangle indicates the gamut of displayed colors used for the experiments. C, Nineteen geometric shapes used to test the shape selectivity (V4, 19 or 11 shapes; PITC and AITC, 11 or 7 shapes). These shapes include, from top left to bottom right, square, oblique square, circle, star, cross, oblique cross, triangle, vertical bar, oblique bar in the clockwise direction, horizontal bar, oblique bar in the counterclockwise direction, narrow diamonds and broad diamonds (vertical diamond, oblique diamond in the clockwise direction, horizontal diamond and oblique diamond in the counterclockwise direction, respectively). Each of these shape stimuli was painted uniformly with a single color. LS, Lunate sulcus; IOS, inferior occipital sulcus.
Figure 2.
Figure 2.
Responses of three example color-selective neurons recorded in the AITC. A, Responses of a neuron (Cell 1) to 15 stimuli in the bright set (left) and 15 stimuli in the dark set (middle). The response to each color is shown by rasters and PSTHs. The stimulus presentation period is indicated by a thick horizontal line below each histogram. The number at the bottom left of each histogram indicates the color ID that corresponds to the number of each color in Fig. 1B. Inset, The response magnitude to each color stimulus is represented by the diameter of a circle and is plotted at the position that corresponds to the chromaticity coordinate of that color (bubble plot). Open and solid circles indicate response increases and decreases, respectively. Contour lines in the bubble plots indicate 75%, 50%, 25%, and 0% of the maximum response, respectively. In the right panel, the scatter plot shows the relationship between the responses to the bright set (horizontal axis) and to the dark set (vertical axis). Each circle corresponds to one color. The correlation coefficient and the p-value between responses to the bright and dark sets are shown at the upper left of the plot. B, C, Responses of two other example neurons (B, Cell 2; C, Cell 3) to the bright and dark sets, and the relationship between the responses to the two sets (scatter plots). B, Bright set; D, dark set. Sparseness indices for the bright and dark sets were, respectively, 0.83 and 0.82 for Cell 1; 0.47 and 0.36 for Cell 2; and 0.63 and 0.67 for Cell 3.
Figure 3.
Figure 3.
Responses of three example color-selective neurons recorded in the PITC. A–C, Responses of three neurons (A, Cell 4; B, Cell 5; C, Cell 6) are plotted using the same format as in Fig. 2. Sparseness indices for the bright and dark sets were, respectively, 0.73 and 0.69 for Cell 4; 0.38 and 0.28 for Cell 5; and 0.74 and 0.79 for Cell 6.
Figure 4.
Figure 4.
Responses of three example color-selective neurons recorded in V4. A–C, Responses of three neurons (A, Cell 7; B, Cell 8; C, Cell 9) are plotted using the same format as in Fig. 2. Sparseness indices for the bright and dark sets were, respectively, 0.71 and 0.80 for Cell 7; 0.61 and 0.72 for Cell 8; and 0.15 and 0.21 for Cell 9.
Figure 5.
Figure 5.
Distribution of the correlation coefficients between responses to the bright and dark sets. A–C, Bar graphs show the distribution of correlation coefficients between responses to the bright and dark sets for V4 (A), PITC (B), and AITC (C) neurons. Solid bars represent neurons classified as sharply color-selective and open bars represent neurons classified as broadly color-selective (see Materials and Methods). Triangles indicate the medians of the distributions. D–F, Shown are cumulative histograms of the correlation coefficients between responses to the bright and dark sets for all neurons (D), sharply color-selective neurons (E), and broadly color-selective neurons (F). Red, blue, and black lines represent V4, PITC, and AITC neurons, respectively. Triangles indicate the medians; **p < 0.001; *p < 0.01; ns, not significant (Mann–Whitney U test).
Figure 6.
Figure 6.
Relationships between the population responses to a color stimulus in the bright set and the same color stimulus in the dark set for four example colors. The rows show the results in V4 (top), PITC (middle), and AITC (bottom). A, Scatter plots show the relationships between the population responses of color-selective neurons in each area to color 2 in the bright set (horizontal axis) and in the dark set (vertical axis). Each dot corresponds to one neuron. Diagonal lines connect the points where the responses to the stimuli in the bright and dark sets were identical. The correlation coefficient between the population responses is shown above each plot. B–D, Relationships between the population responses to color 5 (B), color 10 (C), and color 16 (D). The formats are the same as in A.
Figure 7.
Figure 7.
Correlation coefficients between the population responses to each bright stimulus and the corresponding dark stimulus for the 15 colors in the stimulus set. A–C, Top row, The height of each bar shows the correlation coefficient between the population responses to each of the 15 colors in the bright set and those to the same color in the dark set. The color ID is shown below each bar. Solid and open bars indicate significant and nonsignificant correlations, respectively. In the bottom row, the correlation coefficients are indicated by the diameters of the circles plotted at the positions corresponding to the chromaticity coordinates of each color (bubble plot). For scale, circles with diameters corresponding to r = 1.0 are shown as insets. Contour lines of decreasing thickness indicate where the correlation coefficients are 0.75, 0.50, and 0.25, respectively. The numbers of neurons included in the sample are shown at the bottom.
Figure 8.
Figure 8.
Neural representation of bright and dark colors in the activities of color-selective neurons. Shown are two-dimensional plots of the results of MDS analyses conducted for neurons recorded in V4 (A, D, G), the PITC (B, E, H), and the AITC (C, F, I). A, Results of an MDS analysis based on a neural distance matrix computed from the raw (not normalized) responses of 71 V4 neurons to 30 color stimuli (15 bright and 15 dark stimuli) were projected onto a two-dimensional plane such that the neural distances (1 − r) were preserved as accurately as possible. Circles and diamonds represent the colors in the bright and dark sets, respectively. Lines connect colors with the same chromaticity coordinates in the two sets. The scree plot at the right shows the relationship between the number of dimensions and the stress in the MDS analysis. B, C, Results of MDS analyses based on the raw responses of populations of neurons in the PITC (B) and the AITC (C), respectively. Conventions are the same as in A. D–F, Results of MDS analyses based on the normalized responses of populations of neurons in V4 (D), the PITC (E), and the AITC (F) to 30 (15 bright and 15 dark) color stimuli. Conventions are the same as in A. G–I, Results of MDS analyses based on the normalized responses of populations of neurons in V4 (G), the PITC (H), and the AITC (I) to 15 chromaticity coordinates while disregarding the luminance contrast of stimuli. Colors with high saturation and those with low saturation are separately connected by lines.
Figure 9.
Figure 9.
Relationship between stimulus position and the magnitude of the effect of luminance contrast. A, B, Relationships between the eccentricity of the RF center (horizontal axis) and the magnitude of the effect of luminance contrast (vertical axis) quantified in terms of the correlation coefficient between responses to the bright and dark sets in neurons recorded from V4 (A) and the PITC (B). C, D, Correlation coefficients between the population responses to a bright stimulus and a dark stimulus across colors for subpopulations of V4 (C) and PITC (D) neurons that had RFs with centers ranging between 5 and 10° in eccentricity. E, F, Correlation coefficients between the population responses to a bright stimulus and a dark stimulus across colors for a subpopulation of PITC neurons that had RFs whose centers ranged between 0 and 5° in eccentricity (E) and AITC neurons (F). The format for CF is the same as Figure 7, bottom.
Figure 10.
Figure 10.
Simulated pattern of the differences in cone-related signals between bright and dark stimuli. A, Differences in pooled cone contrast between bright and dark stimuli across 15 chromaticities (see Discussion). B, Simulated pattern of the differences in the responses elicited by the bright and dark sets derived using the formula 1 − (difference in the pooled cone contrast) and shown as a bubble plot. C, Differences in examples of the cone-difference signals (2M − L) between bright and dark stimuli. D, Simulated pattern of the differences between the responses elicited by bright and dark sets derived using the formula 1 − [difference in the cone-difference signal (2M − L)].

References

    1. Banno T, Ichinohe N, Rockland KS, Komatsu H. Reciprocal connectivity of identified color-processing modules in the monkey inferior temporal cortex. Cereb Cortex. 2011;21:1295–1310. doi: 10.1093/cercor/bhq211. - DOI - PubMed
    1. Berlin B, Kay P. Their University and Evolution. Berkeley: University of California; 1969. Basic color terms.
    1. Boynton RM, Olson CX. Locating basic colors in the OSA space. Color Res Appl. 1987;12:94–105. doi: 10.1002/col.5080120209. - DOI
    1. Buckley MJ, Gaffan D, Murray EA. Functional double dissociation between two inferior temporal cortical areas: perirhinal cortex versus middle temporal gyrus. J Neurophysiol. 1997;77:587–598. - PubMed
    1. Bushnell BN, Harding PJ, Kosai Y, Bair W, Pasupathy A. Equiluminance cells in visual cortical area V4. J Neurosci. 2011;31:12398–12412. doi: 10.1523/JNEUROSCI.1890-11.2011. - DOI - PMC - PubMed

Publication types

LinkOut - more resources