. 2014 Dec 1;42(21):13051-60.
doi: 10.1093/nar/gku1078. Epub 2014 Nov 5.

Optimization of transcription factor binding map accuracy utilizing knockout-mouse models

Affiliations

Optimization of transcription factor binding map accuracy utilizing knockout-mouse models

Wolfgang Krebs et al. Nucleic Acids Res. .

Abstract

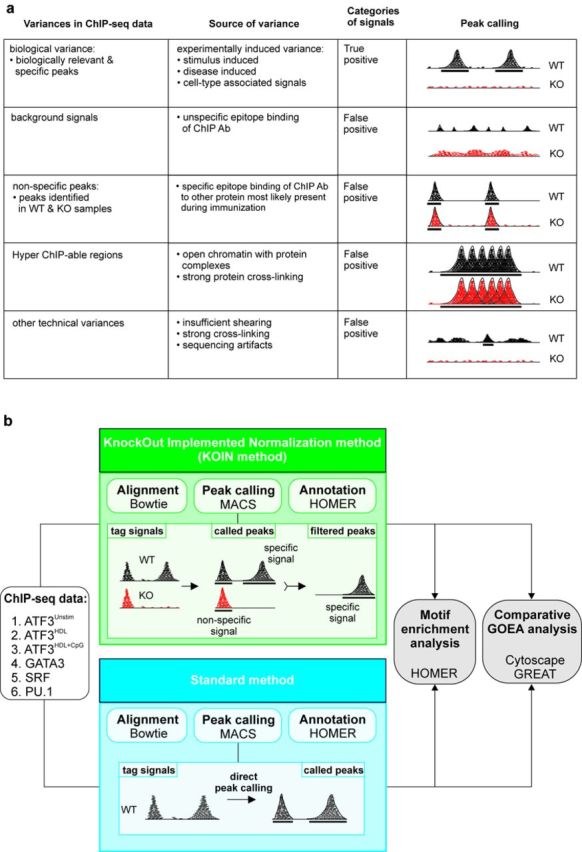
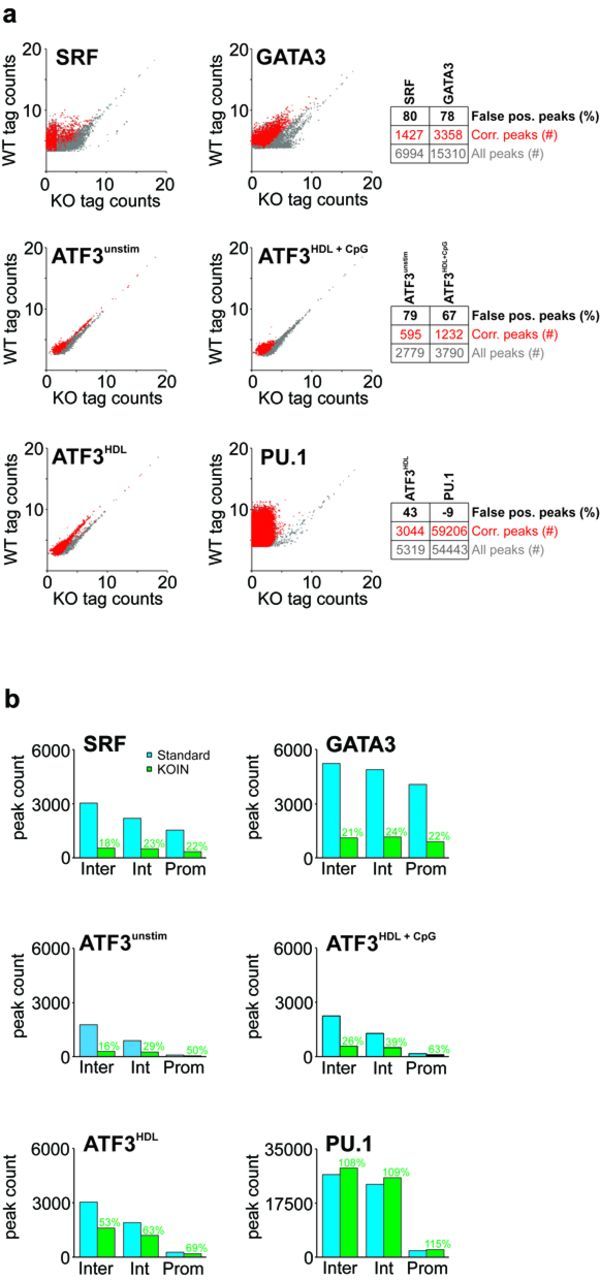
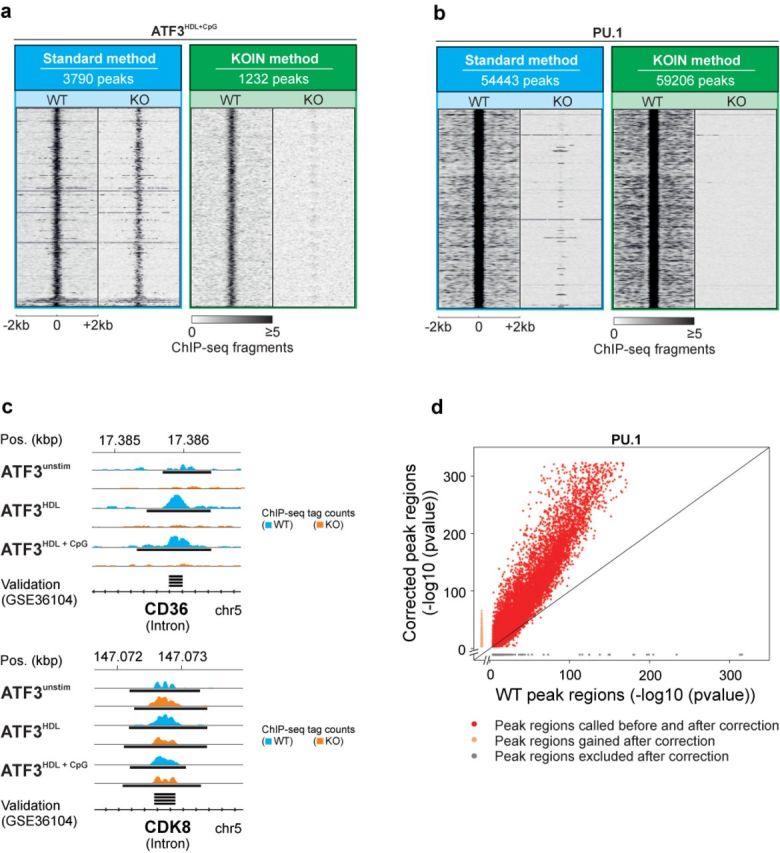
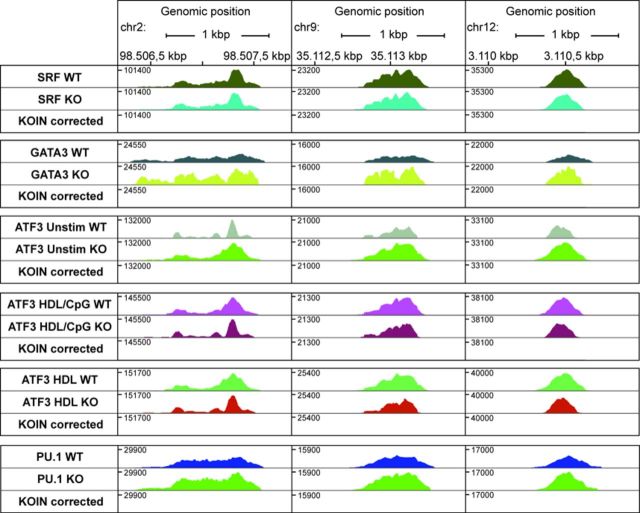
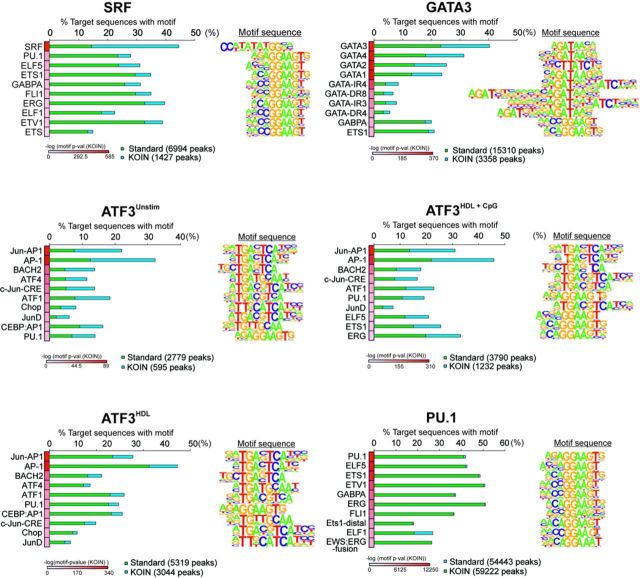
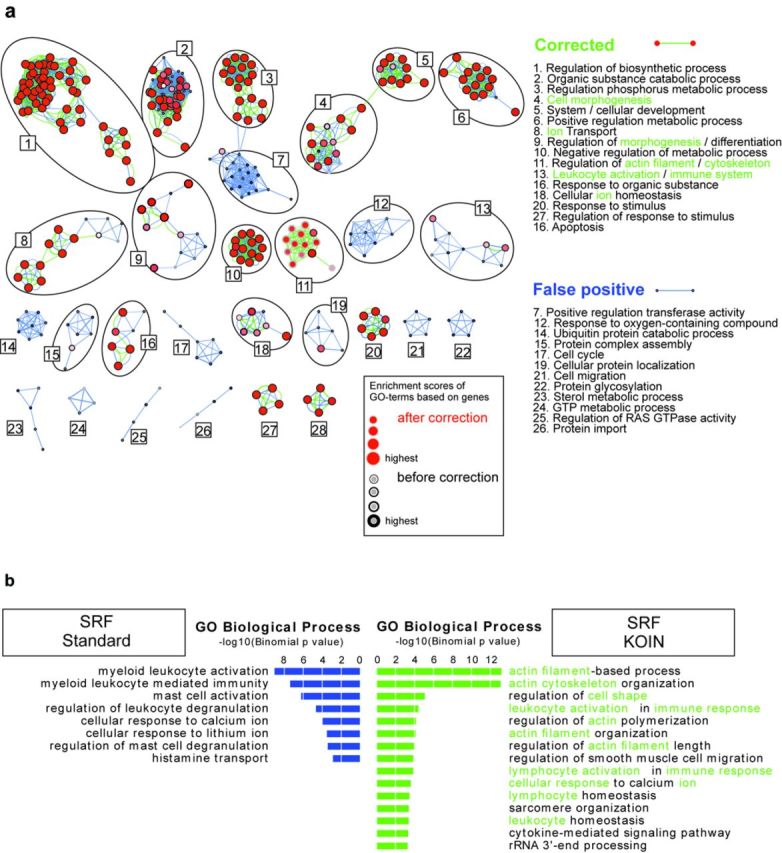
Genome-wide assessment of protein-DNA interaction by chromatin immunoprecipitation followed by massive parallel sequencing (ChIP-seq) is a key technology for studying transcription factor (TF) localization and regulation of gene expression. Signal-to-noise-ratio and signal specificity in ChIP-seq studies depend on many variables, including antibody affinity and specificity. Thus far, efforts to improve antibody reagents for ChIP-seq experiments have focused mainly on generating higher quality antibodies. Here we introduce KOIN (knockout implemented normalization) as a novel strategy to increase signal specificity and reduce noise by using TF knockout mice as a critical control for ChIP-seq data experiments. Additionally, KOIN can identify 'hyper ChIPable regions' as another source of false-positive signals. As the use of the KOIN algorithm reduces false-positive results and thereby prevents misinterpretation of ChIP-seq data, it should be considered as the gold standard for future ChIP-seq analyses, particularly when developing ChIP-assays with novel antibody reagents.


Figures

Figure 1.
Figure 1.
Sources of variance in ChIP-seq experiments and schematic overview of the KOIN method. (a) Overview of factors influencing ChIP-seq data. (b) Schema of two approaches for analysis of ChIP-seq data using either the KOIN method (KO Implemented Normalization method, in green) including knockout (KO) samples or the standard method (in blue). Next generation sequencing data were aligned to the reference genome using Bowtie; peaks were called with MACS (preferred peak caller) and annotated to the transcript database using HOMER. Results for both methods were compared during downstream data processing including motif enrichment analysis using HOMER or comparative gene ontology enrichment analysis (GOEA).
Figure 2.
Figure 2.
Global TF-binding distributions in independent ChIP-seq experiments reveal distinct false-positive signals. (a) Normalized ChIP-seq tag counts (log2 scale) for PU.1, SRF, GATA3 and ATF3 (under indicated stimulatory conditions) of uncorrected data derived from WT samples are plotted against tag counts derived from TF-KO samples (gray dots). Remaining peaks after KOIN-correction are overlaid (red dots). To avoid overlaps of a high fraction of data points Jitter was added. Numbers of total peaks, KOIN-corrected peaks and the false-positive peak rate (in percent) are presented as a table next to the dot plots. (b) Peak counts at promoter (Prom), intronic (Int) and intergenic (Inter) genomic regions are compared before (blue) and after (green) KOIN correction. Percentages of remaining peak numbers after correction (true positives) are included (green).
Figure 3.
Figure 3.
Global visualization of data set-specific effects on peak calling before and after KOIN correction. Heatmaps of normalized ChIP-seq tag counts centered at peak midpoints depicted for ± 2-kb windows for (a) ATF3 under the stimulatory influence of HDL and CpG as well as (b) PU.1 visualized for WT and KO samples separately before and after KOIN correction. A 10-bp sliding window was used to calculate tag densities and resulting numbers were normalized to 107 total tag counts. (c) Representative ChIP-seq reads in the introns of true and false-positive ATF3-binding sites. Black bars indicate significant peaks identified by MACS with P-values ≤ 10−4. An independently generated ATF3 data set (6) was used to visualize peaks called significant (black bars) in the previous study performed without the use of KO samples. (d) Peak P-values before and after KOIN correction. MACS peak P-values for WT PU.1 enriched positions (x-axis, -log10 (P-value)) are plotted against the P-values for corresponding KOIN-corrected peaks (y-axis, -log10 (P-value)); red, significantly called peaks belonging to the WT- and KOIN-corrected data sets; gray, false-positive peaks lost after KOIN correction; orange, peaks exclusively called after applying KOIN correction.
Figure 4.
Figure 4.
‘Hyper-ChIPable regions’ show extremely high ChIP-seq enrichments for all data sets. Three exemplary positions at ‘hyper-ChIPable regions’ were chosen for six ChIP-seq TF data sets (SRF, GATA3, PU.1 and ATF3 generated under different stimulatory conditions). Corresponding ChIP-seq profiles for WT and KO samples are depicted in different colors. In KOIN-corrected data sets, ‘hyper-ChIPable regions’ with corresponding tags are absent.
Figure 5.
Figure 5.
Impact of KOIN-correction on TF motif analysis. Top 10 significantly enriched TF-binding motifs in sequence elements found at SRF, PU.1, GATA3 and ATF3 binding sites were sorted according to their P-values after KOIN correction. The respective percentage of target sequences with corresponding motif are illustrated with (blue) or without (green) KOIN correction as horizontal aligned bar plots. Positional weight matrix (PWM) motif sequences are plotted at the right side of the corresponding motif. Corresponding P-values for each motif are plotted as heatmaps.
Figure 6.
Figure 6.
KOIN correction significantly changes GO-term enrichment analysis. (a) Network visualization of Gene Ontology Enrichment Analysis for genes with SRF protein binding signals located 1 kb up- and downstream from their TSS are visualized for 1510 genes before (black node borders: GO-terms, blue edges: GO-term relations) and 327 genes after the correction process (red nodes: GO-terms, green edges: GO-term relations). GO-terms correlating to genes remaining after correction procedure are depicted as red nodes with black borders. The binomial FDR corrected P-value cutoff was set to <0.001. Analysis was performed with Cytoscape and the two plugins BiNGO and Enrichment Map. (b) SRF ChIP-seq signals in cis-regulatory and noncoding genomic regions were analysed with the GREAT tool to determine biological relevance of ChIP-Seq-binding patterns. Enriched GO-terms passed threshold for FDR corrected P-values set to 0.05 with both binomial and hypergeometric tests. Depicted are the binomial P-values (-log10 (P-value)) of enriched GO-terms with (green) or without (blue) KOIN correction. Commonly found KOIN-corrected GO-terms in (a) and (b) are highlighted in green letters.

References

    1. Park P.J. ChIP-seq: advantages and challenges of a maturing technology. Nat. Rev. Genet. 2009;10:669–680. - PMC - PubMed
    1. Furey T.S. ChIP-seq and beyond: new and improved methodologies to detect and characterize protein-DNA interactions. Nat. Rev. Genet. 2012;13:840–852. - PMC - PubMed
    1. Kidder B.L., Hu G., Zhao K. ChIP-Seq: technical considerations for obtaining high-quality data. Nat. Immunol. 2011;12:918–922. - PMC - PubMed
    1. Landt S.G., Marinov G.K., Kundaje A., Kheradpour P., Pauli F., Batzoglou S., Bernstein B.E., Bickel P., Brown J.B., Cayting P., et al. ChIP-seq guidelines and practices of the ENCODE and modENCODE consortia. Genome Res. 2012;22:1813–1831. - PMC - PubMed
    1. Chen Y., Negre N., Li Q., Mieczkowska J.O., Slattery M., Liu T., Zhang Y., Kim T.K., He H.H., Zieba J., et al. Systematic evaluation of factors influencing ChIP-seq fidelity. Nat. Meth. 2012;9:609–614. - PMC - PubMed

Publication types

Substances