

The mammalian tRNA ligase complex mediates splicing of XBP1 mRNA and controls antibody secretion in plasma cells
- PMID: 25378478
- PMCID: PMC4282640
- DOI: 10.15252/embj.201490332
The mammalian tRNA ligase complex mediates splicing of XBP1 mRNA and controls antibody secretion in plasma cells
Abstract
The unfolded protein response (UPR) is a conserved stress-signaling pathway activated after accumulation of unfolded proteins within the endoplasmic reticulum (ER). Active UPR signaling leads to unconventional, enzymatic splicing of XBP1 mRNA enabling expression of the transcription factor XBP1s to control ER homeostasis. While IRE1 has been identified as the endoribonuclease required for cleavage of this mRNA, the corresponding ligase in mammalian cells has remained elusive. Here, we report that RTCB, the catalytic subunit of the tRNA ligase complex, and its co-factor archease mediate XBP1 mRNA splicing both in vitro and in vivo. Depletion of RTCB in plasma cells of Rtcb(fl/fl) Cd23-Cre mice prevents XBP1s expression, which normally is strongly induced during plasma cell development. RTCB-depleted plasma cells show reduced and disorganized ER structures as well as severe defects in antibody secretion. Targeting RTCB and/or archease thus represents a promising strategy for the treatment of a growing number of diseases associated with elevated expression of XBP1s.
Keywords: RTCB; XBP1 mRNA splicing; antibody secretion; archease; plasma cells.
© 2014 IMBA ‐ Institute of Molecular Biotechnology GmbH. Published under the terms of the CC BY 4.0 license.
Figures
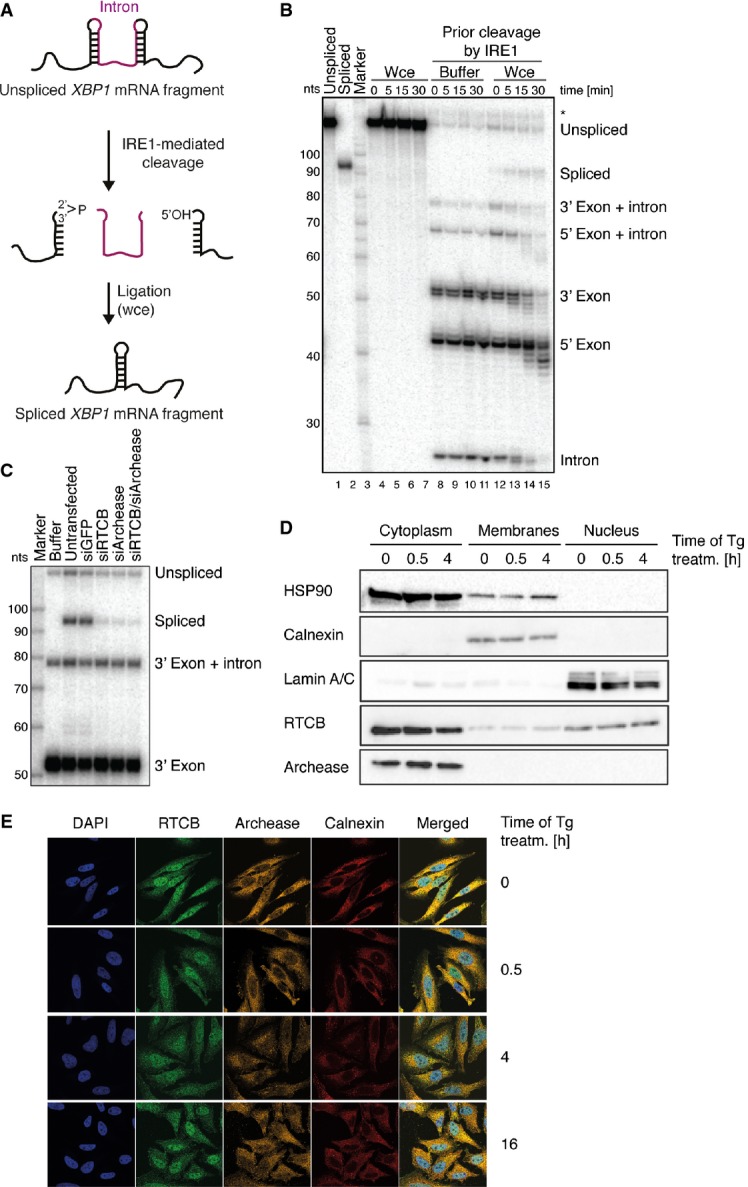
Schematic representation of the in vitro assay to monitor XBP1 mRNA splicing. A radiolabelled human XBP1 transcript encompassing the intron is pre-cleaved with recombinant, constitutively active IRE1 to form RNA fragments mimicking XBP1 mRNA exon halves. Subsequent incubation with HeLa whole-cell extracts provides the ligation activity required to convert these fragments into a single, longer species representing the spliced form of XBP1 mRNA.
An internally labeled fragment of XBP1 mRNA including the intron (lane 1) was incubated with HeLa whole-cell extracts (Wce, lanes 4–7) or pre-cleaved with recombinant IRE1 endonuclease and afterward supplemented with buffer (lanes 8–11) or Wce (lanes 12–15) for the indicated time periods. After addition of Wce, cleaved XBP1 mRNA fragments were efficiently converted into the spliced form XBP1 mRNA (compare to lane 2). A nucleotide (nt) size marker is shown in lane 3. An unspecific band is marked with an asterisk.
HeLa cells were transfected with control siRNA (siGFP) or siRNAs against RTCB, archease or both and harvested 3 days post-transfection. Whole-cell extracts were incubated with a 3′ end-labeled XBP1 mRNA pre-cleaved by recombinant IRE1 for 15 min.
Subcellular localization of RTCB and archease assessed by Western blot analysis of fractions obtained after subcellular fractionation of HeLa cells treated with 300 nM thapsigargin (Tg) for the indicated time periods. HSP90 (cytoplasm), calnexin (membranes) and lamin A/C (nucleus) were used as marker proteins for the individual fractions collected (n = 5).
Subcellular localization of RTCB and archease visualized by immunofluorescence staining of HeLa cells treated with 300 nM Tg for the indicated time periods. The nucleus is visualized by DAPI staining. Calnexin staining is used to mark the ER membrane (n = 4).
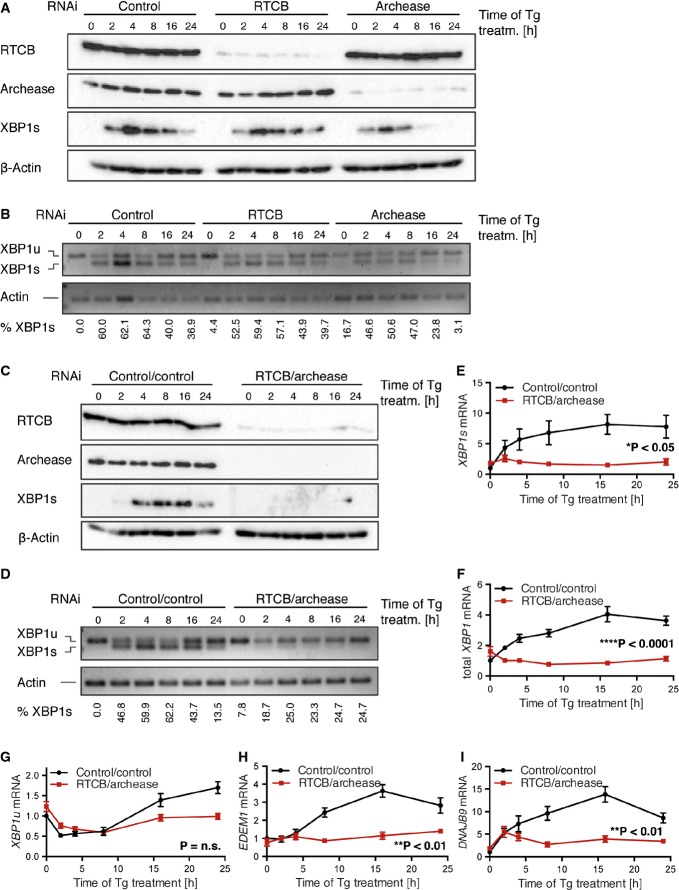
A, B Tetracycline-inducible (Tet-ON) HeLa cells were incubated with 1 μg/ml doxycycline (Dox) for six consecutive days to stimulate expression of shRNAs targeting RTCB, archease or non-targeting control followed by treatment with 300 nM Tg for the indicated time periods. Induction of XBP1s (XBP1 spliced) expression was monitored by Western blot (A) and RT–PCR (B) analysis. The relative contribution of XBP1s mRNA to total levels of XBP1 mRNA was analyzed by densitometry (n = 3).
C, D Tet-ON HeLa cells expressing shRNAs targeting RTCB and archease or a control cell line expressing two copies of the control shRNA were treated and analyzed as in (A, B) (n = 5).
E–I Tet-ON HeLa cells expressing shRNAs targeting RTCB and archease or a control cell line expressing two copies of the control shRNA were treated with Dox (1 μg/ml, 6 days) and Tg (300 nM, 24-h time course). Relative mRNA levels of XBP1s and XBP1u as well as total XBP1 mRNA and induction of EDEM1 and DNAJB9 mRNA were analyzed by RT–qPCR (n = 5, mean expression levels and SEM are displayed). Expression levels were normalized to ACTB mRNA levels and to the untreated control sample. Two-way ANOVA was used to analyze the statistical significance of differences in mRNA levels between control and RTCB/archease-depleted cells (*P < 0.05, **P < 0.01, ***P < 0.001, ****P < 0.0001).
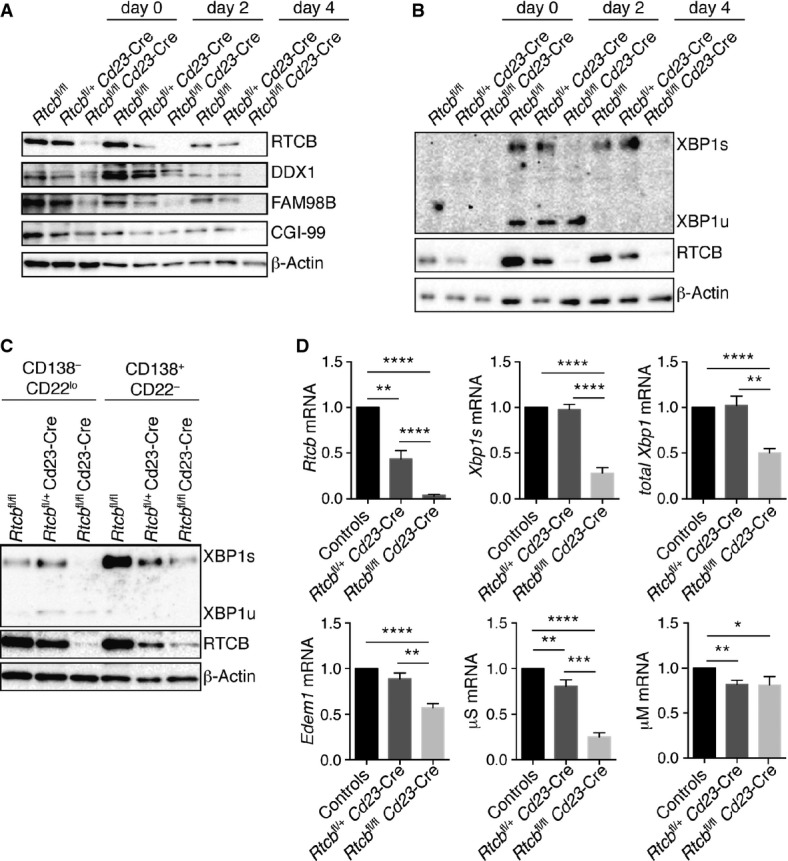
A, B Protein levels of RTCB, tRNA ligase complex members (DDX1, FAM98B, CGI-99) and XBP1 were monitored by Western blot analysis (n > 3).
C FACS-sorted CD138+ CD22− plasmablasts or CD138− CD22low pre-plasmablasts were probed for expression of the indicated proteins by Western blot analysis (n = 2).
D Relative mRNA levels of Rtcb, Xbp1s, total Xbp1, Edem1, μM and μS were analyzed by RT–qPCR in fractionated LPS-stimulated cells at day 4 (n = 4, mean expression levels and SEM are displayed). Expression levels were normalized to Actb mRNA levels and to B cells from control mice. An unpaired Student's t-test was used to analyze the statistical significance of differences in mRNA levels (*P < 0.05, **P < 0.01, ***P < 0.001, ****P < 0.0001).
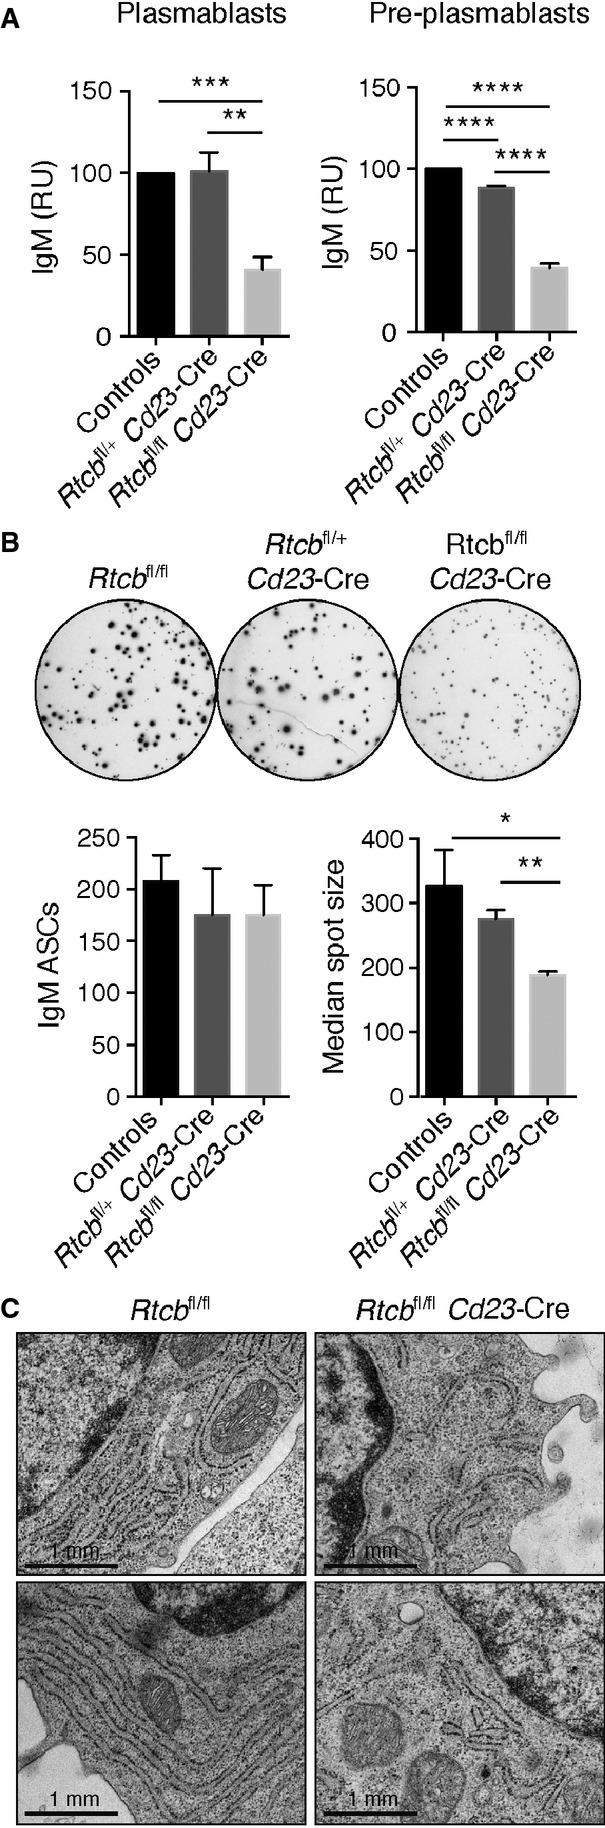
IgM ELISA. Identical numbers of FACS-sorted CD138+ CD22− plasmablasts or CD138− CD22low pre-plasmablasts of the indicated genotypes were plated for 24 h prior to ELISA analysis of their supernatants. The data are presented as relative units (RU) compared to control cells (n = 4, mean and SEM are displayed). An unpaired Student's t-test was used to analyze the statistical significance (**P < 0.01, ***P < 0.001, ****P < 0.0001).
IgM ELISPOT analysis. FACS-sorted CD138+ CD22− plasmablasts (500 cells) were plated for 16–18 h. A representative assay is shown in the top panel. Bar diagrams in the low panel show the average number of IgM-secreting cells and their median spot size (measured in pixels), respectively (n = 4 mean and SEM are displayed). An unpaired Student's t-test was used to analyze the statistical significance (*P < 0.05, **P < 0.01).
Plasmablasts were analyzed by electron microscopy. Representative plasmablasts of the indicated genotypes are shown.
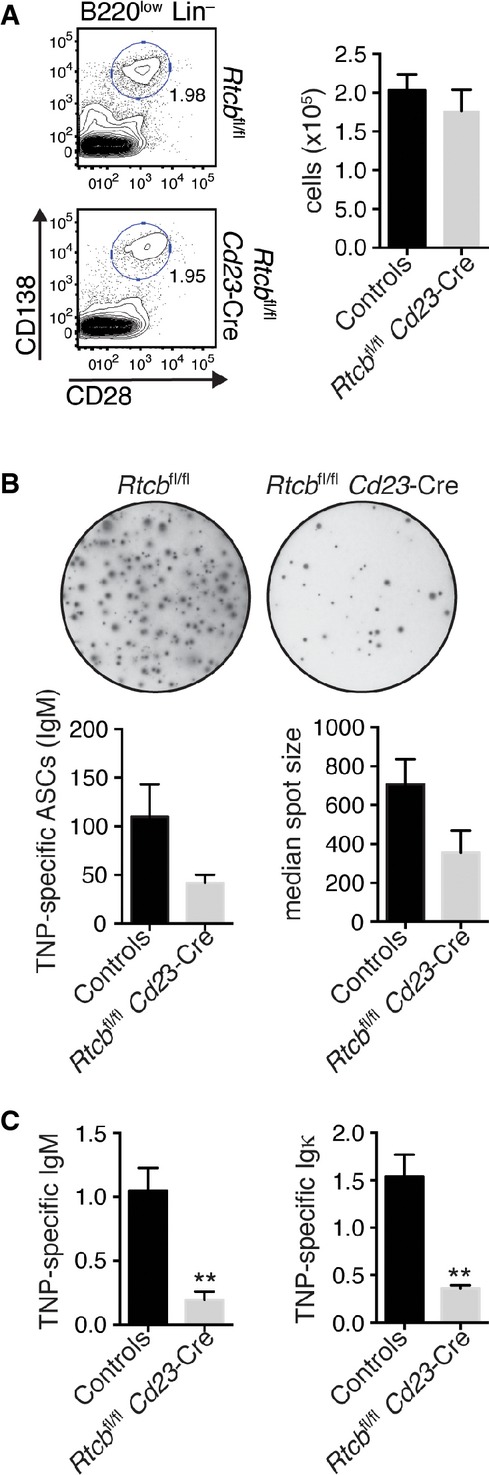
Plasma cell numbers in the spleen were determined by flow cytometry. Representative contour plots are shown. Bar diagrams represent total plasma cell numbers (n = 4, mean and SEM are displayed). Plasma cells were defined as CD28+ CD138+ B220low Lin− (CD4− CD8− CD21− F4/80−).
IgM ELISPOT analysis of MACS-enriched CD138+ cells after plating identical numbers for 16–18 h. A representative assay is shown in the upper panel. Bar diagrams show the average number of IgM-secreting cells and their median spot size (measured in pixels), respectively (n = 3 mean and SEM are displayed).
The serum titers of TNP-specific IgM and Igκ were determined by ELISA (n = 4 mean and SEM are displayed). An unpaired Student's t-test was used to analyze the statistical significance of differences (**P < 0.01).
Comment in
-
Making ends meet: a role of RNA ligase RTCB in unfolded protein response.EMBO J. 2014 Dec 17;33(24):2887-9. doi: 10.15252/embj.201490425. Epub 2014 Nov 17. EMBO J. 2014. PMID: 25404664 Free PMC article.
References
-
- Apostol BL, Westaway SK, Abelson J, Greer CL. Deletion analysis of a multifunctional yeast tRNA ligase polypeptide. Identification of essential and dispensable functional domains. J Biol Chem. 1991;266:7445–7455. - PubMed
-
- Benhamron S, Hadar R, Iwawaky T, So JS, Lee AH, Tirosh B. Regulated IRE1-dependent decay participates in curtailing immunoglobulin secretion from plasma cells. Eur J Immunol. 2013;44:867–876. - PubMed
-
- Carrasco DR, Sukhdeo K, Protopopova M, Sinha R, Enos M, Carrasco DE, Zheng M, Mani M, Henderson J, Pinkus GS, Munshi N, Horner J, Ivanova EV, Protopopov A, Anderson KC, Tonon G, DePinho RA. The differentiation and stress response factor XBP-1 drives multiple myeloma pathogenesis. Cancer Cell. 2007;11:349–360. - PMC - PubMed
-
- Chapman MA, Lawrence MS, Keats JJ, Cibulskis K, Sougnez C, Schinzel AC, Harview CL, Brunet JP, Ahmann GJ, Adli M, Anderson KC, Ardlie KG, Auclair D, Baker A, Bergsagel PL, Bernstein BE, Drier Y, Fonseca R, Gabriel SB, Hofmeister CC, et al. Initial genome sequencing and analysis of multiple myeloma. Nature. 2011;471:467–472. - PMC - PubMed
-
- Chen X, Iliopoulos D, Zhang Q, Tang Q, Greenblatt MB, Hatziapostolou M, Lim E, Tam WL, Ni M, Chen Y, Mai J, Shen H, Hu DZ, Adoro S, Hu B, Song M, Tan C, Landis MD, Ferrari M, Shin SJ, et al. XBP1 promotes triple-negative breast cancer by controlling the HIF1alpha pathway. Nature. 2014;508:103–107. - PMC - PubMed
Publication types
MeSH terms
Substances
LinkOut - more resources
Full Text Sources
Other Literature Sources
Molecular Biology Databases
Research Materials
