. 2014 Dec 15;193(12):5827-34.
doi: 10.4049/jimmunol.1302060. Epub 2014 Nov 5.

CD4 T cells specific for a latency-associated γ-herpesvirus epitope are polyfunctional and cytotoxic

Affiliations

CD4 T cells specific for a latency-associated γ-herpesvirus epitope are polyfunctional and cytotoxic

Michael L Freeman et al. J Immunol. .

Abstract

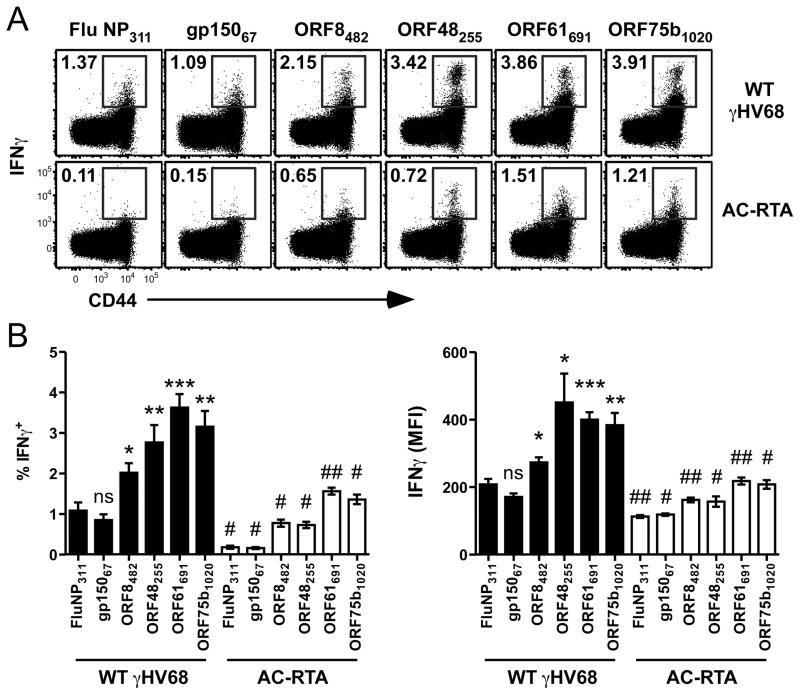
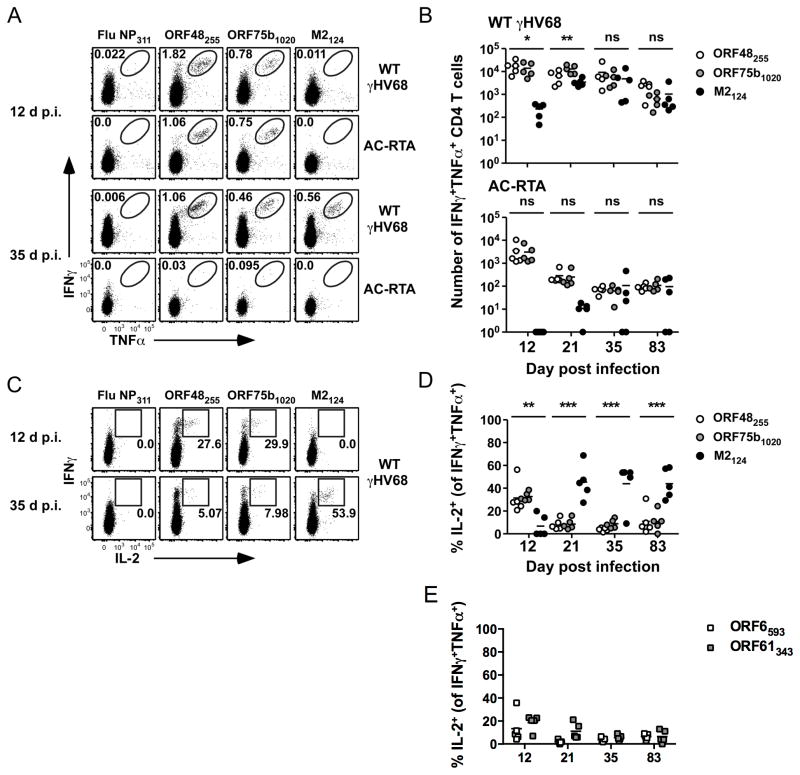
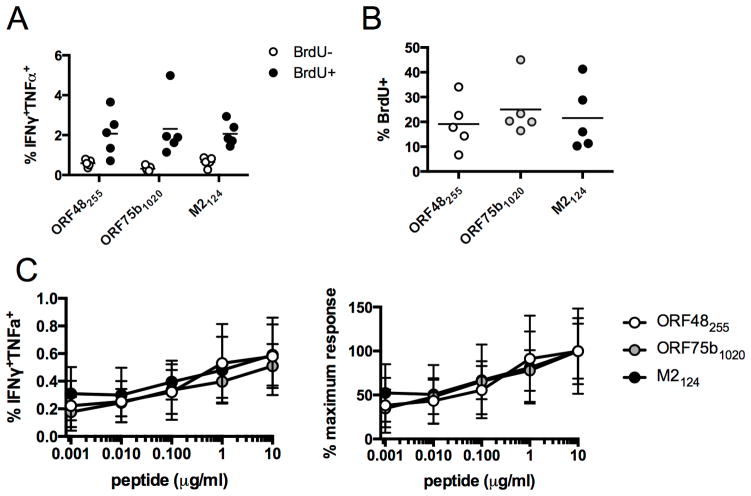
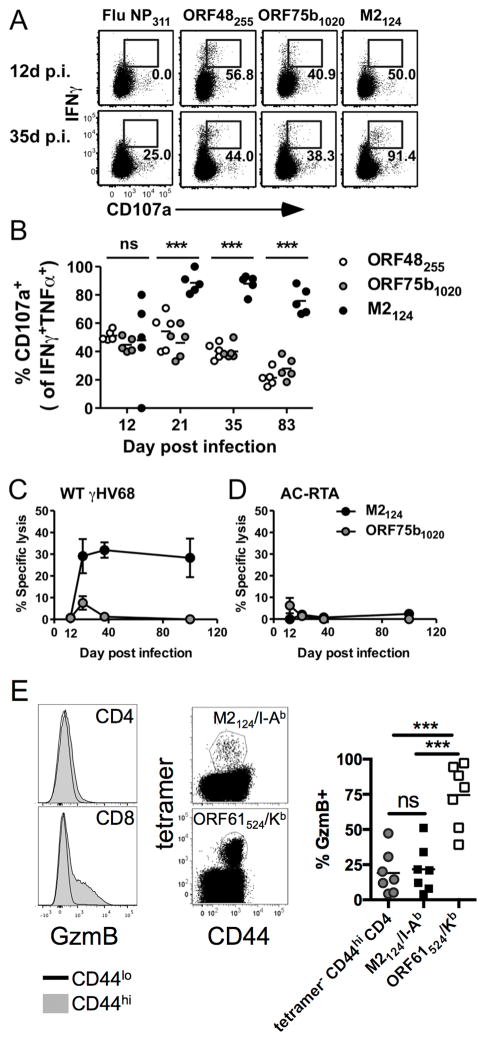
The oncogenic γ-herpesviruses EBV and Kaposi sarcoma-associated herpesvirus are ubiquitous human pathogens that establish lifelong latent infections maintained by intermittent viral reactivation and reinfection. Effector CD4 T cells are critical for control of viral latency and in immune therapies for virus-associated tumors. In this study, we exploited γHV68 infection of mice to enhance our understanding of the CD4 T cell response during γ-herpesvirus infection. Using a consensus prediction approach, we identified 16 new CD4 epitope-specific responses that arise during lytic infection. An additional epitope encoded by the M2 protein induced uniquely latency-associated CD4 T cells, which were not detected at the peak of lytic infection but only during latency and were not induced postinfection with a latency-deficient virus. M2-specific CD4 T cells were selectively cytotoxic, produced multiple antiviral cytokines, and sustained IL-2 production. Identification of latency-associated cytolytic CD4 T cells will aid in dissecting mechanisms of CD4 immune control of γ-herpesvirus latency and the development of therapeutic approaches to control viral reactivation and pathology.


Conflict of interest statement

Disclosure Statement

The authors have no financial conflicts of interest.

Figures

Figure 1
Figure 1. Robust IFNγ production by novel epitope-specific CD4 T cell responses
(A) IFNγ production by CD4 T cells at 12, 21, and 60 d p.i. with WT γHV68 (top) or AC-RTA (bottom). (B) IFNγ production by CD4 T cells after stimulation with the M2124-138 peptide after infection with WT γHV68 or AC-RTA. The dotted lines are at 30 spots above background. Samples were run in duplicate and are from at least 2 experiments per time point.
Figure 2
Figure 2. Epitope-specific IFNγ production
(A) Representative dot plots showing IFNγ production and CD44 expression by splenic CD4 T cells measured by intracellular cytokine assay 12 d after WT γHV68 (top row) or AC-RTA (bottom row) infection (n=5, representative of 2 experiments). (B) The percent of CD4 T cells that are IFNγ+ (left) or the mean fluorescence intensity (MFI) of IFNγ expression by CD4 T cells (right) in the spleen 12 d after WT γHV68 or AC-RTA infection (n=5, representative of 4 experiments; ns, not significant; *P≤0.05; **P≤0.01; ***P≤0.001; Student’s t test, compared to control values; #P≤0.01; ##P≤0.001; Student’s t test, compared AC-RTA to WT values).
Figure 3
Figure 3. Epitope-specific CD4 T cells are polyfunctional
(A) Representative dot plots showing IFNγ and TNFα production by lung CD4 T cells at 12 or 35 d after WT γHV68 or AC-RTA infection. Numbers in the plots indicate the percent of CD4 T cells in the gate. (B) The number of IFNγ+TNFα+ CD4 T cells in the lungs over time after WT γHV68 or AC-RTA infection (n=5, representative of 4 experiments; ns, not significant; *P≤0.05; **P≤0.01; one-way ANOVA). (C) Representative dot plots showing IFNγ and IL-2 production by CD4 T cells at 12 days or 35 days after WT γHV68 infection. Numbers in the plots indicate the percent of IFNγ+TNFα+ CD4 T cells expressing IL-2. (D, E) The percent of IFNγ+TNFα+ CD4 T cells that are IL-2+ in the lungs specific for the indicated antigens over time after WT γHV68 infection (n=5, representative of 4 experiments; **P≤0.01; ***P≤0.001; one-way ANOVA).
Figure 4
Figure 4. Proliferation of cytokine-expressing antiviral CD4 T cells
(A, B) At 56 d p.i. mice were treated with BrdU in their drinking water for 4 d. (A) The percent of BrdU+ or BrdU CD44hi CD4 T cells that are IFNγ+TNFα+. (B) The percent of IFNγ+TNFα+ CD4 T cells that are BrdU+. (C) IFNγ and TNFα co-expression following stimulation with varying concentrations of ORF48255, ORF75b1020, or M2124 epitopes. Data shown are raw values (left graph) or expressed as the percentage of the 10 μg/ml value (right graph) (n=5/epitope, representative of 2 experiments).
Figure 5
Figure 5. M2124-138-specific CD4 T cells are cytotoxic
(A) Representative dot plots showing IFNγ production and CD107a expression by lung CD4 T cells at 12 or 35 d after WT γHV68 infection. Numbers in the plots indicate the percent of IFNγ+TNFα+ CD4 T cells expressing CD107a. (B) The percent of IFNγ+TNFα+ CD4 T cells that are CD107a+ in the lungs over time after WT γHV68 infection (n=5, representative of 4 experiments; ns, not significant; ***P≤0.001; one-way ANOVA). (C) Specific lysis of peptide-pulsed target cells (±SEM) in WT γHV68-infected mice (n=4–9, combined from 2 experiments). (D) Specific lysis of peptide-pulsed target cells (±SEM) in AC-RTA-infected mice (n=5–7, combined from 2 experiments). (E) 21 d after WT γHV68 infection spleens were harvested and analyzed by flow cytometry. (left) Representative histograms showing granzyme B (GzmB) expression in CD44hi or CD44lo CD4 (top) or CD8 T cells (bottom). (center) Representative dot plots showing expression of CD44 and either M2124-138/I-Ab (top) or ORF61524-531/Kb (bottom) tetramers. (right) The percent of cells expressing granzyme B. (n=7, representative of 3 experiments; ns, not significant; ***P≤0.001; one-way ANOVA).

References

    1. Stevenson PG, Efstathiou S, Doherty PC, Lehner PJ. Inhibition of MHC class I-restricted antigen presentation by gamma 2-herpesviruses. Proc Natl Acad Sci U S A. 2000;97:8455–8460. - PMC - PubMed
    1. Blackman MA, Flano E, Usherwood E, Woodland DL. Murine gamma-herpesvirus-68: a mouse model for infectious mononucleosis? Mol Med Today. 2000;6:488–490. - PubMed
    1. Martorelli D, Muraro E, Merlo A, Turrini R, Rosato A, Dolcetti R. Role of CD4+ cytotoxic T lymphocytes in the control of viral diseases and cancer. Int Rev Immunol. 2010;29:371–402. - PubMed
    1. Paludan C, Munz C. CD4+ T cell responses in the immune control against latent infection by Epstein-Barr virus. Curr Mol Med. 2003;3:341–347. - PubMed
    1. Heller KN, Arrey F, Steinherz P, Portlock C, Chadburn A, Kelly K, Munz C. Patients with Epstein Barr virus-positive lymphomas have decreased CD4(+) T-cell responses to the viral nuclear antigen 1. Int J Cancer. 2008;123:2824–2831. - PMC - PubMed

Publication types

MeSH terms