. 2014 Nov 7;346(6210):1257521.
doi: 10.1126/science.1257521. Epub 2014 Nov 6.

Principles of ER cotranslational translocation revealed by proximity-specific ribosome profiling

Affiliations

Principles of ER cotranslational translocation revealed by proximity-specific ribosome profiling

Calvin H Jan et al. Science. .

Abstract

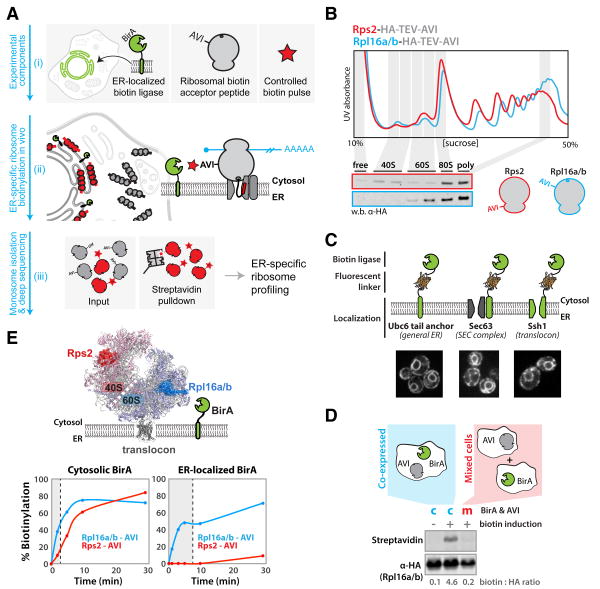
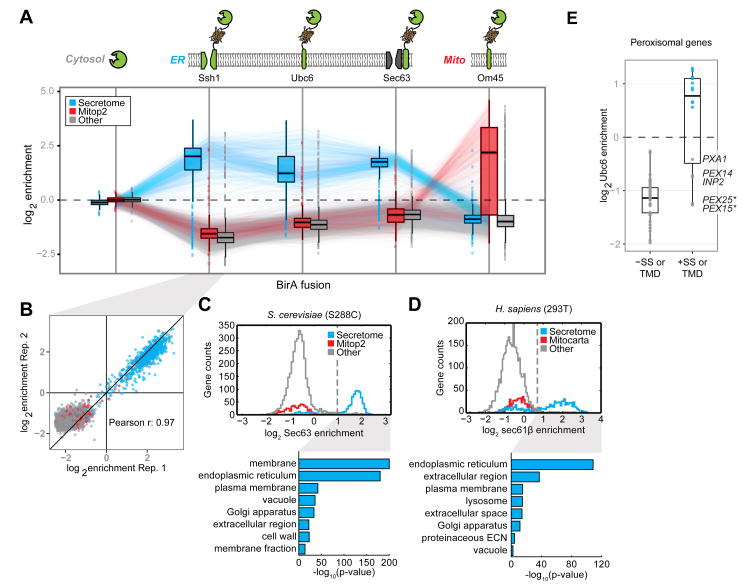
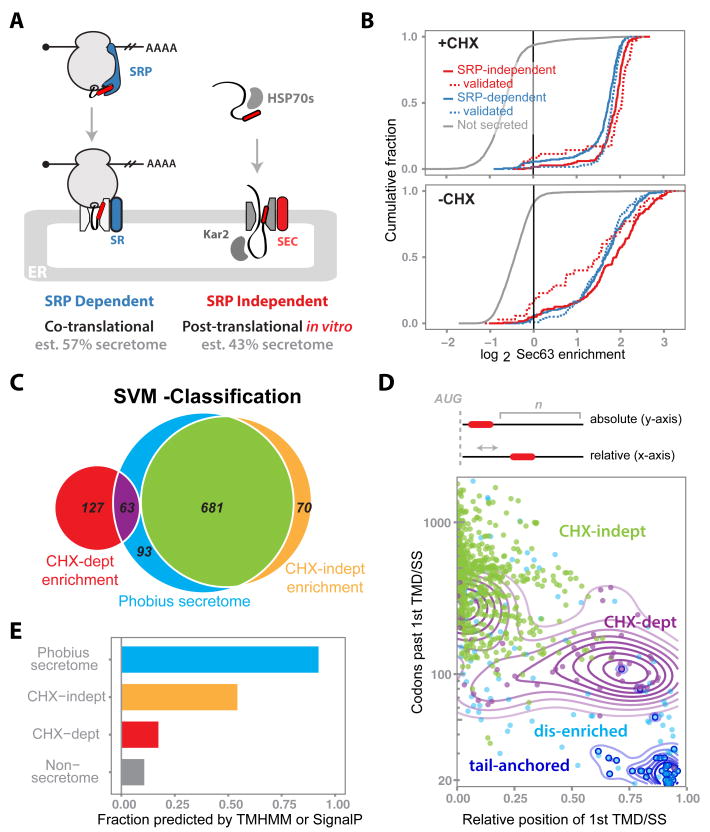
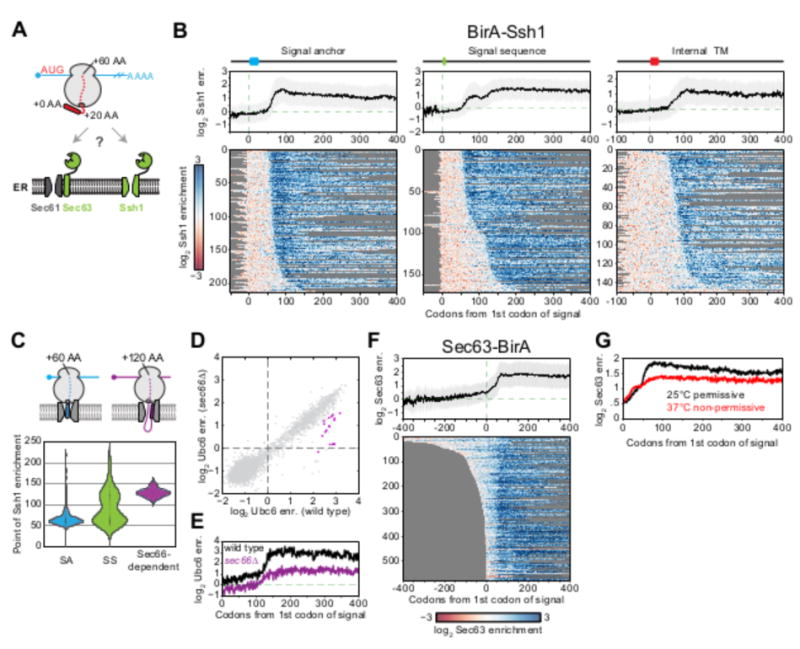
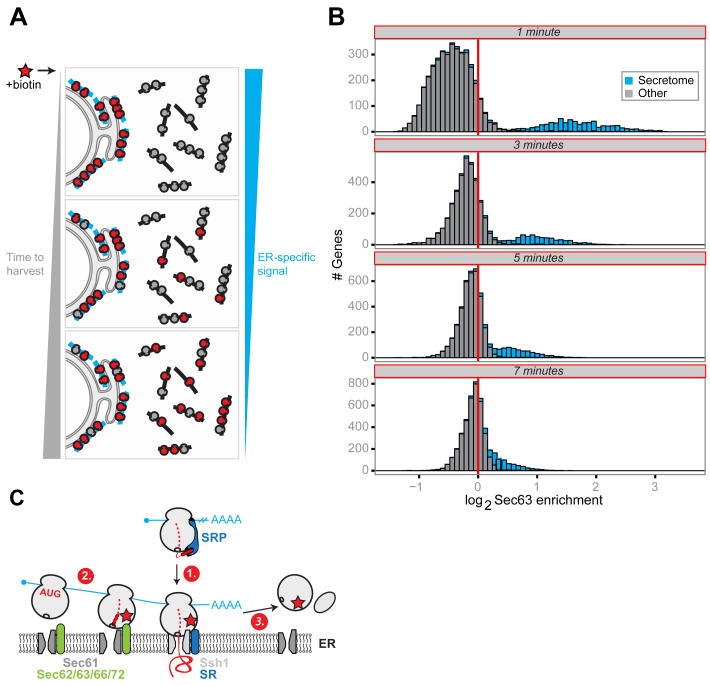
Localized protein synthesis is a fundamental mechanism for creating distinct subcellular environments. Here we developed a generalizable proximity-specific ribosome profiling strategy that enables global analysis of translation in defined subcellular locations. We applied this approach to the endoplasmic reticulum (ER) in yeast and mammals. We observed the large majority of secretory proteins to be cotranslationally translocated, including substrates capable of posttranslational insertion in vitro. Distinct translocon complexes engaged nascent chains at different points during synthesis. Whereas most proteins engaged the ER immediately after or even before signal sequence (SS) emergence, a class of Sec66-dependent proteins entered with a looped SS conformation. Finally, we observed rapid ribosome exchange into the cytosol after translation termination. These data provide insights into how distinct translocation mechanisms act in concert to promote efficient cotranslational recruitment.


Figures

Fig. 1
Fig. 1. A system for in vivo proximity-dependent ribosome biotinylation to monitor local protein synthesis at the ER
(A) Schematic for proximity-specific ribosome profiling (i) The Escherichia coli biotin ligase BirA is localized to a subcellular site of interest in cells expressing an Avi-tagged ribosomal protein and grown in low-biotin conditions (ii) A biotin pulse is applied resulting in specific biotinylation of ribosomes in close physical proximity to the localized BirA (iii) Ribosome profiling of paired input (gray and red) and isolated biotinylated (red) monosomes reveals codon-resolved translational enrichment specific to the BirA locale. (B) Fractionation of yeast lysates derived from strains containing scarless C-terminal Rps2 or Rpl16a/b hemagglutinin (HA)-TEV-AviTags on 10 to 50% sucrose gradients. Polysome traces demonstrate proper ribosomal assembly and incorporation of tags into polysomes demonstrates their non-perturbative nature. (C) ER localization of BirA fusion proteins used in this study. BirA-mVenus-Ubc6, Sec63-mVenus-BirA and BirA-mVenus-Ssh1 all localize to the perinuclear and cortical ER. (D) Western blot analysis demonstrates that biotinylation of ribosomal AviTags does not occur before the addition of excess biotin or post lysis in our assay. (E) Biotinylation kinetics of 40S and 60S AviTags by BirAs localized to the cytosol or ER (Sec63). Favorable kinetics were achieved independent of localization, and preferential 60S biotinylation demonstrates the specificity of the ER-localized ligase for oriented ER ribosomes. Shaded regions indicate biotinylation times used in subsequent sequencing experiments.
Fig. 2
Fig. 2. Specificity of proximity-dependent ribosome profiling across multiple systems
(A) Boxplots of the log2 enrichment distributions for secretome (blue), curated mitochondrial (red), and all other (gray) gene categories obtained from proximity-specific ribosome profiling experiments in yeast using different BirA fusions. Biotinylation was carried out in the presence of CHX for 2 min (cytosolic, mitochondria) or 7 min (ER). Enrichments were computed for each reliably expressed gene as the log2 ratio of biotinylated footprint density (RPM) over the corresponding density from the matched input whole-cell ribosome profiling experiment. Where possible, lines connect the same gene across experiments. (B) Enrichments shown for representative proximity-specific ribosome profiling replicates using the BirA-Ssh1 fusion protein. Colors match those in (A). (C) Histograms of log2 enrichments for Sec63-BirA in yeast. Enrichment thresholds were determined by receiver operating characteristic (ROC) analysis (fig. S5). Shown below are the corresponding enrichment analyses of GO-slim cellular components for robustly enriched genes versus expressed genes. Colors match those in (A). (D) As in (C) for BirA-Sec61β in HEK293T cells. Additionally, GO-term analysis of dis-enriched secretome genes versus expressed secretome genes is shown. (E) Gene enrichments obtained with the general BirA-Ubc6 ER marker in yeast, for well-expressed CHX-independent peroxisomal genes. SS and TMD annotations were predicted by SignalP and TMHMM, respectively. * denotes necessarily post-translational tail-anchor TMDs [see (18)].
Fig. 3
Fig. 3. Global characterization of co- versus posttranslational translocation in vivo
(A) Overview of current models for SRP-dependent and -independent targeting to and translocation into the ER. Predictions for the proportion of substrates that partition between pathways are taken from (21). (B) Cumulative distribution of the Sec63-BirA log2 enrichments for SRP-dependent (blue), SRP independent (red), and nonsecreted (gray) genes with or without CHX. Biochemically validated genes (dashed lines) were consolidated from (21) and (25). (C) Venn diagram summarizing the SVM classifications for CHX dependence in the context of the Phobius-predicted secretome. The Sec63-BirA +CHX enrichment profile was fit as a mixture of two normal distributions, and all genes enriched above the 99th percentile of the dis-enriched distribution were classified by the SVM. (D) Number of codons downstream of the first hydrophobic domain of Phobius-secretome genes versus the position of this domain relative to overall gene length, plotted for genes in different SVM-classified enrichment categories. Contour lines are added for specific gene sets for visual clarity and represent Gaussian density fits of the corresponding points in that set. Colors match those in (C) with the tail-anchored genes (dark-blue) overlaid as open circles. (E) Proportion of genes for which a hydrophobic feature was predicted by either TMHMM or SignalP, for different gene categories. Colors and gene sets match those in (C) with the addition of nonsecretome genes (gray), as predicted by Phobius.
Fig. 4
Fig. 4. Timing and specificity of cotranslational targeting to the ER
(A) Schematic of the yeast translocon-specific BirAs used to examine ribosome accessibility at two translocational entry points into the ER. (B) Metagene plots of log2 BirA-Ssh1 enrichment per codon (mean ± SD) as a function of ribosome position relative to the first codon of the first Phobius-predicted hydrophobic element for the indicated signal class. Heat maps below represent single-gene positional enrichments used to derive the corresponding averaged metagene plot, sorted by increasing distance to the point at which enrichment occurs. (C) Violin plot showing the distribution of the point of enrichment for BirA-Ssh1 relative to the first hydrophobic element, for different types of hydrophobic features and Sec66-dependent genes as defined in (D). Shown above are two RNC conformations consistent with nascent chain lengths. (D) Gene enrichments obtained with the general BirA-Ubc6 ER marker in yeast in wild-type versus sec66Δ backgrounds. Sec66-dependent genes are defined in fig. S11. (E) Metagene plot as in (B) of log2 BirA-Ubc6 enrichments for Sec66-dependent genes in wild-type (black) and sec66Δ (purple) backgrounds. (F) Metagene plot as in (B) of log2 Sec63-BirA enrichments. (G) Meta-gene plot of log2 enrichments as in (F) in a sec65-1 SRP temperature sensitive background at the permissive (25°C, black) and non-permissive (37°C, red) temperatures.
Fig. 5
Fig. 5. Dynamics of ER-associated ribosomes in vivo
(A) Overview of the pulse labeling experiment to assay the kinetics of ribosome exchange from the ER in vivo. (B) Histograms of log2 Sec63-BirA enrichment values for well-expressed secretome (blue) and all other (gray) genes over the exchange time course. Times represent the total time of ribosome biotinylation in the absence of CHX. (C) Working model consistent with the positional enrichments observed for the translocon-specific BirAs and ribosome recycling. (1) Initial recruitment to the ER depends on a fully accessible signal sequence. (2) Ribosomes translating ER-tethered mRNAs can interact with SEC early. (3) Upon termination, ribosomes recycle into the cytosolic pool.

Comment in

References

    1. St Johnston D. Moving messages: the intracellular localization of mRNAs. Nat Rev Mol Cell Biol. 2005;6:363–375. - PubMed
    1. Jung H, Gkogkas CG, Sonenberg N, Holt CE. Remote Control of Gene Function by Local Translation. Cell. 2014;157:26–40. - PMC - PubMed
    1. Lee JH, et al. Highly Multiplexed Subcellular RNA Sequencing in Situ. Science. 2014;343:1360–1363. - PMC - PubMed
    1. David A, et al. Nuclear translation visualized by ribosome-bound nascent chain puromycylation. J Cell Biol. 2012;197:45–57. - PMC - PubMed
    1. Dieterich DC, et al. In situ visualization and dynamics of newly synthesized proteins in rat hippocampal neurons. Nat Neurosci. 2010;13:897–905. - PMC - PubMed

MeSH terms

Associated data