

Onset of multiple sclerosis before adulthood leads to failure of age-expected brain growth
- PMID: 25378667
- PMCID: PMC4276405
- DOI: 10.1212/WNL.0000000000001045
Onset of multiple sclerosis before adulthood leads to failure of age-expected brain growth
Abstract
Objective: To determine the impact of pediatric-onset multiple sclerosis (MS) on age-expected brain growth.
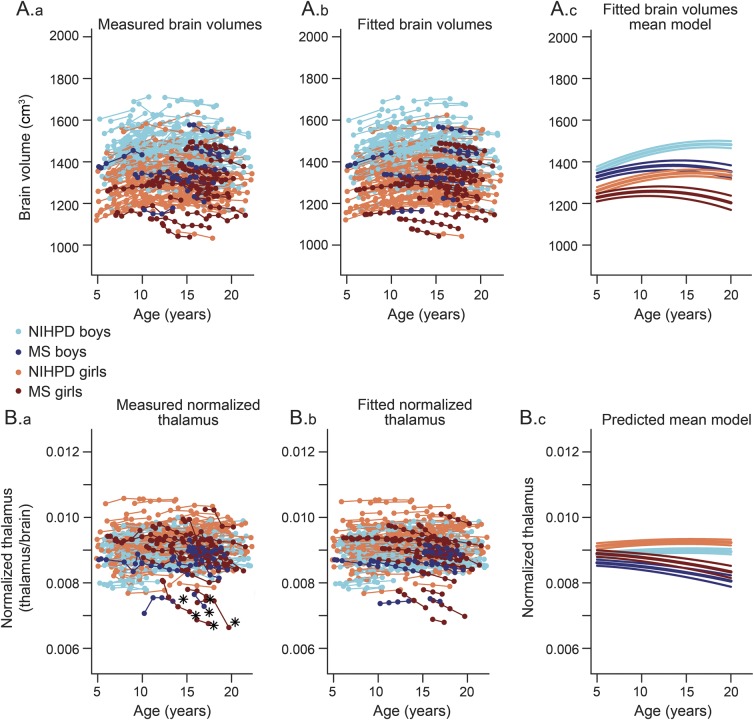
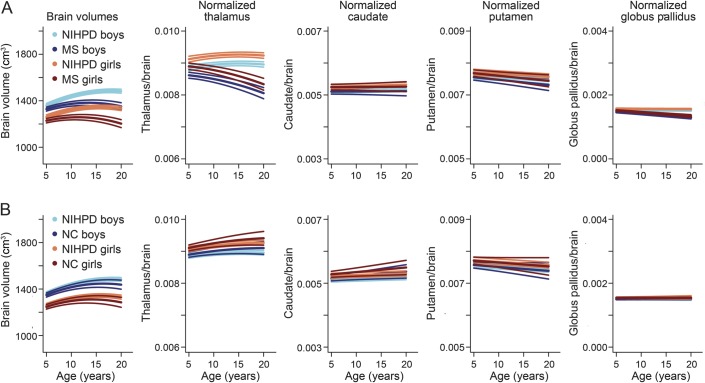
Methods: Whole brain and regional volumes of 36 patients with relapsing-remitting MS onset prior to 18 years of age were segmented in 185 longitudinal MRI scans (2-11 scans per participant, 3-month to 2-year scan intervals). MRI scans of 25 age- and sex-matched healthy normal controls (NC) were also acquired at baseline and 2 years later on the same scanner as the MS group. A total of 874 scans from 339 participants from the NIH-funded MRI study of normal brain development acquired at 2-year intervals were used as an age-expected healthy growth reference. All data were analyzed with an automatic image processing pipeline to estimate the volume of brain and brain substructures. Mixed-effect models were built using age, sex, and group as fixed effects.
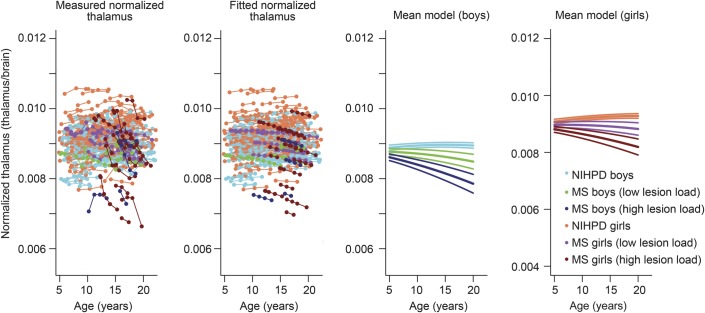
Results: Significant group and age interactions were found with the adjusted models fitting brain volumes and normalized thalamus volumes (p < 10(-4)). These findings indicate a failure of age-normative brain growth for the MS group, and an even greater failure of thalamic growth. In patients with MS, T2 lesion volume correlated with a greater reduction in age-expected thalamic volume. To exclude any scanner-related influence on our data, we confirmed no significant interaction of group in the adjusted models between the NC and NIH MRI Study of Normal Brain Development groups.
Conclusions: Our results provide evidence that the onset of MS during childhood and adolescence limits age-expected primary brain growth and leads to subsequent brain atrophy, implicating an early onset of the neurodegenerative aspect of MS.
© 2014 American Academy of Neurology.
Figures
Comment in
-
Impact of MS during the critical window of brain development.Neurology. 2014 Dec 2;83(23):2106-7. doi: 10.1212/WNL.0000000000001056. Epub 2014 Nov 5. Neurology. 2014. PMID: 25378681 No abstract available.
References
-
- Geurts JJ, Calabrese M, Fisher E, Rudick RA. Measurement and clinical effect of grey matter pathology in multiple sclerosis. Lancet Neurol 2012;11:1082–1092. - PubMed
-
- Chard D, Miller D. Grey matter pathology in clinically early multiple sclerosis: evidence from magnetic resonance imaging. J Neurol Sci 2009;282:5–11. - PubMed
-
- Aubert-Broche B, Fonov V, Ghassemi R, et al. Regional brain atrophy in children with multiple sclerosis. NeuroImage 2011;58:409–415. - PubMed
-
- Mesaros S, Rocca MA, Absinta M, et al. Evidence of thalamic gray matter loss in pediatric multiple sclerosis. Neurology 2008;70:1107–1112. - PubMed
-
- Kerbrat A, Aubert-Broche B, Fonov V, et al. Reduced head and brain size for age and disproportionately smaller thalami in child-onset MS. Neurology 2012;78:194–201. - PubMed
Publication types
MeSH terms
LinkOut - more resources
Full Text Sources
Other Literature Sources
Medical