. 2014 Oct;27(3-4):205-15.
doi: 10.1293/tox.2014-0023. Epub 2014 Aug 22.

Exposure to High Doses of Lipopolysaccharide during Ovalbumin Sensitization Prevents the Development of Allergic Th2 Responses to a Dietary Antigen

Affiliations

Exposure to High Doses of Lipopolysaccharide during Ovalbumin Sensitization Prevents the Development of Allergic Th2 Responses to a Dietary Antigen

Ikuko Torii et al. J Toxicol Pathol. 2014 Oct.

Erratum in

  • Errata (Printer's correction).
    [No authors listed] [No authors listed] J Toxicol Pathol. 2016 Jan;29(1):74. Epub 2016 Feb 17. J Toxicol Pathol. 2016. PMID: 26989306 Free PMC article.

Abstract

Food allergies are driven by aberrant T helper (Th) 2 cells. Lipopolysaccharide (LPS) influences the development of Th2-mediated diseases, but its role in food allergy and tolerance remains unclear. To address this issue, we established mouse models presenting allergic or tolerant responses to ovalbumin (OVA). Mice sensitized with crude OVA developed Th2 responses including acute diarrhea, increases in serum OVA-specific IgE, dominant production of serum OVA-specific IgG1, increases in Th2-type cytokines and proliferation of mast cells in duodenal and colonic tissues. Sensitization of mice with crude OVA and LPS abrogated Th2-type responses observed in allergic mice. The level of OVA-specific proliferation in mesenteric lymph node CD4(+) T cells was comparable in allergic and tolerant mice, indicating that the tolerance is not caused by anergy and apoptosis of antigen-primed T cells. Expression of Th1- and Th2-type cytokines was suppressed in whole spleen cells and/or purified spleen CD4(+) T cells of tolerant mice, indicating that the tolerance was not caused by the shift from Th2 to Th1. On the other hand, interleukin (IL)-10, a regulatory cytokine produced by regulatory T cells, was upregulated in whole spleen cells and purified spleen CD4(+) T cells of tolerant mice. Furthermore, spleen CD4(+) T cells from tolerant mice suppressed the growth of CD4(+) T cells from DO11.10 mice in co-culture. These results indicate that tolerance is induced in allergic mice by simultaneous exposure to LPS during sensitization with OVA and that a population of T cells producing IL-10 plays an important role in the tolerance induction.

Keywords: allergy; lipopolysaccharide; ovalbumin; tolerance.


Figures

Fig. 1.
Fig. 1.
Establishment of an allergic model. (A) The experimental protocol for induction of allergy in mice. BALB/c ByJ or BALB/c Cr mice were sensitized twice by i.p. injection of cOVA (100 μg) at a 2-week interval (black arrows) and then challenged by intragastric administration (ig) of cOVA (100 mg) on the indicated days (white arrows). Mice were sacrificed within 1 h after the last challenge (dotted arrow). Mice sensitized with PBS were used as a control. (B) Incidence of diarrhea. cOVA-sensitized (closed circle) (n=8) and PBS control BALB/c ByJ mice (open circle) (n=3) were monitored for 1 h, and diarrhea occurrence was assessed for 15 - 60 min after each challenge with cOVA. Similar results were obtained in 5 experiments carried out in this study, and the representative results are shown. (C) Allergic reactions of the alimentary tract. (a) Mice sensitized with cOVA showed severe mucous diarrhea within 30 min after challenge with cOVA. (b) The ceca and colons removed from cOVA-sensitized, cOVA-challenged mice showed severe edematous and hyperemic changes and contained watery soft feces after repeated oral challenges with cOVA, and (c) those from control mice showed no edematous and hyperemic changes and contained solid feces.
Fig. 2.
Fig. 2.
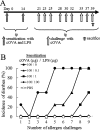
Prevention of diarrhea by simultaneous sensitization with cOVA and LPS. (A) The experimental protocol for induction of LPS-mediated tolerance in allergic mice. Mice were sensitized by simultaneous i.p. injection of cOVA (100 μg) and various doses of LPS (striped arrows) twice and repeatedly challenged by the intragastric administration (ig) of cOVA (100 mg) on the indicated days (white arrows). Mice were sacrificed within 1 h after the last challenge (dotted arrow). Allergic mice, sensitized with cOVA alone, were used as a positive control, and PBS-sensitized mice were used as a negative control. (B) Prevention of diarrhea. The incidence of diarrhea decreased with increasing doses of LPS (▲ 0.1 μg (n=4) ■ 1 μg (n=4) and ♦ 100 μg (n=4)). The presence of LPS (100 μg) completely abrogated diarrhea. Mice sensitized with cOVA alone and those sensitized with PBS are indicated by closed (● (n=4)) and open ( (n=3)) circles, respectively. Similar results were obtained in 5 experiments carried out in this study, and representative results are shown.
Fig. 3.
Fig. 3.
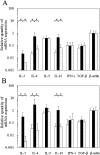
The expression of Th1-, Th2- and Treg-type cytokine mRNAs in duodenal and colonic tissues. Th1-, Th2- and Treg-type cytokine mRNAs were measured by quantitative real-time RT-PCR in duodenal (A) and colonic (B) tissues removed from control mice (white columns), allergic mice (black columns) and tolerant mice (dotted columns). Each value of mRNA expression was calibrated to that of β-actin expression. Each bar represents the mean ± SD of 5 control mice, 5 tolerant mice and 6 allergic mice. Significant differences (*P < 0.05) were found between columns by the independent t-test with Bonferroni’s correction for pairwise comparisons. In control mice, IL-3 mRNA was below the level of detection. Similar results were obtained in 3 experiments, and representative results are shown.
Fig. 4.
Fig. 4.
Production of OVA-specific antibodies in allergic mice. Blood samples were obtained from PBS-sensitized control, allergic and tolerant mice within 1 h after the last challenge, and their sera were prepared. (A) Increases in OVA-specific IgE levels in allergic mice. Serum levels of OVA-specific IgE were determined by ELISA. Each dot indicates the OVA-specific IgE concentration in one mouse. We used control (n=5), allergic (n=10) and tolerant (n=8) mice. (B) Increases in OVA-specific IgG1, but not IgG2a, levels in allergic mice. The titers of OVA-specific IgG1 (a) and IgG2a (b) in sera were determined by ELISA. Each dot indicates the values of OVA-specific IgG1 and IgG2a in one mouse. We used control (n=5), allergic (n=10) and tolerant (n=5) mice. Lines depict mean values. ND, not detectable.
Fig. 5.
Fig. 5.
Involvement of mast cells in allergic and tolerant mice. (A) Duodenal sections of allergic mice, tolerant mice and control mice were immunostained with anti-c-kit antibody (ACK2). Numerous mast cells infiltrated into the duodenal mucosa of allergic mice (a), but mast cells were hardly detectable in the duodenal mucosa of tolerant mice (b) and control mice (c). The secondary antibody does not show a nonspecific reaction (d). Scale bars represent 200 μm. (B) Increase of mast cells in allergic mice. The numbers of mast cells in the duodenal mucosa of allergic (n=5), tolerant (n=5) and control mice (n=5) were counted under a light microscope. Each bar indicates the mean ± SD of 5 mice. Significant differences (*P < 0.01; **P < 0.005) were found between columns by the independent t-test with Bonferroni’s correction for pairwise comparisons.
Fig. 6.
Fig. 6.
Proliferative ability for OVA stimulation of MLN CD4+ T cells from allergic and tolerant mice. MLNs were removed from control mice (n=5) (white columns), allergic mice (n=5) (black columns) and tolerant mice (n=5) (dotted columns) 1 week after the second sensitization. MLN CD4+ T cells were purified by magnetic separation and co-cultured with APCs from BALB/c ByJ mice in the presence of the indicated concentration of pOVA. Proliferative ability of MLN CD4+ T cells was examined with a [3H]-thymidine incorporation assay (cpm). Each bar represents the mean ± SD of 5 mice. Significant differences (*P < 0.05; **P < 0.01) were found between columns by the independent t-test with Bonferroni’s correction for pairwise comparisons. Similar results were obtained in 3 experiments, and representative results are shown.
Fig. 7.
Fig. 7.
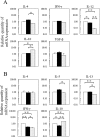
The expression of Th2-, Th1- and Treg-type cytokine mRNA in whole spleen cells and spleen CD4+ T cells. Spleens were removed from control mice (white columns), allergic mice (black columns) and tolerant mice (dotted columns) 4 days after the second sensitization. Total RNA was extracted from whole spleen cells (A) and purified CD4+ T cells (B) and converted to cDNA. Expression of cytokines at the mRNA level was examined by quantitative real-time RT-PCR. Each value of mRNA expression was calibrated to that of β-actin expression. Each bar represents the mean ± SD of 3 mice. Significant differences (*P < 0.05; **P < 0.01) were found between columns by the independent t-test with Bonferroni’s correction for pairwise comparisons. Similar results were obtained in 3 experiments, and representative results are shown.
Fig. 8.
Fig. 8.
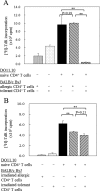
Inhibition of DO11.10 CD4+ T cell proliferation by CD4+ T cells from tolerant mice. Naive DO11.10 spleen CD4+ T cells (5 × 10⁵) were co-cultured with nonirradiated or irradiated spleen CD4+ T cells (5 × 10⁵) from allergic or tolerant mice in the presence of pOVA (50 μg/ml) and APCs (1 × 10⁵) from DO11.10 mice. Proliferative ability of cells was examined with a [3H]-thymidine incorporation assay (cpm). (A) [3H]-thymidine incorporation in the co-culture of naive DO11.10 CD4+ T cells with CD4+ T cells from allergic or tolerant mice. (B) [3H]-thymidine incorporation in the coculture of naive DO11.10 CD4+ T cells with irradiated CD4+ T cells from allergic or tolerant mice. The levels of [3H]-thymidine incorporation of each cell culture and co-culture as designated below the graph are shown. Each bar indicates the mean ± SD of triplicate cultures. Significant differences (*P < 0.01) were found between columns by the independent t-test with Bonferroni’s correction for pairwise comparisons. Similar results were obtained in 3 experiments, and representative results are shown.

References

    1. Sampson HA, and Burks AW. Mechanisms of food allergy. Annu Rev Nutr. 16: 161–177. 1996. - PubMed
    1. Sampson HA, and Ho DG. Relationship between food-specific IgE concentrations and the risk of positive food challenges in children and adolescents. J Allergy Clin Immunol. 100: 444–451. 1997. - PubMed
    1. Verdú EF, Bercík P, Bergonzelli GE, Huang XX, Blennerhasset P, Rochat F, Fiaux M, Mansourian R, Corthésy-Theulaz I, and Collins SM. Lactobacillus paracasei normalizes muscle hypercontractility in a murine model of postinfective gut dysfunction. Gastroenterology. 127: 826–837. 2004. - PubMed
    1. Moon A, and Kleinman RE. Allergic gastroenteropathy in children. Ann Allergy Asthma Immunol. 74: 5–12, quiz 12–16. 1995. - PubMed
    1. Brix S, Kjaer TM, Barkholt V, and Frøkiaer H. Lipopolysaccharide contamination of beta-lactoglobulin affects the immune response against intraperitoneally and orally administered antigen. Int Arch Allergy Immunol. 135: 216–220. 2004. - PubMed