. 2014:2014:457059.
doi: 10.1155/2014/457059. Epub 2014 Oct 14.

Phenotypic and proteomic characteristics of human dental pulp derived mesenchymal stem cells from a natal, an exfoliated deciduous, and an impacted third molar tooth

Affiliations

Phenotypic and proteomic characteristics of human dental pulp derived mesenchymal stem cells from a natal, an exfoliated deciduous, and an impacted third molar tooth

Gurler Akpinar et al. Stem Cells Int. 2014.

Abstract

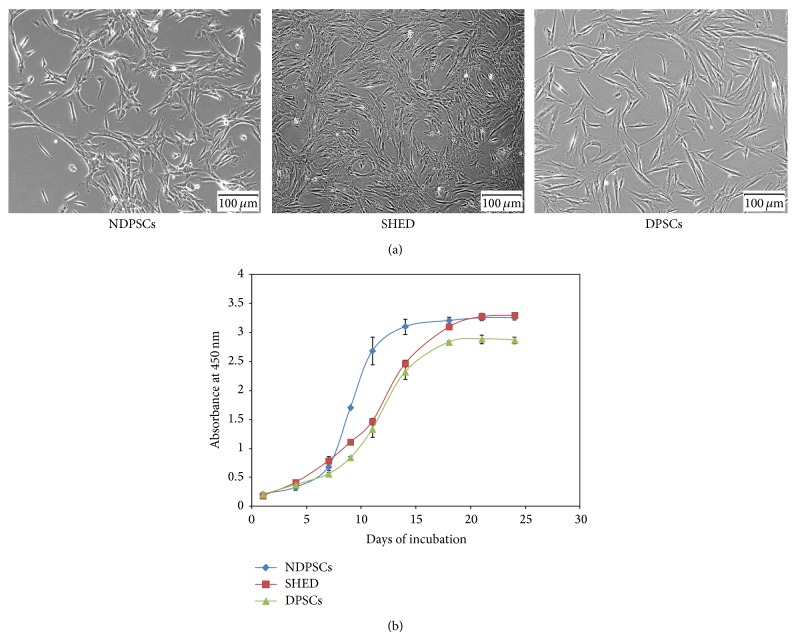
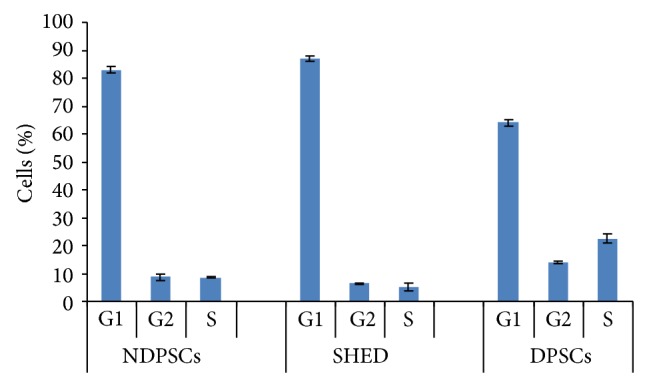
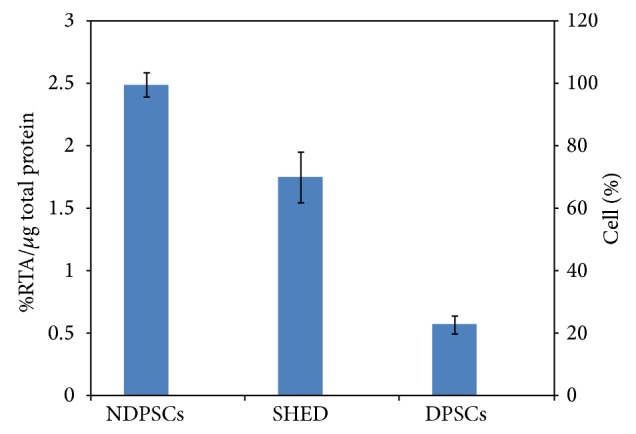
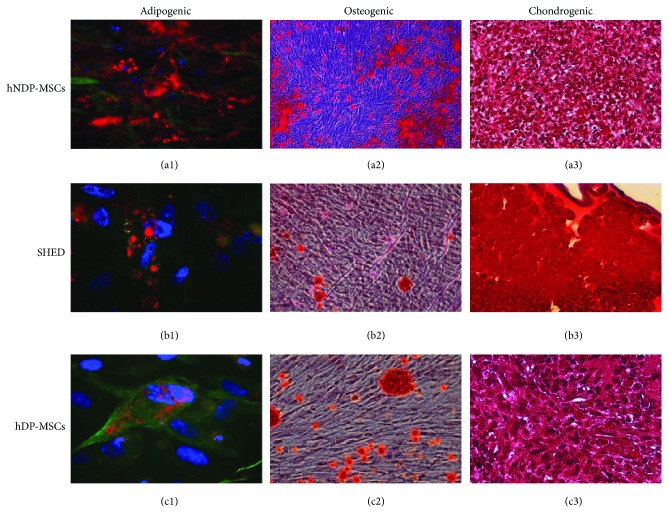
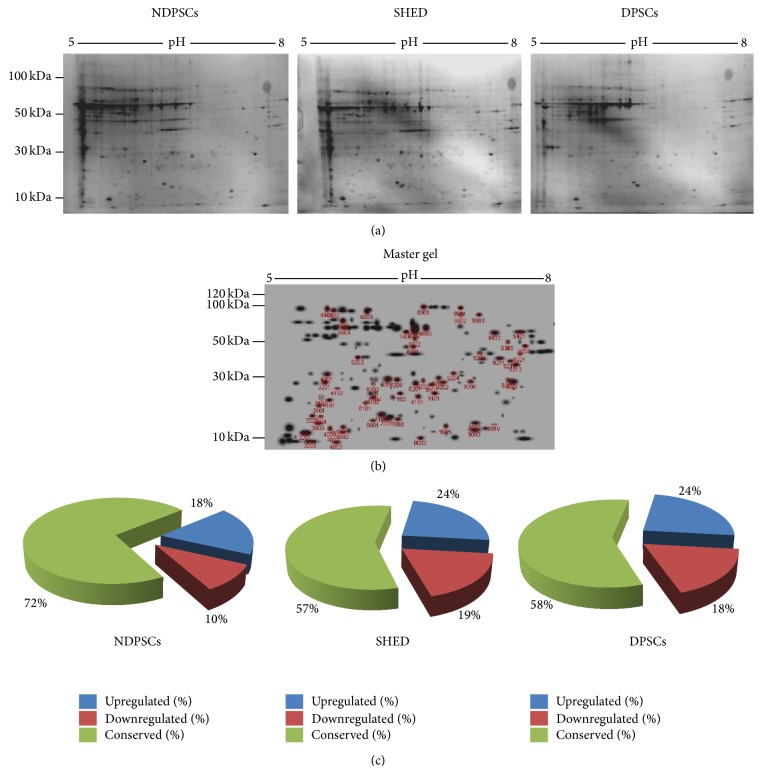
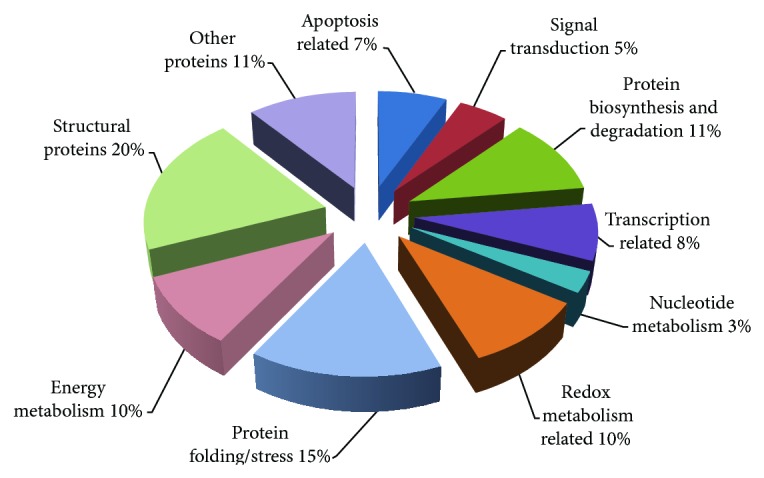
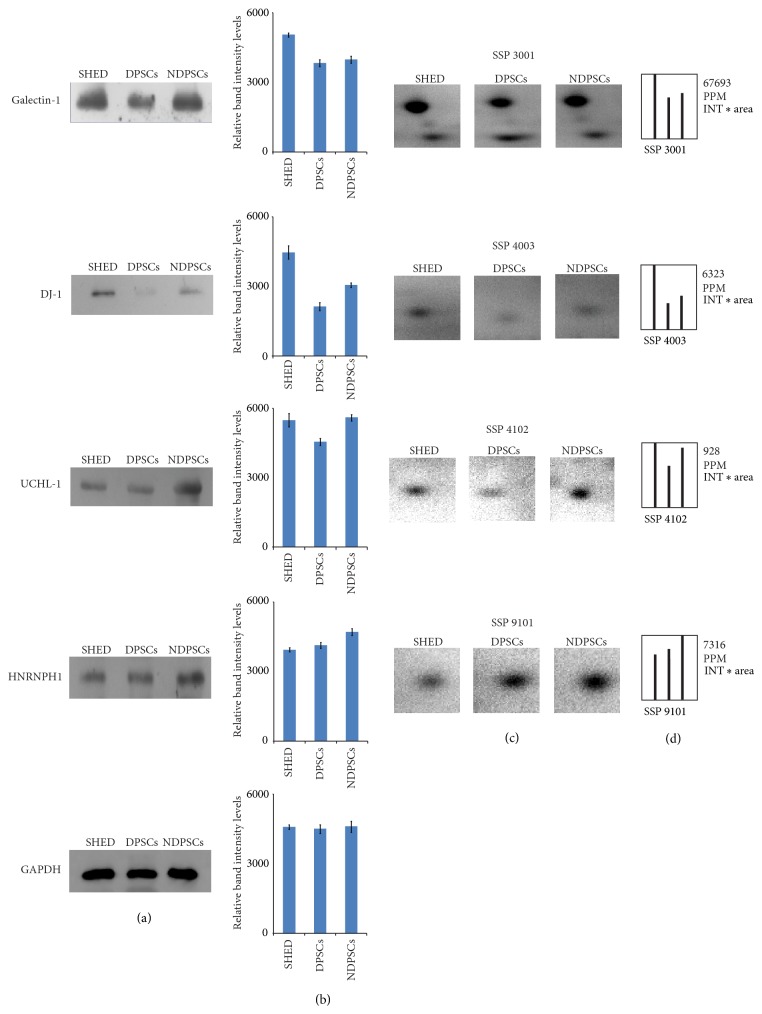
The level of heterogeneity among the isolated stem cells makes them less valuable for clinical use. The purpose of this study was to understand the level of heterogeneity among human dental pulp derived mesenchymal stem cells by using basic cell biology and proteomic approaches. The cells were isolated from a natal (NDPSCs), an exfoliated deciduous (stem cells from human exfoliated deciduous (SHED)), and an impacted third molar (DPSCs) tooth of three different donors. All three stem cells displayed similar features related to morphology, proliferation rates, expression of various cell surface markers, and differentiation potentials into adipocytes, osteocytes, and chondrocytes. Furthermore, using 2DE approach coupled with MALDI-TOF/TOF, we have generated a common 2DE profile for all three stem cells. We found that 62.3 ± 7% of the protein spots were conserved among the three mesenchymal stem cell lines. Sixty-one of these conserved spots were identified by MALDI-TOF/TOF analysis. Classification of the identified proteins based on biological function revealed that structurally important proteins and proteins that are involved in protein folding machinery are predominantly expressed by all three stem cell lines. Some of these proteins may hold importance in understanding specific properties of human dental pulp derived mesenchymal stem cells.


Figures

Figure 1
Figure 1
Illustration of MSC morphologies and relevant growth kinetics. (a) Morphology of NDPSCs, SHED, and DPSCs. The cells were at passage three. Images were taken with an inverted microscope (40X). (b) Growth curves for NDPSCs, SHED, and DPSCs over a period of 25 days. The cells were cultured in 96-well plates in triplicate and their growth rates were followed by WST-1 assay, which measures cell viability. DPSCs displayed relatively lower growth rate than SHED and NDPSCs.
Figure 2
Figure 2
Cell cycle analysis of NDPSCs, SHED, and DPSCs. Each sample (10,000 cells) was counted in triplicate by a flow cytometer. The values are expressed as percentage mean ± standard deviation.
Figure 3
Figure 3
Telomerase activities of NDPSCs, SHED, and DPSCs. The activities were measured by conventional telomeric repeat amplification protocol (TRAP) and relative telomerase activities (RTA) were calculated with respect to the control template equivalent to 0.001 mol/μL DNA.
Figure 4
Figure 4
In vitro differentiation potential of NDPSCs, SHED, and DPSCs. ((a1), (b1), and (c1)). Adipogenic differentiation is visually marked by accumulation of neutral lipid vacuoles in cultures (Oil Red staining). Actin ((a1) and (b1)) and vimentin (c1) expression were shown in green and nuclei in blue with DAPI. ((a2), (b2), and (c2)) Osteogenic differentiation was indicated by the formation of calcified nodule with Alizarin Red S staining. ((a3), (b3), and (c3)) The analyzed sections were positive for Safranin O staining after chondrogenic differentiation.
Figure 5
Figure 5
Comparative proteome analysis of NDPSCs, SHED, and DPSCs. (a) Undifferentiated MSCs were subjected to protein isolation and loaded onto pH 5 to pH 8 IPG strips for the first dimension and precast SDS-PAGE gels for the second dimension separation and stained with Colloidal Coomassie Blue for 24 hr after 24 hours of fixation. The gels are representative of three gels from each MSC type. (b) Master gel image was created by PDQuest Advance software to determine the number of spots that matched every member (183 spots). The numbers represent SSP numbers assigned to each spot by the software. These spots were cut from the gels and were subjected to MALDI-TOF/TOF analysis. Protein identification was performed by peptide mass finger printing by MASCOT (c) Pie charts to illustrate proteome conservation ratios among hNDP, SHED, and hDP-MSCs. Changes in spot intensities among 183 matching spots were compared. Spots that were up- or downregulated more than 2-fold were considered to be subjected to regulation.
Figure 6
Figure 6
Classification of identified proteins based on their molecular function and their involvement in biological processes. Pie chart representing the distribution of the 61 identified proteins based on their molecular function and biological processes. Assignments were made on the basis of information from PANTHER analysis (http://www.pantherdb.org/) as well as NCBI (http://www.ncbi.nlm.nih.gov/pubmed) and Swiss-Prot/TrEMBL annotations (http://www.expasy.org/).
Figure 7
Figure 7
WB validation of the selected proteins identified by MALDI-TOF/TOF analysis. Western blot analysis was used for validation of proteomic results. Conventional 12% SDS gels were run with whole cell extracts. (a) Three lanes for SHED, DPSCs, and NDP-MSC are shown for each antibody. Galectin-1, DJ-1, UCHL-1, and HNRNPH1 antibodies were used for validation of expressions of the identified proteins. GAPDH was used for the normalization of each protein sample. (b) Relative protein intensities of bands were measured by Quantity One 1D analysis software (Bio-Rad). Each WB was repeated for three times. (c) Representative images of protein spots selected for WB analysis (protein identities corresponding to SSP numbers can be found in Table 2). (d) Comparative intensity graphs of selected protein spots generated by PDQuest Advance software (Bio-Rad).

References

    1. Cookson C. Stem cells: East...and West. Country report: United Kingdom. Scientific American. 2005;293(1, article A23) - PubMed
    1. Mimeault M., Hauke R., Batra S. K. Stem cells: a revolution in therapeutics—recent advances in stem cell biology and their therapeutic applications in regenerative medicine and cancer therapies. Clinical Pharmacology and Therapeutics. 2007;82(3):252–264. doi: 10.1038/sj.clpt.6100301. - DOI - PubMed
    1. Ho A. D., Wagner W., Franke W. Heterogeneity of mesenchymal stromal cell preparations. Cytotherapy. 2008;10(4):320–330. doi: 10.1080/14653240802217011. - DOI - PubMed
    1. Parker G. C., Anastassova-Kristeva M., Eisenberg L. M., Rao M. S., Williams M. A., Sanberg P. R., English D. Stem cells: shibboleths of development, part II: toward a functional definition. Stem Cells and Development. 2005;14(5):463–469. doi: 10.1089/scd.2005.14.463. - DOI - PubMed
    1. Wagner W., Feldmann R. E., Jr., Seckinger A., Maurer M. H., Wein F., Blake J., Krause U., Kalenka A., Bürgers H. F., Saffrich R., Wuchter P., Kuschinsky W., Ho A. D. The heterogeneity of human mesenchymal stem cell preparations—evidence from simultaneous analysis of proteomes and transcriptomes. Experimental Hematology. 2006;34(4):536–548. doi: 10.1016/j.exphem.2006.01.002. - DOI - PubMed

LinkOut - more resources