Randomized Controlled Trial
. 2014 Aug 28:6:115-25.
doi: 10.1016/j.nicl.2014.08.023. eCollection 2014.

Random Forest ensembles for detection and prediction of Alzheimer's disease with a good between-cohort robustness

Affiliations
Randomized Controlled Trial

Random Forest ensembles for detection and prediction of Alzheimer's disease with a good between-cohort robustness

A V Lebedev et al. Neuroimage Clin. .

Abstract

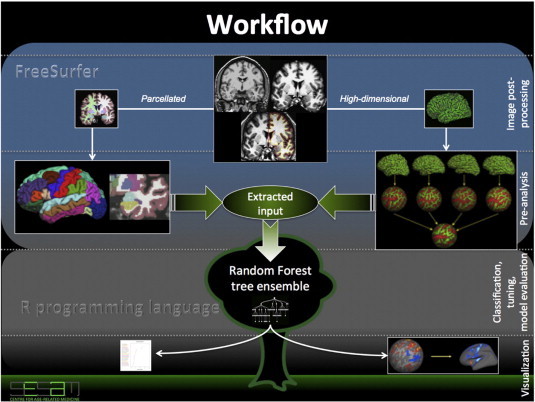
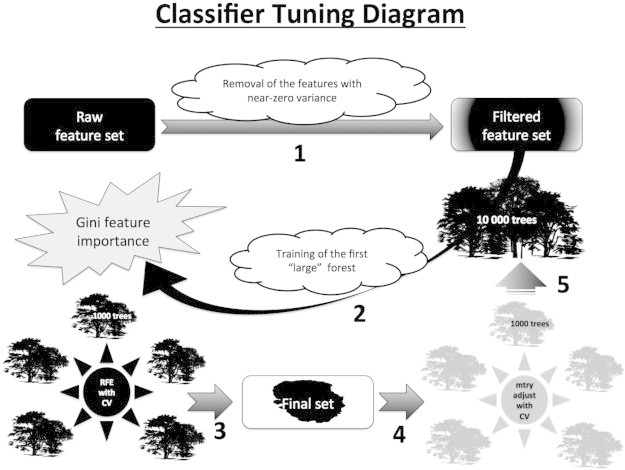
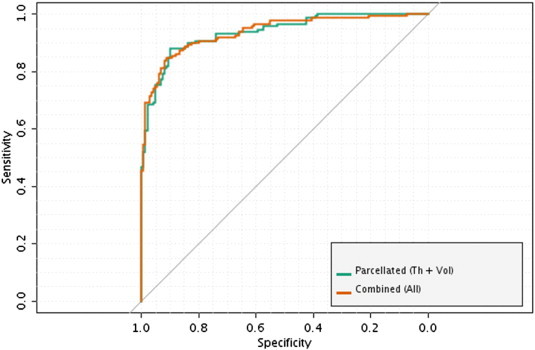
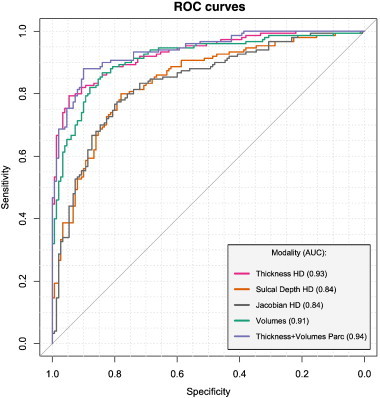
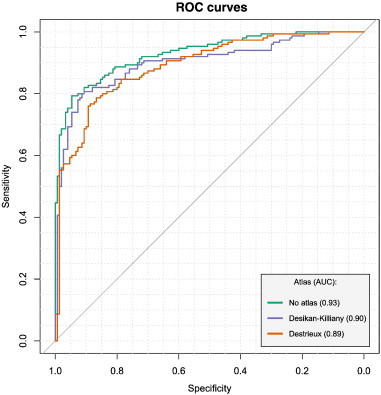
Computer-aided diagnosis of Alzheimer's disease (AD) is a rapidly developing field of neuroimaging with strong potential to be used in practice. In this context, assessment of models' robustness to noise and imaging protocol differences together with post-processing and tuning strategies are key tasks to be addressed in order to move towards successful clinical applications. In this study, we investigated the efficacy of Random Forest classifiers trained using different structural MRI measures, with and without neuroanatomical constraints in the detection and prediction of AD in terms of accuracy and between-cohort robustness. From The ADNI database, 185 AD, and 225 healthy controls (HC) were randomly split into training and testing datasets. 165 subjects with mild cognitive impairment (MCI) were distributed according to the month of conversion to dementia (4-year follow-up). Structural 1.5-T MRI-scans were processed using Freesurfer segmentation and cortical reconstruction. Using the resulting output, AD/HC classifiers were trained. Training included model tuning and performance assessment using out-of-bag estimation. Subsequently the classifiers were validated on the AD/HC test set and for the ability to predict MCI-to-AD conversion. Models' between-cohort robustness was additionally assessed using the AddNeuroMed dataset acquired with harmonized clinical and imaging protocols. In the ADNI set, the best AD/HC sensitivity/specificity (88.6%/92.0% - test set) was achieved by combining cortical thickness and volumetric measures. The Random Forest model resulted in significantly higher accuracy compared to the reference classifier (linear Support Vector Machine). The models trained using parcelled and high-dimensional (HD) input demonstrated equivalent performance, but the former was more effective in terms of computation/memory and time costs. The sensitivity/specificity for detecting MCI-to-AD conversion (but not AD/HC classification performance) was further improved from 79.5%/75%-83.3%/81.3% by a combination of morphometric measurements with ApoE-genotype and demographics (age, sex, education). When applied to the independent AddNeuroMed cohort, the best ADNI models produced equivalent performance without substantial accuracy drop, suggesting good robustness sufficient for future clinical implementation.

Keywords: ADNI; AddNeuroMed; Alzheimer's disease; Computer-aided diagnosis; Mild cognitive impairment; Multi-center study; Random Forest; Structural MRI.


Figures

Fig. A1
Fig. A1
Workflow diagram. The diagram illustrates main steps of image post-processing and analysis. It starts and proceeds in two directions aimed at extraction of parcelled and high-dimensional measurements using Freesurfer software (blue box). After this part had completed, the extracted measures underwent steps for outlier detection, and the resulted output was used in further Random Forest classification runs (in R programming language — gray box). We additionally tuned our models using recursive feature elimination and mtry-parameter adjustment (which defines the number of predictors randomly sampled at each node of the classifier). Finally, feature importance vectors from the best models were either mapped into the brain space (for the high-dimensional data) or plotted (for the parcelled input).
Fig. A2
Fig. A2
Classifier tuning diagram. The diagram describes main steps performed during the tuning of Random Forest models. This framework was employed for all modalities: cortical thickness, sulcal depth, Jacobian maps, non-cortical volumes, combined parcelled measurements of cortical thickness and non-cortical volumes. (1) First, the measurements with near-zero variance were removed from the feature sets and the resulting output underwent stepwise recursive feature elimination (RFE); (2) 10,000 trees were then used to “grow” the first forest (using full feature set), and afterwards (3) RFE was performed based on feature importance vector derived from the first forest, by removing lowest-ranked 5% of the features at each step (gradually reducing the dimensionality as 100%, 95%, … etc., up to 50%), and by the subsequent accuracy comparison with 5-fold CV; (4) after selection of the optimal feature subset, mtry-parameter adjustment was also performed using 1000 trees (search range ∈ [Nfeatures4 ;Nfeatures2.5], step = Nfeatures4 ); (5) the forests were retrained with optimal parameters using 10,000 trees.
Fig. A5
Fig. A5
ROC curves: best models (AD/HC). The figure illustrates ROC-curves of the most accurate models trained to differentiate between AD and HC. The model trained using combined parcelled (DK atlas) cortical thickness measures and subcortical volumetric data produced equivalent accuracy compared to the higher-order ensemble model (where all classifiers were combined together by a majority vote). AD/HC — Alzheimer's Disease/Healthy Controls.
Fig. 1
Fig. 1
ROC curves: morphometric modalities (AD/HC). The figure illustrates ROC-curves of the models trained with different morphometric inputs. Three inputs demonstrate competing performances: high-dimensional (HD) cortical thickness, volumetric data and combined parcellated measurements. AD/HC — Alzheimer's disease/healthy controls.
Fig. 2
Fig. 2
Effect of cortical parcellation using DK and D atlases on AD/HC performance. ROC-curves differed significantly when compared to one from the model trained using non-parcellated high-dimensional measurements (p-values: 0.002 and 0.009 — for Desikan-Killiany (DK) and Destrieux (D), respectively) differences were non significant between DK and D. AD/HC — Alzheimer's disease/healthy controls.
Fig. 3
Fig. 3
Cortical pattern of relevance for Alzheimer's disease detection: high-dimensional morphometric data. The figure illustrates regions, which were the most relevant for Alzheimer's disease detection based on the mean decrease of the Gini index (see Methods). In all three high-dimensional modalities, the pattern was AD-specific and included changes predominantly in temporal lobes (with maximum relevance of entorhinal region).
Fig. 4
Fig. 4
Pattern of relevance for Alzheimer's disease detection: parcelled morphometric data (cortical thickness [DK-atlas] + non-cortical volumes). The figure illustrates regions, which were the most relevant for Alzheimer's disease detection based on the mean decrease of the Gini index. Likewise in the high-dimensional input, the pattern-of-relevance is AD-specific.

References

    1. O'Brien J.T. Role of imaging techniques in the diagnosis of dementia. British Journal of Radiology. 2007;80(Spec No 2):S71–S77. 18445747 - PubMed
    1. Gray K.R., Aljabar P., Heckemann R.A., Hammers A., Rueckert D., Alzheimer's Disease Neuroimaging Initiative Random forest-based similarity measures for multi-modal classification of Alzheimer's disease. Neuroimage. 2013;65:167–175. 23041336 - PMC - PubMed
    1. Liu M., Zhang D., Shen D., Alzheimer's Disease Neuroimaging Initiative ensemble sparse classification of Alzheimer's disease. Neuroimage. 2012;60:1106–1116. 22270352 - PMC - PubMed
    1. Cuingnet R., Gerardin E., Tessieras J., Auzias G., Lehéricy S., Habert M.O., Chupin M., Benali H., Colliot O. Automatic classification of patients with Alzheimer's disease from structural MRI: a comparison of ten methods using the ADNI database. Neuroimage. 2011;56:766–781. 20542124 - PubMed
    1. Klöppel S., Stonnington C.M., Chu C., Draganski B., Scahill R.I., Rohrer J.D., Fox N.C., Jack C.R., Jr., Ashburner J., Frackowiak R.S. Automatic classification of MR scans in Alzheimer's disease. Brain: A Journal of Neurology. 2008;131:681–689. 18202106 - PMC - PubMed

Publication types