. 2014 Sep 10:6:262-74.
doi: 10.1016/j.nicl.2014.09.002. eCollection 2014.

Assessment of blood-brain barrier disruption using dynamic contrast-enhanced MRI. A systematic review

Affiliations

Assessment of blood-brain barrier disruption using dynamic contrast-enhanced MRI. A systematic review

Anna K Heye et al. Neuroimage Clin. .

Abstract

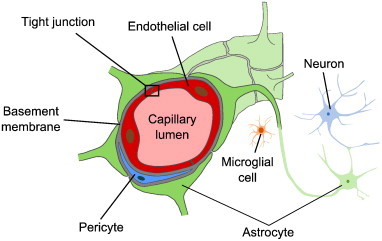
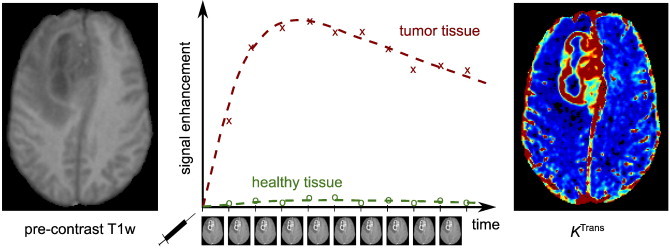
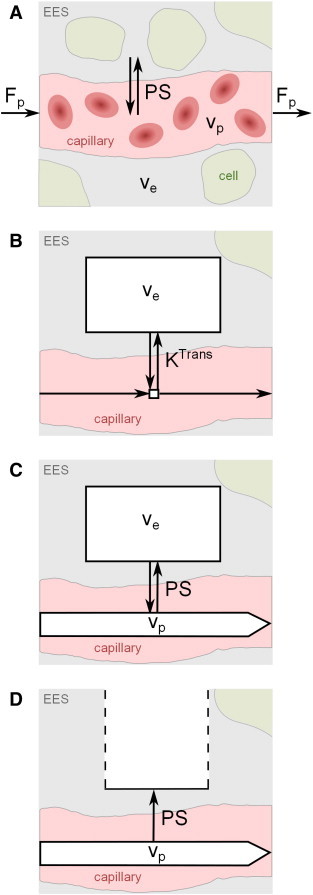
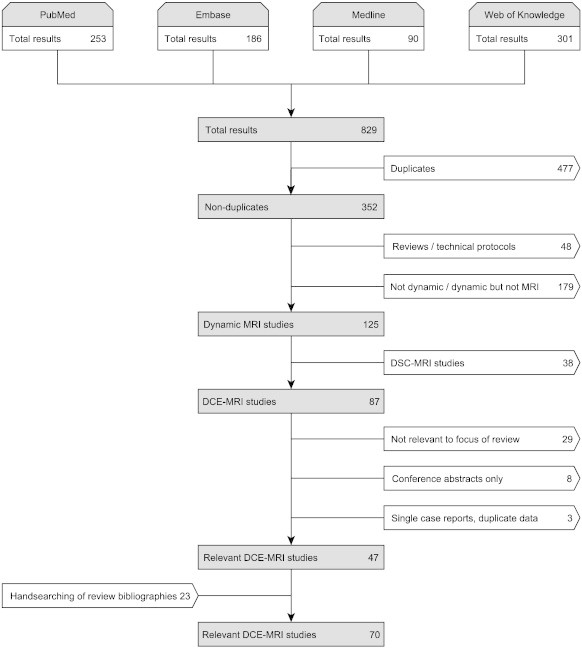
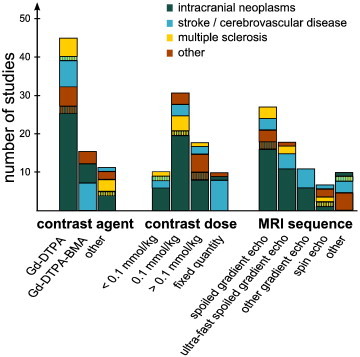
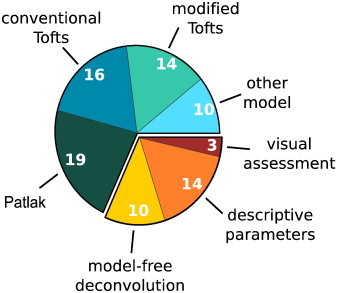
There is increasing recognition of the importance of blood-brain barrier (BBB) disruption in aging, dementia, stroke and multiple sclerosis in addition to more commonly-studied pathologies such as tumors. Dynamic contrast-enhanced MRI (DCE-MRI) is a method for studying BBB disruption in vivo. We review pathologies studied, scanning protocols and data analysis procedures to determine the range of available methods and their suitability to different pathologies. We systematically review the existing literature up to February 2014, seeking studies that assessed BBB integrity using T1-weighted DCE-MRI techniques in animals and humans in normal or abnormal brain tissues. The literature search provided 70 studies that were eligible for inclusion, involving 417 animals and 1564 human subjects in total. The pathologies most studied are intracranial neoplasms and acute ischemic strokes. There are large variations in the type of DCE-MRI sequence, the imaging protocols and the contrast agents used. Moreover, studies use a variety of different methods for data analysis, mainly based on model-free measurements and on the Patlak and Tofts models. Consequently, estimated K (Trans) values varied widely. In conclusion, DCE-MRI is shown to provide valuable information in a large variety of applications, ranging from common applications, such as grading of primary brain tumors, to more recent applications, such as assessment of subtle BBB dysfunction in Alzheimer's disease. Further research is required in order to establish consensus-based recommendations for data acquisition and analysis and, hence, improve inter-study comparability and promote wider use of DCE-MRI.

Keywords: Blood–brain barrier; Dynamic contrast-enhanced MRI; Perfusion; Permeability.


Figures

Fig. 1
Fig. 1
Schematic drawing of the neurovascular unit. The BBB is formed by endothelial cells that line brain capillaries and are sealed by tight junctions. Astrocytes, pericytes, microglial cells and basement membranes interact with the endothelium of the BBB, providing functional and structural support.
Fig. 2
Fig. 2
Illustration of DCE-MRI in a patient with a glioma. The repeated acquisition of T1-weighted images after contrast agent injection allows the calculation of signal enhancement as a function of time (middle) when compared to the pre-contrast signal intensity (left). These curves can be used to calculate maps of quantitative pharmacokinetic parameters (e.g. KTrans, right).
Fig. 3
Fig. 3
Schematic illustrations of common pharmacokinetic models and target parameters. The exchange between the extravascular extracellular space (EES, volume fraction ve) and capillary blood plasma (volume fraction vp) is determined by the plasma flow Fp and the permeability-surface area product PS. (A) Generic tissue model. (B) Conventional Tofts model (with negligible blood volume and volume transfer constant KTrans). (C) Modified Tofts model with non-negligible blood compartment. (D) Patlak model with non-negligible plasma compartment and one-way transport of contrast agent across the BBB. For the latter two models, it may be assumed that KTrans = PS for any solution fitting the data well with a non-negligible vp.
Fig. 4
Fig. 4
Flow diagram summarizing the literature search and inclusion process.
Fig. 5
Fig. 5
Summary of contrast agents, contrast agent doses and MRI sequences. The bar height indicates the number of studies using a particular method, subdivided by pathology.
Fig. 6
Fig. 6
Data analysis methods used in the included studies. Numbers indicate the count of studies using the particular method. (Note that some studies used more than one approach. Consequently, the numbers of studies do not add up to the 70 included studies.).

References

    1. Abbott N.J., Friedman A. Overview and introduction: the blood–brain barrier in health and disease. Epilepsia. 2012;53(Suppl 6):1–6. 23134489 - PMC - PubMed
    1. Abo-Ramadan U., Durukan A., Pitkonen M., Marinkovic I., Tatlisumak E., Pedrono E. Post-ischemic leakiness of the blood–brain barrier: a quantitative and systematic assessment by Patlak plots. Experimental Neurology. 2009;219:328–333. 19520075 - PubMed
    1. Aksoy D., Bammer R., Mlynash M., Venkatasubramanian C., Eyngorn I., Snider R.W. Magnetic resonance imaging profile of blood–brain barrier injury in patients with acute intracerebral hemorrhage. Journal of the American Heart Association. 2013;2:e000161. 23709564 - PMC - PubMed
    1. Ali M.M., Janic B., Babajani-Feremi A., Varma N.R.S., Iskander A.S.M., Anagli J. Changes in vascular permeability and expression of different angiogenic factors following anti-angiogenic treatment in rat glioma. PLoS ONE. 2010;5:e8727. 20090952 - PMC - PubMed
    1. Armitage P., Behrenbruch C., Brady M., Moore N. Extracting and visualizing physiological parameters using dynamic contrast-enhanced magnetic resonance imaging of the breast. Medical Image Analysis. 2005;9:315–329. 15950895 - PubMed

Publication types