. 2014 Aug 27:6:275-83.
doi: 10.1016/j.nicl.2014.08.021. eCollection 2014.

Functional and structural changes in the brain associated with the increase in muscle sympathetic nerve activity in obstructive sleep apnoea

Affiliations

Functional and structural changes in the brain associated with the increase in muscle sympathetic nerve activity in obstructive sleep apnoea

Rania H Fatouleh et al. Neuroimage Clin. .

Abstract

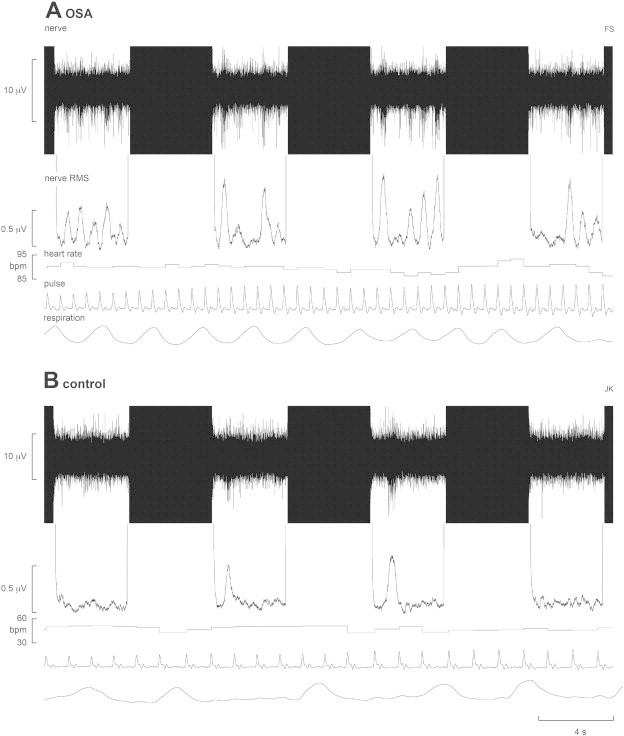
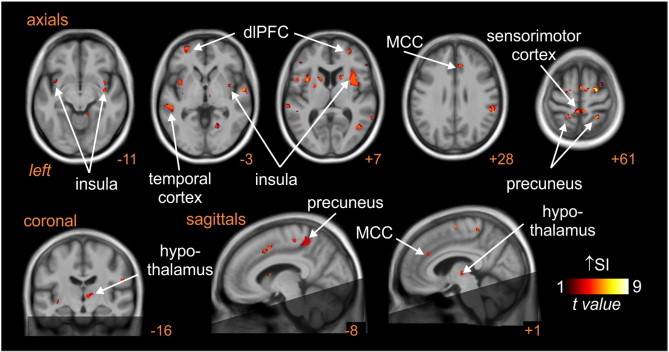
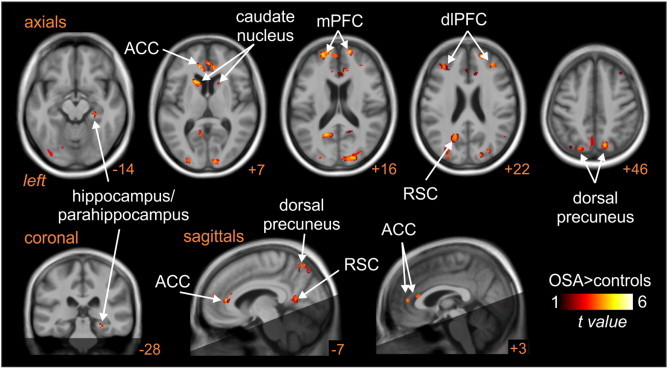
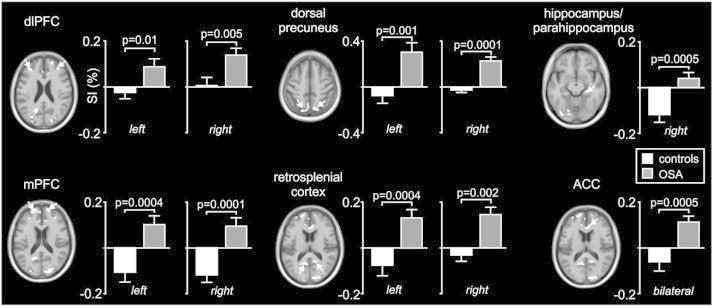
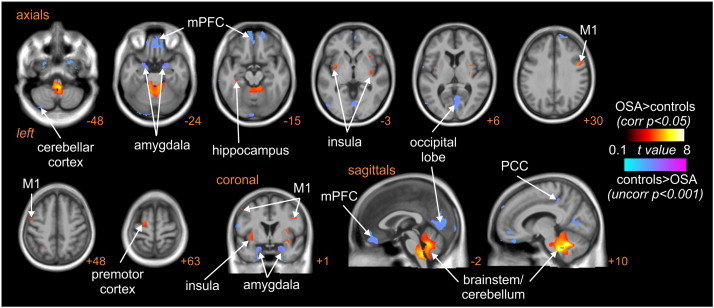
Muscle sympathetic nerve activity (MSNA) is greatly elevated in patients with obstructive sleep apnoea (OSA) during daytime wakefulness, leading to hypertension, but the underlying mechanisms are poorly understood. By recording MSNA concurrently with functional Magnetic Resonance Imaging (fMRI) of the brain we aimed to identify the central processes responsible for the sympathoexcitation. Spontaneous fluctuations in MSNA were recorded via tungsten microelectrodes inserted percutaneously into the common peroneal nerve in 17 OSA patients and 15 healthy controls lying in a 3 T MRI scanner. Blood Oxygen Level Dependent (BOLD) contrast gradient echo, echo-planar images were continuously collected in a 4 s ON, 4 s OFF (200 volumes) sampling protocol. Fluctuations in BOLD signal intensity covaried with the intensity of the concurrently recorded bursts of MSNA. In both groups there was a positive correlation between MSNA and signal intensity in the left and right insulae, dorsolateral prefrontal cortex (dlPFC), dorsal precuneus, sensorimotor cortex and posterior temporal cortex, and the right mid-cingulate cortex and hypothalamus. In OSA the left and right dlPFC, medial PFC (mPFC), dorsal precuneus, anterior cingulate cortex, retrosplenial cortex and caudate nucleus showed augmented signal changes compared with controls, while the right hippocampus/parahippocampus signal intensity decreased in controls but did not change in the OSA subjects. In addition, there were significant increases in grey matter volume in the left mid-insula, the right insula, left and right primary motor cortices, left premotor cortex, left hippocampus and within the brainstem and cerebellum, and significant decreases in the mPFC, occipital lobe, right posterior cingulate cortex, left cerebellar cortex and the left and right amygdala in OSA, but there was no overlap between these structural changes and the functional changes in OSA. These data suggest that the elevated muscle vasoconstrictor drive in OSA may result from functional changes within these brain regions, which are known to be directly or indirectly involved in the modulation of sympathetic outflow via the brainstem. That there was no overlap in the structural and functional changes suggests that asphyxic damage due to repeated episodes of nocturnal obstructive apnoea is not the main cause of the sympathoexcitation.

Keywords: Microneurography; Muscle sympathetic nerve activity; Obstructive sleep apnoea; fMRI.


Figures

Fig. 1
Fig. 1
Multiunit recording of muscle sympathetic nerve activity (MSNA) from a 50-year-old male patient with obstructive sleep apnoea (OSA) and a 42 year-old male healthy control subject. The mean-voltage neurogram is shown in the nerve RMS (root mean square) trace; this was used to quantify the number of sympathetic bursts. Four consecutive sets of the 4 s-ON and 4 s-OFF scanning sequences are shown; the black areas represent the scanning artefacts. MSNA burst amplitudes were measured during the OFF periods. Heart rate was calculated from a piezoelectric pulse transducer on the fingerpad; respiration was monitored via a piezoelectric transducer around the abdomen. Note the higher level of MSNA in the OSA patient; the control subject was a fit individual with low resting heart and respiratory rates.
Fig. 2
Fig. 2
Brain regions in which BOLD signal intensity (SI) changes were significantly correlated to muscle sympathetic nerve activity (MSNA) pattern at rest. Hot colour scale represents regions in which signal intensity increased during MSNA bursts. Significant clusters are overlaid onto a mean T1-weighted anatomical template image. The dark shading indicates brain regions not included in the analysis. Slice location in Montreal Neurological Institute space is indicated at the lower right of each image. dlPFC: dorsolateral prefrontal cortex; MCC: mid-cingulate cortex.
Fig. 3
Fig. 3
Brain regions in which BOLD signal intensity changes correlated to muscle sympathetic nerve activity (MSNA) were significantly different in controls compared with subjects with obstructive sleep apnoea (OSA). Hot colour scale indicates regions in which signal intensity changes were greater in OSA subjects compared with controls. Significant clusters are overlaid onto a T1-weighted anatomical template image. The dark shading indicates brain regions not included in the analysis. Slice location in Montreal Neurological Institute space is indicated at the lower right of each image. ACC: anterior cingulate cortex, dlPFC: dorsolateral prefrontal cortex; mPFC: medial prefrontal cortex; RSC: retrosplenial cortex.
Fig. 4
Fig. 4
Plots of percentage change in BOLD signal intensity during periods of MSNA compared with periods of no MSNA in brain regions identified as being significantly different in subjects with obstructive sleep apnoea (OSA) compared with controls. Note that in all regions except for the hippocampus, signal intensity increased in OSA subjects (grey bars) and did not change or decreased modestly in controls (white bars). In the hippocampus, signal intensity decreased dramatically in controls and did not change in OSA subjects. ACC: anterior cingulate cortex, dlPFC: dorsolateral prefrontal cortex, mPFC: medial prefrontal cortex.
Fig. 5
Fig. 5
Brain regions in which grey matter volume (GM) was significantly different in subjects with obstructive sleep apnoea (OSA) compared with controls. Hot colour scale indicates increases in grey matter volume in OSA subjects compared with controls at a corrected statistical threshold (p < 0.05). Cool colour scale indicates decreases in grey matter volume in OSA subjects compared with controls at a more liberal uncorrected statistical threshold (p < 0.001). Significant clusters are overlaid onto a T1-weighted anatomical template image. Slice location in Montreal Neurological Institute space is indicated at the lower right of each image. M1: primary motor cortex; mPFC: medial prefrontal cortex; PCC: posterior cingulate cortex.

References

    1. Ashburner J., Friston K.J. Voxel-based morphometry — the methods. Neuroimage. 2000;11:805–821. 10860804 - PubMed
    1. Ashburner J., Friston K.J. Unified segmentation. Neuroimage. 2005;26:839–851. 15955494 - PubMed
    1. Beissner F., Meissner K., Bär K.-J., Napadow V. The autonomic brain: an activation likelihood estimation meta-analysis for central processing of autonomic function. Journal of Neuroscience: the Official Journal of the Society for Neuroscience. 2013;33:10503–10511. 23785162 - PMC - PubMed
    1. Canessa N., Castronovo V., Cappa S.F., Aloia M.S., Marelli S., Falini A., Alemanno F., Ferini-Strambi L. Obstructive sleep apnea: brain structural changes and neurocognitive function before and after treatment. American Journal of Respiratory and Critical Care Medicine. 2011;183:1419–1426. 21037021 - PubMed
    1. Carlson J.T., Hedner J.A., Sellgren J., Elam M., Wallin B.G. Depressed baroreflex sensitivity in patients with obstructive sleep apnea. American Journal of Respiratory and Critical Care Medicine. 1996;154:1490–1496. 8912770 - PubMed

Publication types