Case Reports
. 2014 Sep 23:6:320-6.
doi: 10.1016/j.nicl.2014.09.012. eCollection 2014.

The circuitry of abulia: insights from functional connectivity MRI

Affiliations
Case Reports

The circuitry of abulia: insights from functional connectivity MRI

J S Siegel et al. Neuroimage Clin. .

Abstract

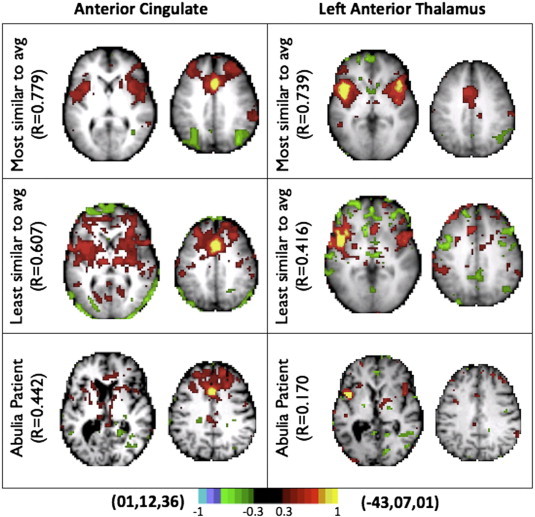
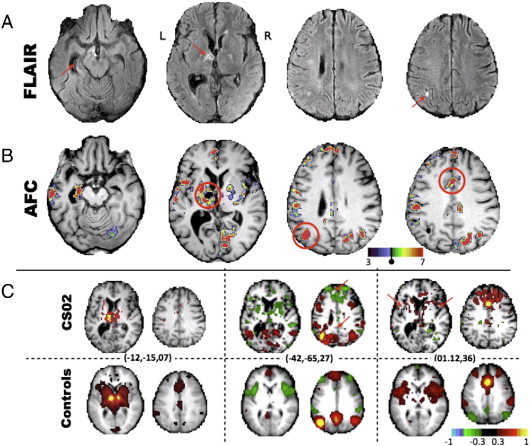
Background: Functional imaging and lesion studies have associated willed behavior with the anterior cingulate cortex (ACC). Abulia is a syndrome characterized by apathy and deficiency of motivated behavior. Abulia is most frequently associated with ACC damage, but also occurs following damage to subcortical nuclei (striatum, globus pallidus, thalamic nuclei). We present resting state functional connectivity MRI (fcMRI) data from an individual who suffered a stroke leading to abulia. We hypothesized that, although structural imaging revealed no damage to the patient's ACC, fcMRI would uncover aberrant function in this region and in the relevant cortical networks.

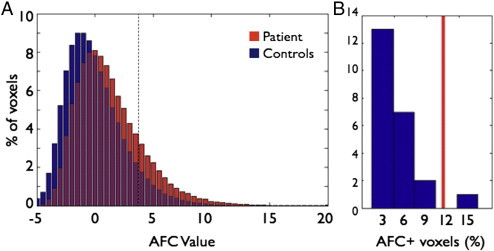
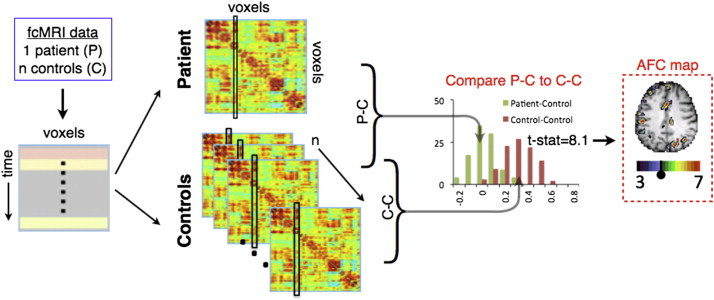
Methods: Resting state correlations in the patient's gray matter were compared to those of age-matched controls. Using a novel method to identify abnormal patterns of functional connectivity in single subjects, we identified areas and networks with aberrant connectivity.

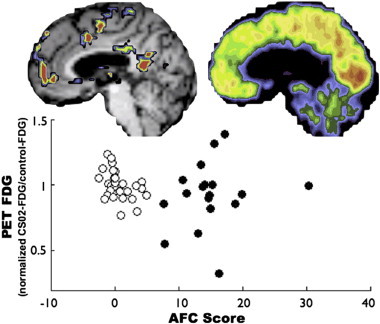
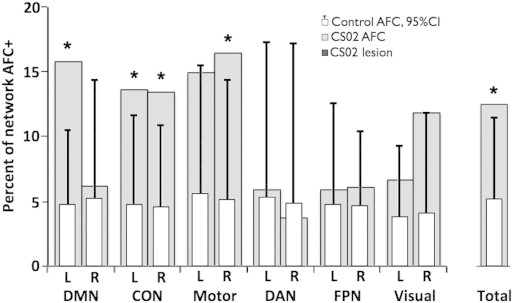
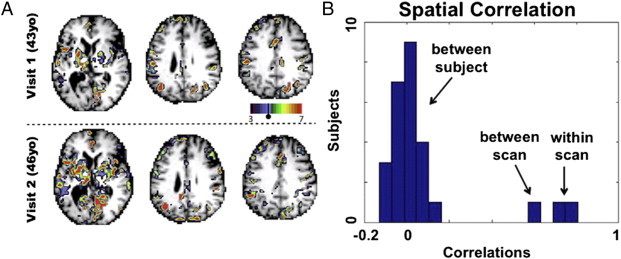
Results: Networks associated with memory (default mode network) and executive function (cingulo-opercular network) were abnormal. The patient's anterior cingulate was among the areas showing aberrant functional connectivity. In a rescan 3 years later, deficits remained stable and fcMRI findings were replicated.

Conclusions: These findings suggest that the aberrant functional connectivity mapping approach described may be useful for linking stroke symptoms to disrupted network connectivity.

Keywords: Abulia; Anterior cingulate; Executive function; Functional connectivity; apathy; fMRI.


Figures

Fig. S1
Fig. S1
AFC t-value distribution in CS02 and in the 23 controls. Both figures use CS02's AFC scores averaged between the initial scan and revisit. A) Negative values indicate that the patient−control difference is less than the control–control difference and thus are essentially meaningless. Positive values above t = 4.8 indicate voxels for which the patient−control difference is significantly greater than the control–control difference. As expected we see a skew to the right. A test that CS02's AFC distribution showed a greater degree of rightward skewness than controls trended towards significance (p = 0.0565, df = 23). B) Histogram of the total percent of voxels that surpass t = 4.8 (indicated by the dashed line in A) in the 23 controls and in CS02 (red line). CS02 has a greater number of AFC+ voxels than 22 of the 23 controls.
Fig. S2
Fig. S2
AFC scores did not correlate with regional glucose metabolism. The open circles represent PET FDG values in CS02 in a set of canonical ROIs (Brier et al., 2012) excluding those overlapping structural lesions and positive AFC values. The PET FDG values have been normalized such that a value of 1 represents the mean in a separate cohort of 33 control subjects. The black circles represent 18 AFC peak ROIs. Note no correlation between increased AFC and glucose metabolism.
Fig. S3
Fig. S3
Individual correlation maps, obtained with the ACC seed used in the right panel of Fig. 1C. On top is the control subject closest to the mean, below is the control subject furthest from the mean, CS02 is on the bottom. CS02 falls outside the range defined by the control group.
Fig. 1
Fig. 1
AFC methodology schematic. fcMRI data are acquired, preprocessed, and registered to atlas space. For each subject, a correlation matrix is produced comparing every gray matter voxel to every other gray matter voxel. Each column of the matrix represents one voxel's full connectivity map. Next, every correlation matrix is compared to every other correlation matrix, column-by-column using spatial correlations, producing an (n + 1) × (n + 1) similarity matrix for each gray matter voxel. For each voxel, a Student t-test is computed to determine if 23 P−C similarity values (green) fell outside of the distribution of the n(n − 1) / 2 or 253 C−C similarity values (brown). Finally, the resultant image is overlaid on the patient's anatomical image, creating an aberrant functional connectivity (AFC) map.
Fig. 2
Fig. 2
FLAIR, aberrant functional connectivity (AFC) map, and correlation maps demonstrate lesion−dysfunction relationship and functional connectivity changes. A) FLAIR images with red arrows highlighting a lesion in the left anterior thalamus and micro-infarcts elsewhere. Atrophy of the left hippocampus is also evident. B) AFC map, produced using the aberrant functional connectivity method, demonstrates multiple foci of abnormality. Voxels masked out due to structural damage are shown in black (i.e., the left anterior thalamus). C) Correlation maps demonstrate aberrant functional connectivity. Peaks in the AFC map (circled in B) are used as seeds to generate whole-brain connectivity maps (no lesion mask) for CS02 (top) and average connectivity maps for the 23 controls (bottom). Talairach coordinates for each correlation map are given in parenthesis. Left: a correlation map placed at the center of the lesion in controls illustrates ACC connectivity. CS02 demonstrates the expected absence of functional connectivity. Middle and right: red arrows highlight areas of connectivity dropout in the patient.
Fig. 3
Fig. 3
Left DMN, CON, and motor networks show the largest degree of disruption. Voxels with significant AFC scores are classified based on the seven-network parcellation of Yeo (2011). Networks are additionally split by hemisphere (hemi-networks). In order to account for difference in network sizes, results are displayed as the percent of each network with AFC t-score greater than 4.8. Light gray bars display CS02 AFC results averaged over visits 1 and 2. White bars represent the network breakdown of aberrant functional connectivity in the 23 controls. Error lines represent upper 95% confidence intervals. Asterisks indicate hemi-networks in which CS02 shows disruption outside of the 95% CI of controls. The parcellation includes default mode network (DMN), cingulo-opercular network (CON), motor network, dorsal attention network (DAN), fronto-parietal network (FPN), and visual network. The total percent of AFC+ voxels in the patient and controls is shown in the far right.
Fig. 4
Fig. 4
Reproducibility of AFC maps at 3 year follow up. A) A visual comparison of AFC results from visit 1 and visit 2. The Pearson correlation between AFC maps is 0.5937. B) Pearson correlations for CS02 between AFC maps generated from half scans (‘within scan’) and AFC maps generated 3 years apart (‘between scan’) are shown and spatial correlation between different control subjects' AFC maps (‘between subjects’) is given as a control. Correlations between halves were 0.81 and 0.80 for visits 1 and 2 respectively.

References

    1. Barris R.W., Schuman H.R. Bilateral anterior cingulate gyrus lesions. Syndrome of the anterior cingulate gyri. Neurology. 1953;3:44–52. 13013498 - PubMed
    1. Buckner R.L., Andrews-Hanna J.R., Schacter D.L. The brain's default network: anatomy, function, and relevance to disease. Annals of the New York Academy of Sciences. 2008;1124:1–38. 18400922 - PubMed
    1. Bush G., Luu P., Posner M.I. Cognitive and emotional influences in anterior cingulate cortex. Trends in Cognitive Sciences. 2000;4:215–222. 10827444 - PubMed
    1. Carter A.R. Resting interhemispheric functional magnetic resonance imaging connectivity predicts performance after stroke. Annals of Neurology. 2010;67:365–375. 20373348 - PMC - PubMed
    1. Carter C.S., Botvinick M.M., Cohen J.D. The contribution of the anterior cingulate cortex to executive processes in cognition. Reviews in the Neurosciences. 1999;10:49–57. 10356991 - PubMed

Publication types

LinkOut - more resources