. 2014 Nov;65(21):6251-63.
doi: 10.1093/jxb/eru232. Epub 2014 Jun 13.

Drought adaptation of stay-green sorghum is associated with canopy development, leaf anatomy, root growth, and water uptake

Affiliations

Drought adaptation of stay-green sorghum is associated with canopy development, leaf anatomy, root growth, and water uptake

Andrew K Borrell et al. J Exp Bot. 2014 Nov.

Abstract

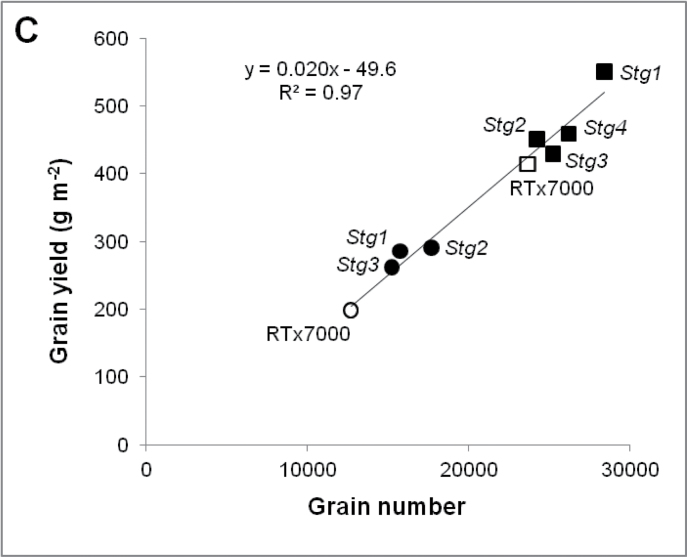
Stay-green sorghum plants exhibit greener leaves and stems during the grain-filling period under water-limited conditions compared with their senescent counterparts, resulting in increased grain yield, grain mass, and lodging resistance. Stay-green has been mapped to a number of key chromosomal regions, including Stg1, Stg2, Stg3, and Stg4, but the functions of these individual quantitative trait loci (QTLs) remain unclear. The objective of this study was to show how positive effects of Stg QTLs on grain yield under drought can be explained as emergent consequences of their effects on temporal and spatial water-use patterns that result from changes in leaf-area dynamics. A set of four Stg near-isogenic lines (NILs) and their recurrent parent were grown in a range of field and semicontrolled experiments in southeast Queensland, Australia. These studies showed that the four Stg QTLs regulate canopy size by: (1) reducing tillering via increased size of lower leaves, (2) constraining the size of the upper leaves; and (3) in some cases, decreasing the number of leaves per culm. In addition, they variously affect leaf anatomy and root growth. The multiple pathways by which Stg QTLs modulate canopy development can result in considerable developmental plasticity. The reduction in canopy size associated with Stg QTLs reduced pre-flowering water demand, thereby increasing water availability during grain filling and, ultimately, grain yield. The generic physiological mechanisms underlying the stay-green trait suggest that similar Stg QTLs could enhance post-anthesis drought adaptation in other major cereals such as maize, wheat, and rice.

Keywords: Canopy development; crop water use; drought adaptation; leaf anatomy; root architecture; sorghum; stay-green..


Figures

Fig. 1.
Fig. 1.
Flowchart of crop physiological processes that determine plant size and crop water use at anthesis, with consequences for water uptake during grain filling. Grey boxes indicate traits that are directly affected by Stg QTLs and white boxes indicate traits for which the effect is an emergent consequence of the effect on the grey box. Up arrows indicate increase; down arrows indicate decrease; side arrows indicate no change.
Fig. 2.
Fig. 2.
The stay-green trait enhances grain yield in sorghum under post-anthesis drought. (A) Relationship between green leaf dry mass at 25 days after anthesis and grain yield in a set of 160 recombinant inbred lines from the cross between BQL39 (senescent) and BQL41 (stay-green), grown during the post-rainy season at Patancheru, India. (B) Grain yield of Stg NILs is enhanced relative to RTx7000 under post-anthesis drought in a rain-out shelter study (WAR04FLD); data are mean±2SE. (C) Grain yield of hybrids from a particular male parent at a particular location plotted against the slope of the relationship between stay-green and yield for the same set of hybrids at that location (Jordan et al., 2012; reprinted by permission, ASA, CSSA, SSSA).
Fig. 2.
Fig. 2.
The stay-green trait enhances grain yield in sorghum under post-anthesis drought. (A) Relationship between green leaf dry mass at 25 days after anthesis and grain yield in a set of 160 recombinant inbred lines from the cross between BQL39 (senescent) and BQL41 (stay-green), grown during the post-rainy season at Patancheru, India. (B) Grain yield of Stg NILs is enhanced relative to RTx7000 under post-anthesis drought in a rain-out shelter study (WAR04FLD); data are mean±2SE. (C) Grain yield of hybrids from a particular male parent at a particular location plotted against the slope of the relationship between stay-green and yield for the same set of hybrids at that location (Jordan et al., 2012; reprinted by permission, ASA, CSSA, SSSA).
Fig. 3.
Fig. 3.
Stg QTLs reduce canopy size at anthesis and increase grain yield. (A) Green leaf area at anthesis versus change in biomass during grain filling (bioGFP). (B) Biomass accumulation during grain filling versus grain number. (C) Grain number versus grain yield for RTx7000 (open circle) and four Stg QTL NILs (filled circles) grown in the field under post-anthesis drought stress in WAR04FLD and for RTx7000 (open square) and four Stg QTL NILs (filled squares) grown in the field under post-anthesis drought stress in WAR05FLD. Data are averaged across replications and two plant densities (modified from Borrell et al., 2014; with permission, Wiley).
Fig. 3.
Fig. 3.
Stg QTLs reduce canopy size at anthesis and increase grain yield. (A) Green leaf area at anthesis versus change in biomass during grain filling (bioGFP). (B) Biomass accumulation during grain filling versus grain number. (C) Grain number versus grain yield for RTx7000 (open circle) and four Stg QTL NILs (filled circles) grown in the field under post-anthesis drought stress in WAR04FLD and for RTx7000 (open square) and four Stg QTL NILs (filled squares) grown in the field under post-anthesis drought stress in WAR05FLD. Data are averaged across replications and two plant densities (modified from Borrell et al., 2014; with permission, Wiley).
Fig. 4.
Fig. 4.
Reduced tillering by Stg QTLs is a constitutive trait. (A, B) Green leaf area at anthesis as a function of culm number m–2 in a set of 34 near-isogenic lines containing single or multiple introgressions of Stg1, Stg2, Stg3, and Stg4 QTLs in a RTx7000 background grown under well-watered (A) and water-limited (B) conditions at BIL02FLD; the parental lines (RTx7000 and BTx642) and NILs containing only single introgressions of Stg1, Stg2, Stg3, and Stg4 are highlighted. (C) Comparison of culms per plant between RTx7000 and the Stg1 NIL under well-watered and water-limited conditions in WAR06FLD; data are mean±2SE. (D, E) The low-tillering phenotype exhibited by the Stg1 NIL (D) relative to RTx7000 (E) in a pot experiment (WAR10POT) (this figure is available in colour at JXB online).
Fig. 4.
Fig. 4.
Reduced tillering by Stg QTLs is a constitutive trait. (A, B) Green leaf area at anthesis as a function of culm number m–2 in a set of 34 near-isogenic lines containing single or multiple introgressions of Stg1, Stg2, Stg3, and Stg4 QTLs in a RTx7000 background grown under well-watered (A) and water-limited (B) conditions at BIL02FLD; the parental lines (RTx7000 and BTx642) and NILs containing only single introgressions of Stg1, Stg2, Stg3, and Stg4 are highlighted. (C) Comparison of culms per plant between RTx7000 and the Stg1 NIL under well-watered and water-limited conditions in WAR06FLD; data are mean±2SE. (D, E) The low-tillering phenotype exhibited by the Stg1 NIL (D) relative to RTx7000 (E) in a pot experiment (WAR10POT) (this figure is available in colour at JXB online).
Fig. 5.
Fig. 5.
Stg1 reduces the size of upper leaves under water deficit. Leaf size distributions of RTx7000 grown under high (open squares) and low (filled squares) densities and Stg1 grown under high (open circles) and low (filled circles) densities in the WAR06FLD rain-out shelter study.
Fig. 6.
Fig. 6.
Stg QTLs reduce green leaf area and transpiration at anthesis. Transpiration per plant as a function of green leaf area m–2 at anthesis for RTx7000 (open circle) and four Stg NILs (filled circles) grown under low vapour pressure deficit (VPD) and RTx7000 (open square) and four Stg NILs (filled squares) grown under high VPD.
Fig. 7.
Fig. 7.
Stg3 uses less water than RTx7000 before anthesis and more water after anthesis. The temporal pattern of cumulative crop water use for RTx7000 (open squares) and Stg3 (filled squares) grown under the low-water high-density treatment in the WAR05FLD rain-out shelter study. The arrow marks anthesis.
Fig. 8.
Fig. 8.
Stg QTLs modify transpiration per unit leaf area via abaxial stomatal index. The positive correlation between abaxial stomatal index (%) under high-water low-density (HWLD) conditions and transpiration per leaf area (mm cm–2 m–2 × 1000) under low-water low-density conditions (LWLD) for RTx7000 (open diamond) and the Stg NILs (closed diamonds) in the WAR05FLD rain-out shelter study.
Fig. 9.
Fig. 9.
Stg QTLs affect root architecture. (A) Genetic variation for root harvest index in a Stg4 fine-mapping population when harvested at the 5-leaf stage (WAR08POT). The parent of the population, RTx7000, and the Stg4 NIL are indicated. (B) Nodal roots, visible on the glass surface of root chambers, for the parents of the RIL mapping population: SC170-6–8 (wide angle, left panel) and B923296 (narrow angle, right panel). Thick solid lines indicate first flush of nodal roots, dotted lines indicate the vertical plane, and arcs indicate the estimated root angle (from Mace et al., 2012; with kind permission from Springer Science and Business Media: Springer and Oxford University Press, Theoretical and Applied Genetics, 124, 2012, 97–109, QTL for nodal root angle in sorghum (Sorghum bicolor L. Moench) co-locate with QTL for traits associated with drought adaptation, Mace E, Singh V, van Oosterom E, Hammer G, Hunt C, Jordan D, from Fig. 1). (C) Projection of the root angle QTLs onto the sorghum consensus map and comparison with stay-green QTLs identified in previous studies (from Mace et al., 2012; with kind permission from Springer Science and Business Media: Springer and Oxford University Press, Theoretical and Applied Genetics, 124, 2012, 97–109, QTL for nodal root angle in sorghum (Sorghum bicolor L. Moench) co-locate with QTL for traits associated with drought adaptation, Mace E, Singh V, van Oosterom E, Hammer G, Hunt C, Jordan D, from Fig. 4); colour-coded as follows: light blue, Crasta et al. (1999; green, Feltus et al. (2006); dark blue, Haussmann et al. (2002); purple, Kebede et al. (2001); grey, Srinivas et al. (2009); orange, Subudhi et al. (2000); red, Xu et al. (2000).
Fig. 9.
Fig. 9.
Stg QTLs affect root architecture. (A) Genetic variation for root harvest index in a Stg4 fine-mapping population when harvested at the 5-leaf stage (WAR08POT). The parent of the population, RTx7000, and the Stg4 NIL are indicated. (B) Nodal roots, visible on the glass surface of root chambers, for the parents of the RIL mapping population: SC170-6–8 (wide angle, left panel) and B923296 (narrow angle, right panel). Thick solid lines indicate first flush of nodal roots, dotted lines indicate the vertical plane, and arcs indicate the estimated root angle (from Mace et al., 2012; with kind permission from Springer Science and Business Media: Springer and Oxford University Press, Theoretical and Applied Genetics, 124, 2012, 97–109, QTL for nodal root angle in sorghum (Sorghum bicolor L. Moench) co-locate with QTL for traits associated with drought adaptation, Mace E, Singh V, van Oosterom E, Hammer G, Hunt C, Jordan D, from Fig. 1). (C) Projection of the root angle QTLs onto the sorghum consensus map and comparison with stay-green QTLs identified in previous studies (from Mace et al., 2012; with kind permission from Springer Science and Business Media: Springer and Oxford University Press, Theoretical and Applied Genetics, 124, 2012, 97–109, QTL for nodal root angle in sorghum (Sorghum bicolor L. Moench) co-locate with QTL for traits associated with drought adaptation, Mace E, Singh V, van Oosterom E, Hammer G, Hunt C, Jordan D, from Fig. 4); colour-coded as follows: light blue, Crasta et al. (1999; green, Feltus et al. (2006); dark blue, Haussmann et al. (2002); purple, Kebede et al. (2001); grey, Srinivas et al. (2009); orange, Subudhi et al. (2000); red, Xu et al. (2000).

References

    1. Abdulai AL, Parzies H, Kouressy M, Vaksmann M, Asch F, Brueck H. 2012. Yield stability of photoperiod sensitive sorghum (Sorghum bicolor L. Moench) accessions under diverse climatic environments. International Journal of Agricultural Research 7, 17–32.
    1. Alam MM, Hammer GL, van Oosterom EJ, Cruickshank AW, Hunt CH, Jordan DR. 2014. A physiological framework to explain genetic and environmental regulation of tillering in sorghum. New Phytologist 10.1111/nph.12767 - PubMed
    1. Bandaru V, Stewart BA, Baumhardt RL, Ambati S, Robinson CA, Schlegel A. 2006. Growing dryland grain sorghum in clumps to reduce vegetative growth and increase yield. Agronomy Journal 98, 1109–1120.
    1. Bhosale SU, Stich B, Rattunde F, et al. 2012. Association analysis of photoperiodic flowering time genes in West and Central African sorghum [Sorghum bicolor (L.) Moench]. BMC Plant Biology 12, 32. - PMC - PubMed
    1. Boffa JM, Taonda SJB, Dickey JB. 2000. Field-scale influence of karite (Vitellaria paradoxa) on sorghum production in the Sudan zone of Burkina Faso. Agroforestry Systems 49, 153–175.