

Deletion of the gene encoding G0/G 1 switch protein 2 (G0s2) alleviates high-fat-diet-induced weight gain and insulin resistance, and promotes browning of white adipose tissue in mice
- PMID: 25381555
- PMCID: PMC5001162
- DOI: 10.1007/s00125-014-3429-z
Deletion of the gene encoding G0/G 1 switch protein 2 (G0s2) alleviates high-fat-diet-induced weight gain and insulin resistance, and promotes browning of white adipose tissue in mice
Abstract
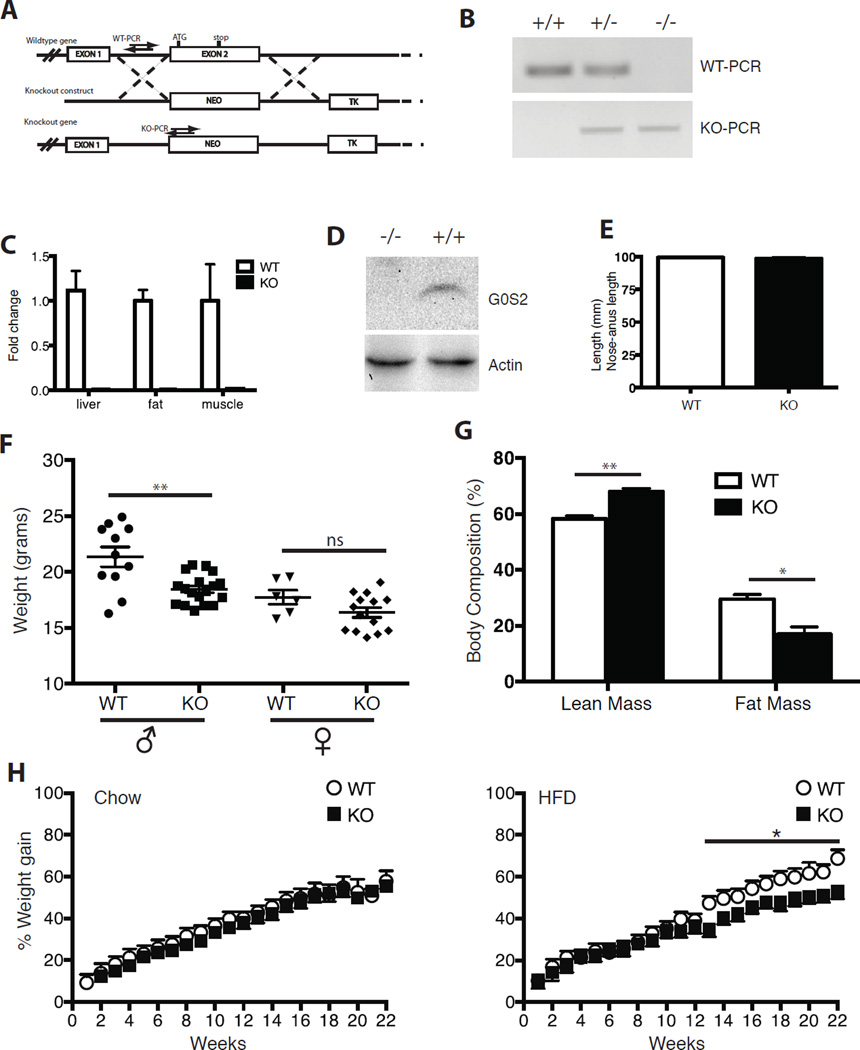
Aims/hypothesis: Obesity is a global epidemic resulting from increased energy intake, which alters energy homeostasis and results in an imbalance in fat storage and breakdown. G0/G1 switch gene 2 (G0s2) has been recently characterised in vitro as an inhibitor of adipose triglyceride lipase (ATGL), the rate-limiting step in fat catabolism. In the current study we aim to functionally characterise G0s2 within the physiological context of a mouse model.
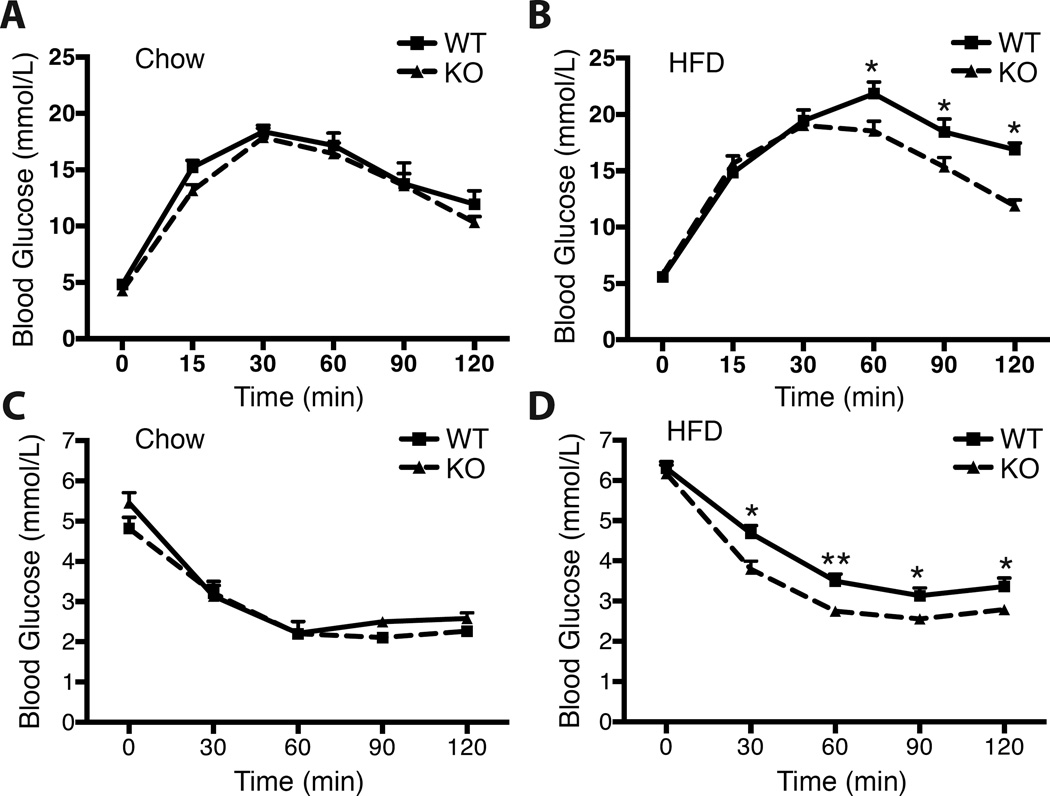
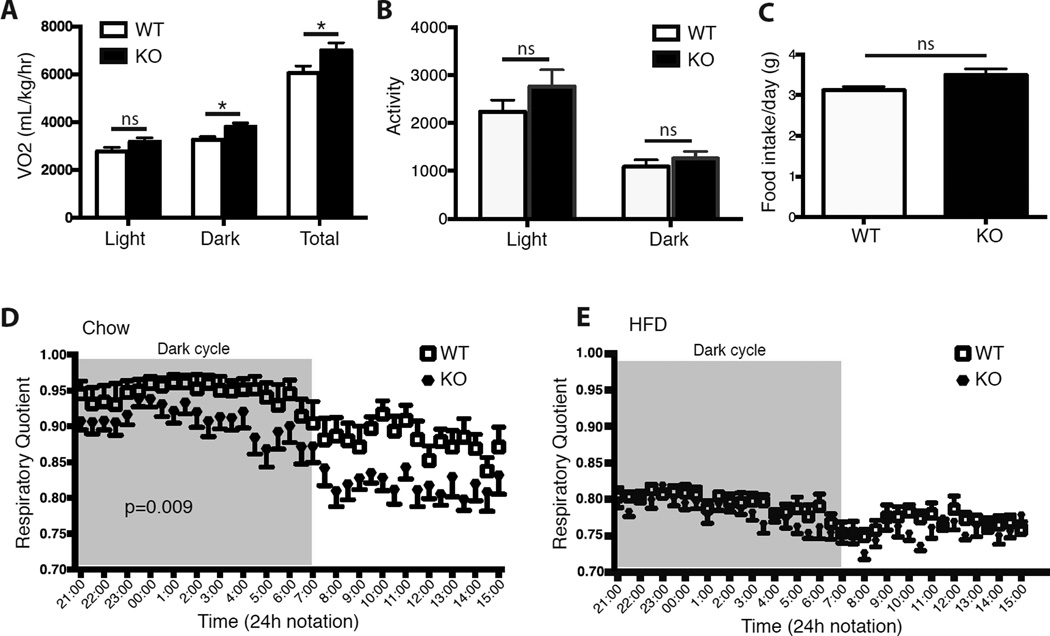
Methods: We generated a mouse model in which G0s2 was deleted. The homozygous G0s2 knockout (G0s2 (-/-)) mice were studied over a period of 22 weeks. Metabolic variables were measured including body weight and body composition, food intake, glucose and insulin tolerance tests, energy metabolism and thermogenesis.
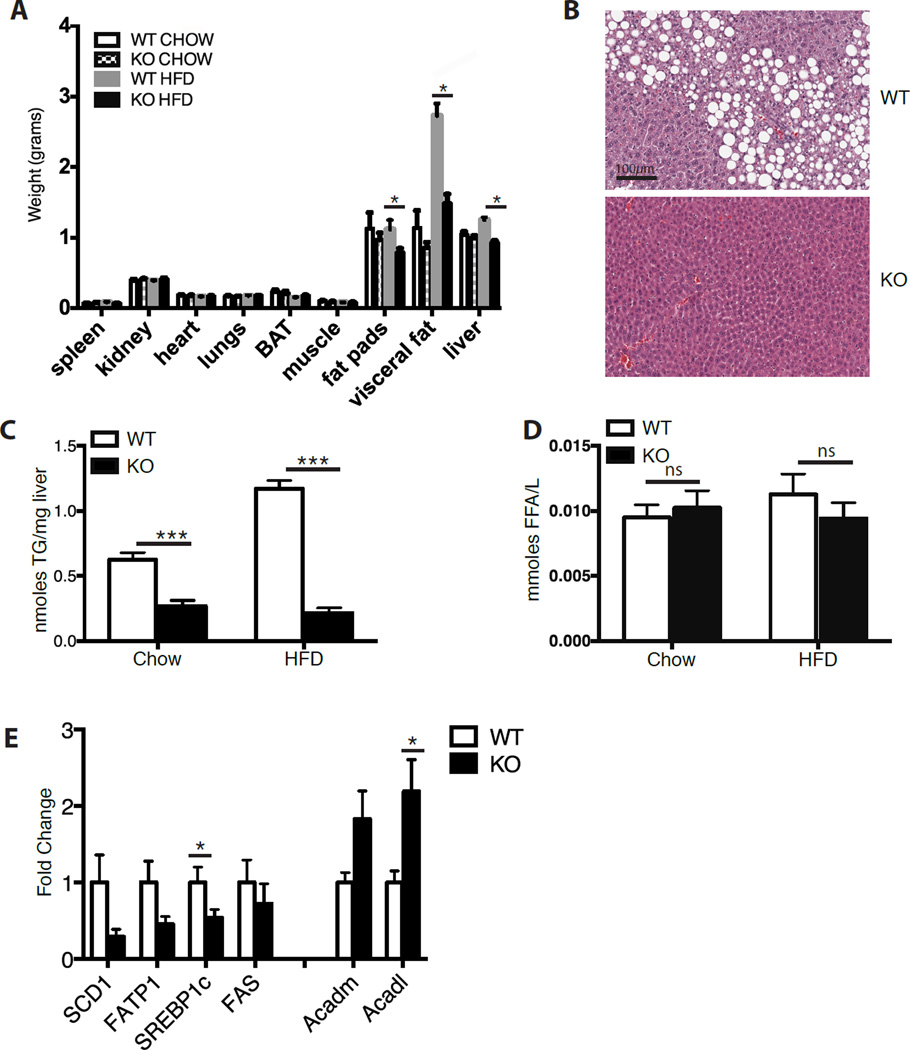
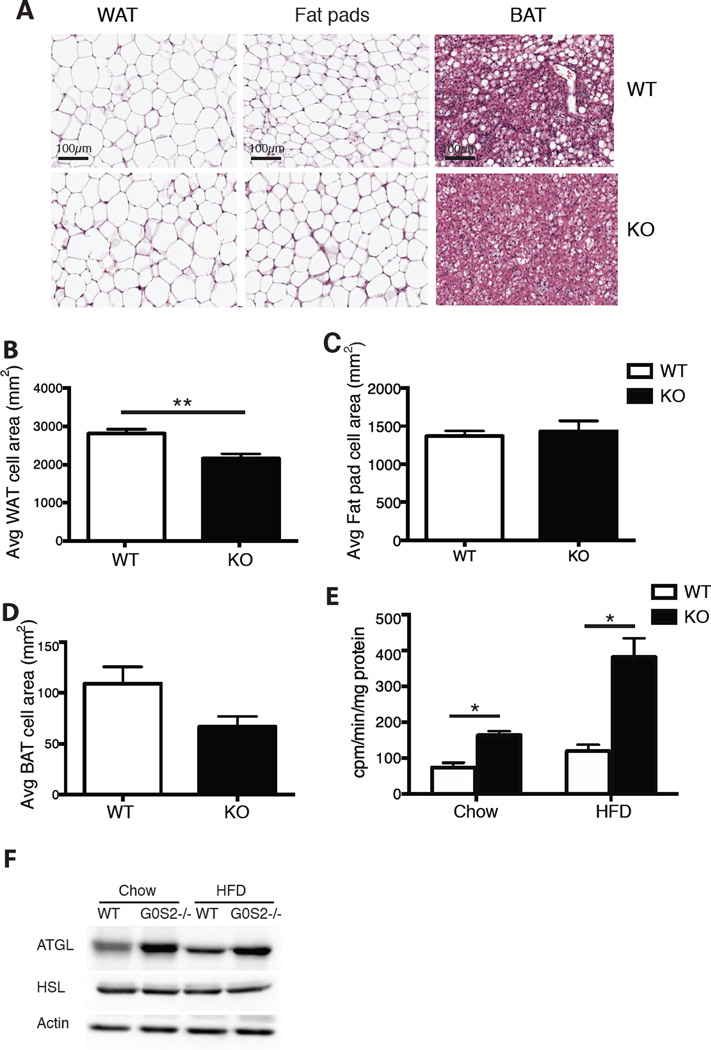
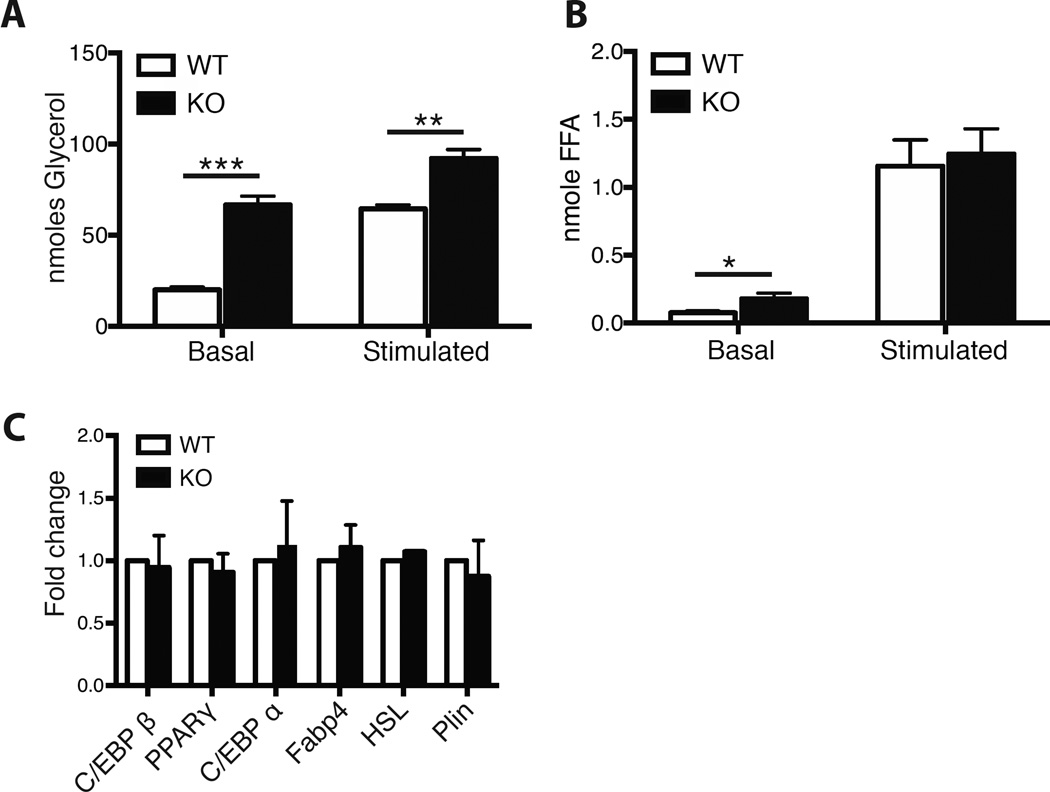
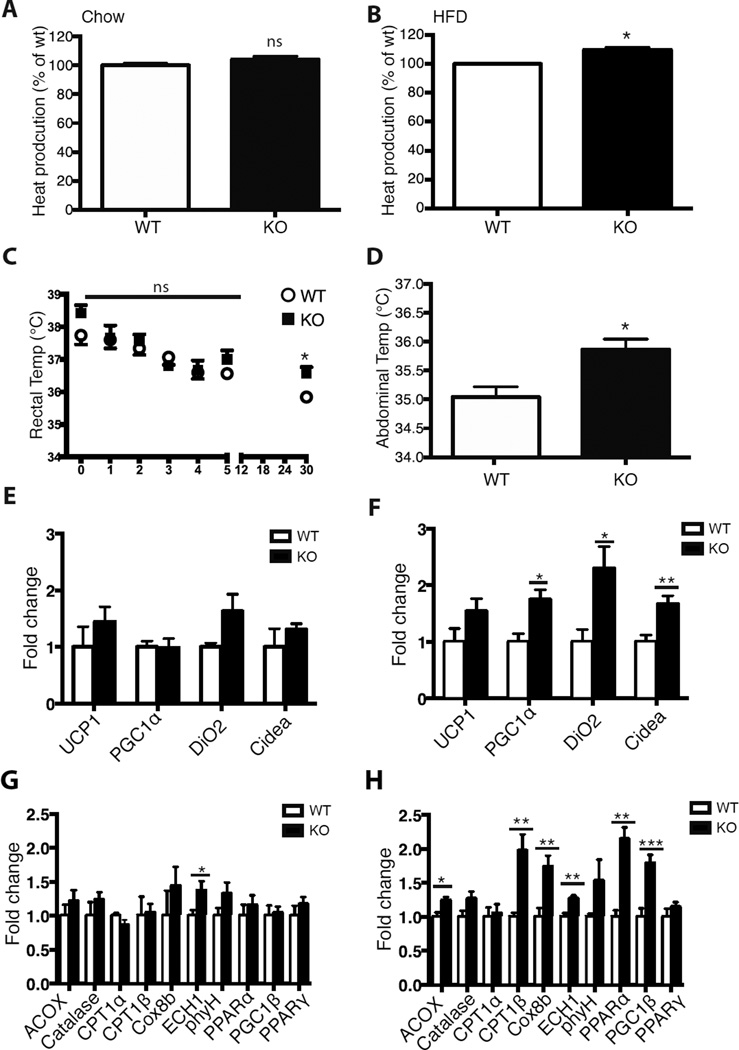
Results: We report that G0s2 inhibits ATGL and regulates lipolysis and energy metabolism in vivo. G0s2 (-/-) mice are lean, resistant to weight gain induced by a high-fat diet and are glucose tolerant and insulin sensitive. The white adipose tissue of G0s2 (-/-) mice has enhanced lipase activity and adipocytes showed enhanced stimulated lipolysis. Energy metabolism in the G0s2 (-/-) mice is shifted towards enhanced lipid metabolism and increased thermogenesis. G0s2 (-/-) mice showed enhanced cold tolerance and increased expression of thermoregulatory and oxidation genes within white adipose tissue, suggesting enhanced 'browning' of the white adipose tissue.
Conclusions/interpretation: Our data show that G0s2 is a physiological regulator of adiposity and energy metabolism and is a potential target in the treatment of obesity and insulin resistance.
Figures
Comment in
-
The sparing use of fat: G0s2 controls lipolysis and fatty acid oxidation.Diabetologia. 2015 Jan;58(1):7-9. doi: 10.1007/s00125-014-3430-6. Epub 2014 Oct 29. Diabetologia. 2015. PMID: 25351607 No abstract available.
References
-
- Miranda PJ, DeFronzo RA, Califf RM, Guyton JR. Metabolic syndrome: definition, pathophysiology, and mechanisms. American heart journal. 2005;149:33–45. - PubMed
-
- Reaven GM. Banting lecture 1988. Role of insulin resistance in human disease. Diabetes. 1988;37:1595–1607. - PubMed
-
- Jenkins CM, Mancuso DJ, Yan W, Sims HF, Gibson B, Gross RW. Identification, cloning, expression, and purification of three novel human calcium-independent phospholipase A2 family members possessing triacylglycerol lipase and acylglycerol transacylase activities. The Journal of biological chemistry. 2004;279:48968–48975. - PubMed
-
- Villena JA, Roy S, Sarkadi-Nagy E, Kim KH, Sul HS. Desnutrin, an adipocyte gene encoding a novel patatin domain-containing protein, is induced by fasting and glucocorticoids: ectopic expression of desnutrin increases triglyceride hydrolysis. The Journal of biological chemistry. 2004;279:47066–47075. - PubMed
-
- Zimmermann R, Strauss JG, Haemmerle G, et al. Fat mobilization in adipose tissue is promoted by adipose triglyceride lipase. Science. 2004;306:1383–1386. - PubMed
Publication types
MeSH terms
Substances
Grants and funding
LinkOut - more resources
Full Text Sources
Other Literature Sources
Molecular Biology Databases
