. 2015 Jul;33(7):707-22.
doi: 10.1007/s40273-014-0230-2.

Savings in Medical Expenditures Associated with Reductions in Body Mass Index Among US Adults with Obesity, by Diabetes Status

Affiliations

Savings in Medical Expenditures Associated with Reductions in Body Mass Index Among US Adults with Obesity, by Diabetes Status

John Cawley et al. Pharmacoeconomics. 2015 Jul.

Abstract

Background: The prevalence of obesity has more than doubled in the USA in the past 30 years. Obesity is a significant risk factor for diabetes, cardiovascular disease, and other clinically significant co-morbidities. This paper estimates the medical care cost savings that can be achieved from a given amount of weight loss by people with different starting values of body mass index (BMI), for those with and without diabetes. This information is an important input into analyses of the cost effectiveness of obesity treatments and prevention programs.

Methods: Two-part models of instrumental variables were estimated using data from the Medical Expenditure Panel Survey (MEPS) for 2000-2010. Models were estimated for all adults as well as separately for those with and without diabetes. We calculated the causal impact of changes in BMI on medical care expenditures, cost savings for specific changes in BMI (5, 10, 15, and 20 %) from starting BMI levels ranging from 30 to 45 kg/m(2), as well as the total excess medical care expenditures caused by obesity.

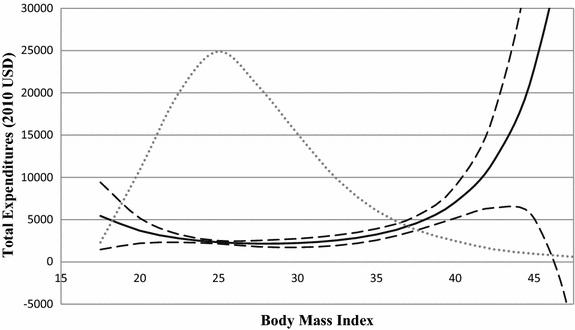
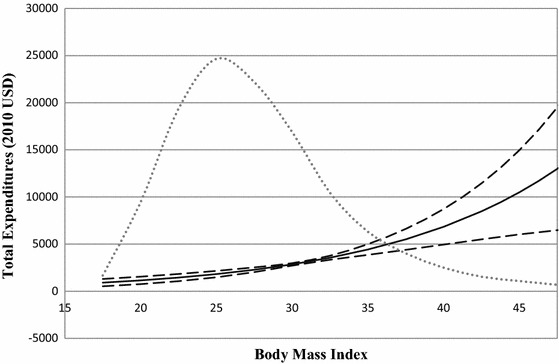
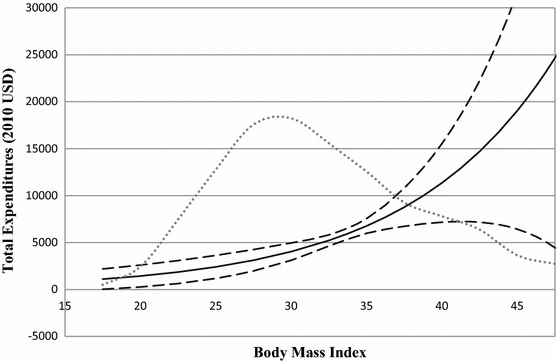
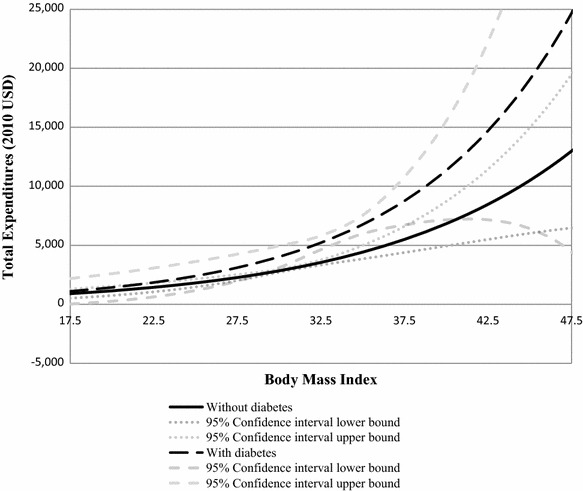
Results: In the USA, adult obesity raised annual medical care costs by $US3,508 per obese individual, for a nationwide total of $US315.8 billion (year 2010 values). However, the relationship of medical care costs over BMI is J-shaped; costs rise exponentially in the range of class 2 and 3 obesity (BMI ≥35). The heavier the obese individual, the greater the reduction in medical care costs associated with a given percent reduction in BMI. Medical care expenditures are higher, and rise more with BMI, among individuals with diabetes than among those without diabetes.

Conclusions: The savings from a given percent reduction in BMI are greater the heavier the obese individual, and are greater for those with diabetes than for those without diabetes. The results provide health insurers, employers, government agencies, and health economists with accurate estimates of the change in medical care expenditures resulting from weight loss, which is important information for calculating the cost effectiveness of interventions to prevent and treat obesity.


Figures

Fig. 1
Fig. 1
Predicted total annual medical expenditures from the instrumental variables model. Data: Medical Expenditure Panel Survey (MEPS) 2000–2010 [18]. Expenditures are in $US, year 2010 values. Dashed lines represent 95 % confidence intervals, which have been adjusted for the complex design of the MEPS. Medical expenditures are denoted by the solid line and are measured on the left axis. The dotted line indicates the distribution of individuals in the population
Fig. 2
Fig. 2
Predicted total annual medical expenditures from the instrumental variables model for those without type 2 diabetes. Data: Medical Expenditure Panel Survey (MEPS) 2000–2010 [18]. Expenditures are in $US, year 2010 values. Dashed lines represent 95 % confidence intervals, which have been adjusted for the complex design of the MEPS. Medical expenditures are denoted by the solid line and are measured on the left axis. The dotted line indicates the distribution of individuals in the population
Fig. 3
Fig. 3
Predicted total annual medical expenditures from the instrumental variables model for those with type 2 Diabetes. Data: Medical Expenditure Panel Survey (MEPS) 2000–2010 [18]. Expenditures are in $US, year 2010 values. Dashed lines represent 95 % confidence intervals, which have been adjusted for the complex design of the MEPS. Medical expenditures are denoted by the solid line and are measured on the left axis. The dotted line indicates the distribution of individuals in the population
Fig. 4
Fig. 4
Predicted total annual medical expenditures from the instrumental variables model. Data: Medical Expenditure Panel Survey (MEPS) 2000–2010 [18]. Expenditures are in $US, year 2010 values. Dashed lines represent 95 % confidence intervals, which have been adjusted for the complex design of the MEPS. Medical expenditures are denoted by the solid line and are measured on the left axis. The dotted line indicates the distribution of individuals in the population

References

    1. Burkhauser RV, Cawley J, Schmeiser MD. The timing of the rise in U.S. obesity varies with measure of fatness. Econ Hum Biol. 2009;7(3):307–318. doi: 10.1016/j.ehb.2009.07.006. - DOI - PubMed
    1. Ogden CL, Carroll MD, Kit BK, Flegal KM. Prevalence of childhood and adult obesity in the United States, 2011–2012. JAMA. 2014;311(8):806–814. doi: 10.1001/jama.2014.732. - DOI - PMC - PubMed
    1. Guh DP, Zhang W, Bansback N, Amarsi Z, Birmingham CL, Anis AH. The incidence of co-morbidities related to obesity and overweight: a systematic review and meta-analysis. BMC Public Health. 2009;9:88. doi: 10.1186/1471-2458-9-88. - DOI - PMC - PubMed
    1. Dixon JB. The effect of obesity on health outcomes. Mol Cell Endocrinol. 2010;316(2):104–108. doi: 10.1016/j.mce.2009.07.008. - DOI - PubMed
    1. Hu FB. Obesity epidemiology. New York: Oxford University Press; 2008.

Publication types