. 2015 Jan;77(1):75-99.
doi: 10.1002/ana.24304. Epub 2014 Nov 27.

Targeting miR-155 restores abnormal microglia and attenuates disease in SOD1 mice

Affiliations

Targeting miR-155 restores abnormal microglia and attenuates disease in SOD1 mice

Oleg Butovsky et al. Ann Neurol. 2015 Jan.

Erratum in

Abstract

Objective: To investigate miR-155 in the SOD1 mouse model and human sporadic and familial amyotrophic lateral sclerosis (ALS).

Methods: NanoString microRNA, microglia and immune gene profiles, protein mass spectrometry, and RNA-seq analyses were measured in spinal cord microglia, splenic monocytes, and spinal cord tissue from SOD1 mice and in spinal cord tissue of familial and sporadic ALS. miR-155 was targeted by genetic ablation or by peripheral or centrally administered anti-miR-155 inhibitor in SOD1 mice.

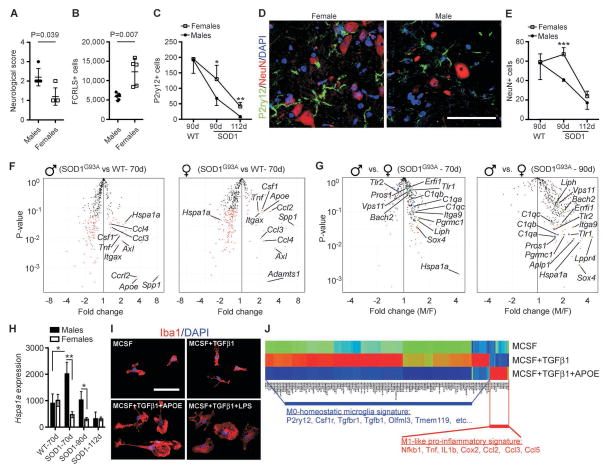
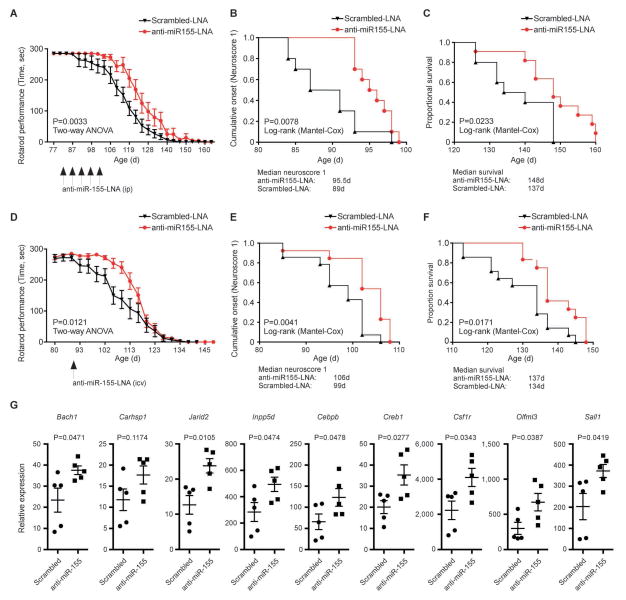
Results: In SOD1 mice, we found loss of the molecular signature that characterizes homeostatic microglia and increased expression of miR-155. There was loss of the microglial molecules P2ry12, Tmem119, Olfml3, transcription factors Egr1, Atf3, Jun, Fos, and Mafb, and the upstream regulators Csf1r, Tgfb1, and Tgfbr1, which are essential for microglial survival. Microglia biological functions were suppressed including phagocytosis. Genetic ablation of miR-155 increased survival in SOD1 mice by 51 days in females and 27 days in males and restored the abnormal microglia and monocyte molecular signatures. Disease severity in SOD1 males was associated with early upregulation of inflammatory genes, including Apoe in microglia. Treatment of adult microglia with apolipoprotein E suppressed the M0-homeostatic unique microglia signature and induced an M1-like phenotype. miR-155 expression was increased in the spinal cord of both familial and sporadic ALS. Dysregulated proteins that we identified in human ALS spinal cord were restored in SOD1(G93A) /miR-155(-/-) mice. Intraventricular anti-miR-155 treatment derepressed microglial miR-155 targeted genes, and peripheral anti-miR-155 treatment prolonged survival.

Interpretation: We found overexpression of miR-155 in the SOD1 mouse and in both sporadic and familial human ALS. Targeting miR-155 in SOD1 mice restores dysfunctional microglia and ameliorates disease. These findings identify miR-155 as a therapeutic target for the treatment of ALS.


Conflict of interest statement

Potential conflicts of interest

Brigham’s and Women Hospital has a patent on the use of miR-155 inhibitors as a therapy for ALS.

Figures

Figure 1
Figure 1. The unique molecular signature that characterizes microglia is lost in SOD1G93A mice
(A) Heatmap of significantly affected 78 enriched and unique microglial genes P<0.05, Student’s t test, 2-tailed. (B) Gene expression of selected microglial specific molecules as measured by MG400 chip. (C) qPCR validation of P2ry12, Tgfb1, Tgfbr1 and Apoe genes. Bars show mean ± s.e.m (n = 5). Shown is one representative of two individual experiments. (D) Representative immunofluorescent images of P2ry12+ resident microglia, NeuN+ neurons co-stained with nuclear staining (DAPI) in ventral horn of WT and SOD1G93A mice at end-stage. Scale bars represent 50 μm. (E) IPA analysis shows inhibition of TGFβ pathway related molecules in spinal cord microglia from SOD1 mice at end-stage. For each molecule in the dataset the expression fold change as compared to spinal cord microglia from WT littermates is presented. Legend shows prediction state and relationships.
Figure 2
Figure 2. Identification of molecular signature in human lumbar ventral horn from ALS subjects
(A) qPCR validation of miR-155. Relative expression in HC (black circles), sALS (black squares) and fALS (red squares) were calculated using the comparative Ct (2-ΔΔCt) method. miRNA expression level was normalized against U6 miRNA. PCRs were run in triplicates per subject. Each data point represents an individual subject. (B) qPCR validation of upregulated APOE, APOD and APOC1 genes. (C) qPCR validation of downregulated miR-155 direct gene targets CSF1R and JARID2. (D) qPCR validation of downregulated microglia specific ENTPD1 and P2RY12 genes. PCRs were run in triplicates per subject. Each data point represents an individual subject. Horizontal bars denote mean ± s.d. Statistical analysis by Student’s t test, 2-tailed. (E) Apolipoproteins relative expression as measured by TMT-quantitative proteomics (see Supplementary Table 6). *P<0.05, **P<0.01, ***P<0.01, Student’s t test, 2-tailed. (F) Western blot analysis of APOE in human lumbar spinal cords. (G) Immunohistochemical analysis of APOE in human ventral horn spinal cord from HC, fALS and sALS subjects.
Figure 3
Figure 3. Genetic ablation of miR-155 delays disease onset and extends survival in SOD1 mice
(A) Kaplan-Meier analysis of the probability of surviving as function of age in SOD1/miR-155+/− and SOD1/miR-155−/− mice. Mantel-Cox’s F-test comparison showed prolonged survival by 51 days (P < 0.0001) in SOD1/miR-155−/− (n = 10) vs. SOD1/miR-155+/− (n = 10) female and prolonged survival by 27 days (P < 0.0001) in SOD1/miR-155−/− (n = 10) vs. SOD1/miR-155+/− (n = 9) male mice. (B) Time-to-event analysis for disease neurologic onset (neurological severity score of 1 and 2). Of note, neurologic scores 1 and 2 were based on the Prize4Life ‘Working with ALS Mice’ guidelines. (C) Rotarod performance as a function of age in female and male mice. Data represent mean ± s.e.m. (D) Weight loss plotted for SOD1/miR-155+/− and SOD1/miR-155−/− female and male mice. Data represent mean ± s.e.m. (E) Duration of an early disease phase (drop of 5% of the mouse maximal weight) and a later disease phase (from 5% weight loss to end-stage) in females (E) and males (F). Data represent mean ± s.e.m. Student’s t test, 2-tailed. (G) Cumulative results of statistical analysis of SOD1G93A/miR-155−/+ and SOD1G93A/miR-155−/− groups in females and male mice.
Figure 4
Figure 4. Gender differences in SOD1 mice
(A) Neurologic score in B6/SJL-SOD1G93A males and females mice at 112 days of age. (B) Absolute numbers of sorted FCRLS+ microglia from spinal cord of SOD1 males (n = 5) and females (n =5) at 112d of age. Student’s t test, 2-tailed. (C) Quantitative analysis of P2ry12+ microglia. (D) Representative immunofluorescent images of P2ry12+ microglia and NeuN+ neurons co-stained with nuclear staining (DAPI) in lumbar level ventral horn from SOD1G93A female and male mice at 112d of age. Scale bars represent 60 μm. (E) Quantitative analysis of NeuN+ neurons in ventral horn lumbar level from WT and SOD1 males (n = 5) vs. females (n =5) at 90d and 112d of age. Data represents mean ± s.e.m. *P < 0.05, **P < 0.01, ***P < 0.001, by factorial ANOVA and Fisher’s post hoc test. (F) Volcano plots based on Nanostring MG400 expression data from SOD1 spinal cord sorted FCRLS+ microglia. Red dots show significantly affected genes (p<0.05 by Student’s t test, 2-tailed). (G) Volcano plots based on Nanostring gene expression data from SOD1 spinal cord sorted FCRLS+ microglia (see complete gene expression data in Supplementary Table 9). (H) Hspa1a gene expression based on Nanostring MG400 chip analysis. (I) Representative confocal images of adult spinal cord microglia stained with Iba1 and DAPI. Microglia were cultured for 5 days in the presence of MCSF or MCSF+TFGβ1 and treated for additional 24h with recombinant APOE (100ng/ml) or LPS (100ng/ml). Similar results were obtained in five independent experiments. (J) Heatmap of significantly affected microglial genes based on Nanostring MG400 expression profile in WT cultured adult microglia treated with MCSF, TGFB1 and APOE (complete gene expression data show in Supplementary Table 12). Each lane represents mean of two different experiments with pooled spinal cord microglia (n = 5 mice per group).
Figure 5
Figure 5. Genetic ablation of miR-155 reverses the abnormal microglia gene/miRNA signature and functions in SOD1 mice
(A) Representative FACS analysis of spinal cord-derived mononuclear cells stained with FCRLS (resident microglia) and CD11b (myeloid cells). Note, increased number of FCRLS/CD11b+ cells in SOD1/miR155+/+ (n = 3) or SOD1/miR155+/− (n = 5) in comparison to SOD1/miR155−/− (n = 5) mice. (B) Absolute number of sorted cells per spinal cord. (C) Quantification of NeuN+ cells in ventral horn of WT non-Tg/miR-155+/+ (n = 4) at age of 117d, SOD1/miR-155+/− (n = 4) and SOD1/miR155−/− (n = 4) mice. Data represents mean ± s.d. Student’s t test, 2-tailed. Nanostring inflammation chip analysis in (D) spinal cord microglia and (E) splenic Ly6CHi monocytes. (F) MG400 profile in spinal cord microglia. (G) Top-50 dysregulated microglial genes are shown. Bars show fold difference vs. Non-Tg/miR-155+/− mice. (H) miRNA profile in spinal cord microglia. (I) 41 dysregulated miRNAs are shown. Bars show fold difference vs. Non-Tg/miR-155+/− mice. For complete gene/miRNA data see Supplementary Table 10. Data are representative of three different experiments with cells pooled from Non-Tg/miR-155+/− (n = 4), SOD1/miR-155+/− (n = 5) and SOD1/miR155−/− (n = 5) female mice. Heatmap and hierarchical clustering shows dysregulated genes of at least two fold.
Figure 6
Figure 6. Genetic ablation of miR-155 prevents M1-polarization in spinal cord microglia from SOD1 mice
(A) Representative immunihistochemical micrographs of lumbar spinal cords of Non-Tg/miR-155−/−, SOD1/miR-155+/− and SOD1/miR-155−/− female mice (n = 4) at 117 days of age. Scale bars represent 50 μm. (B) Quantification of immunoreactive cells in the entire anterior horn (grey matter) and the adjacent anterior column (white matter). Values represent cells/mm2 (mean ± s.e.m) (one-way ANOVA; Kruskal-Wallis multiple comparisons test).
Figure 7
Figure 7. Genetic ablation of miR-155 derepresses targeted genes in spinal cord microglia from SOD1 mice
(A) Derepressed miR-155-targeted genes in SOD1/miR-155−/− mice. Bars show expression relative to Non-Tg/miR-155+/− female mice (dashed line). (B) Microglial functions in SOD1/miR-155+/− and SOD1/miR-155−/− mice. IPA functional analysis based on early and late downregulated and upregulated genes detected with MG400 chip.
Figure 8
Figure 8. Genetic ablation of miR-155 reverses the abnormal miRNA and proteomic signatures of spinal cord in SOD1 mice
(A) 57 derepressed proteins by at least two-fold in SOD1G93A/miR-155−/− vs. SOD1G93A/miR-155+/− female mice. Bars show expression relative to Non-Tg/miR-155+/− female mice. (B) Upregulated proteins in SOD1 mice which are not affected by genetic ablation of miR-155. (C) 56 derepressed miRNAs by at least two-fold in SOD1G93A/miR-155−/− vs. SOD1G93A/miR-155+/− mice. Bars show expression relative to Non-Tg/miR-155+/− mice. For complete protein/miRNA data see Supplementary Table 11.
Figure 9
Figure 9. Genetic ablation of miR-155 reverses impaired microglia phagocytic function in SOD1 mice
(A) Representative confocal micrographs of phagocytosing microglia isolated from spinal cord of WT/miR-155+/−, WT/miR-155−/−, SOD1/miR-155+/− and SOD1/miR-155−/− female mice at 120 days of age. Microglia were incubated for 2 hours with fluorescently-labeled UV-irradiated neurons and stained with anti-IBA1 antibody. (B) Orthogonal projections of confocal z-stacks shows intracellular engulfed dead neuron in microglia. (C) Bar graphs comparing engulfed UV-irradiated neurons per microglia cell (mean ± s.e.m) (ns, non-significant; ****, P < 0.0001; one-way ANOVA; Kruskal-Wallis multiple comparisons test). Counts preformed from 70 cells in each group from biological duplicates.
Figure 10
Figure 10. Peripheral and central administration of anti-miR-155 delays disease onset and extends survival in SOD1 mice
(A-C) SOD1G93A (B6/SJL high copy) male mice were treated peripherally (ip) with 2 mg/kg of anti-miR-155-LNA (n = 11) and 2 mg/kg of scrambled miR-155-LNA (control group) (n = 10) beginning at disease onset as defined by body weight loss (82 days of age) twice weekly. (A) Rotarod performance as a function of age. Arrows show time of injections. Data represent mean ± s.e.m. P = 0.0033, factorial ANOVA and Fisher’s post hoc test. (B) Time-to-event analysis for disease neurologic onset (neurological severity score of 1). Disease onset was significantly delayed by 6.5 days (P = 0.0078) in anti-miR-155-LNA treated mice. (C) Kaplan-Meier analysis of the probability of surviving as function of age. Mantel-Cox’s F-test comparison demonstrates increased survival by 11 days (P = 0.0233) in anti-miR-155-LNA treated mice vs. control group. (D-F) SOD1G93A (B6/SJL high copy) male mice were treated with one injection given into the lateral ventricles of 2 mg/kg of anti-miR-155-LNA (n = 13) and 2 mg/kg of scrambled miR-155-LNA (n = 14) at disease onset as defined by body weight loss (90 days of age). (D) Rotarod performance as a function of age. Arrow shows time of injection. Data represent mean ± s.e.m. P = 0.0121, factorial ANOVA and Fisher’s post hoc test. (E) Time-to-event analysis for disease neurologic onset (neurological severity score of 1). Disease onset was significantly delayed by 7 days (P = 0.0041) in anti-miR-155-LNA treated mice vs. control group. (F) Kaplan-Meier analysis of the probability of surviving as function of age. Mantel-Cox’s F-test comparison demonstrates increased survival by 3 days (P = 0.0171) in anti-miR-155-LNA treated mice vs. control group. (G) qPCR analysis of miR-155-targeted genes in FACS-sorted spinal cord FCRLS+ microglia from treated SOD1G93A (B6/SJL high copy) male mice. Mice were treated with one injection given into the lateral ventricle of 2mg/kg of anti-miR-155-LNA (n = 5) and 2mg/kg of scrabbled miR-155-LNA (n = 5) at 120 days of age. FCRLS+ microglia were sorted 5 days post-injection. Student’s t test, 2-tailed.

References

    1. McGeer PL, McGeer EG. Inflammatory processes in amyotrophic lateral sclerosis. Muscle Nerve. 2002 Oct;26(4):459–70. - PubMed
    1. Beers DR, Henkel JS, Zhao W, Wang J, Appel SH. CD4+ T cells support glial neuroprotection, slow disease progression, and modify glial morphology in an animal model of inherited ALS. Proceedings of the National Academy of Sciences of the United States of America. 2008 Oct 7;105(40):15558–63. - PMC - PubMed
    1. Banerjee R, Mosley RL, Reynolds AD, et al. Adaptive immune neuroprotection in G93A-SOD1 amyotrophic lateral sclerosis mice. PLoS ONE. 2008;3(7):e2740. - PMC - PubMed
    1. Chiu IM, Phatnani H, Kuligowski M, et al. Activation of innate and humoral immunity in the peripheral nervous system of ALS transgenic mice. Proc Natl Acad Sci U S A. 2009 Dec 8;106(49):20960–5. - PMC - PubMed
    1. Beers DR, Henkel JS, Xiao Q, et al. Wild-type microglia extend survival in PU.1 knockout mice with familial amyotrophic lateral sclerosis. Proceedings of the National Academy of Sciences of the United States of America. 2006 Oct 24;103(43):16021–6. - PMC - PubMed

Publication types

MeSH terms