. 2014 Oct 31:5:1926-32.
doi: 10.3762/bjnano.5.203. eCollection 2014.

Patterning a hydrogen-bonded molecular monolayer with a hand-controlled scanning probe microscope

Affiliations

Patterning a hydrogen-bonded molecular monolayer with a hand-controlled scanning probe microscope

Matthew F B Green et al. Beilstein J Nanotechnol. .

Abstract

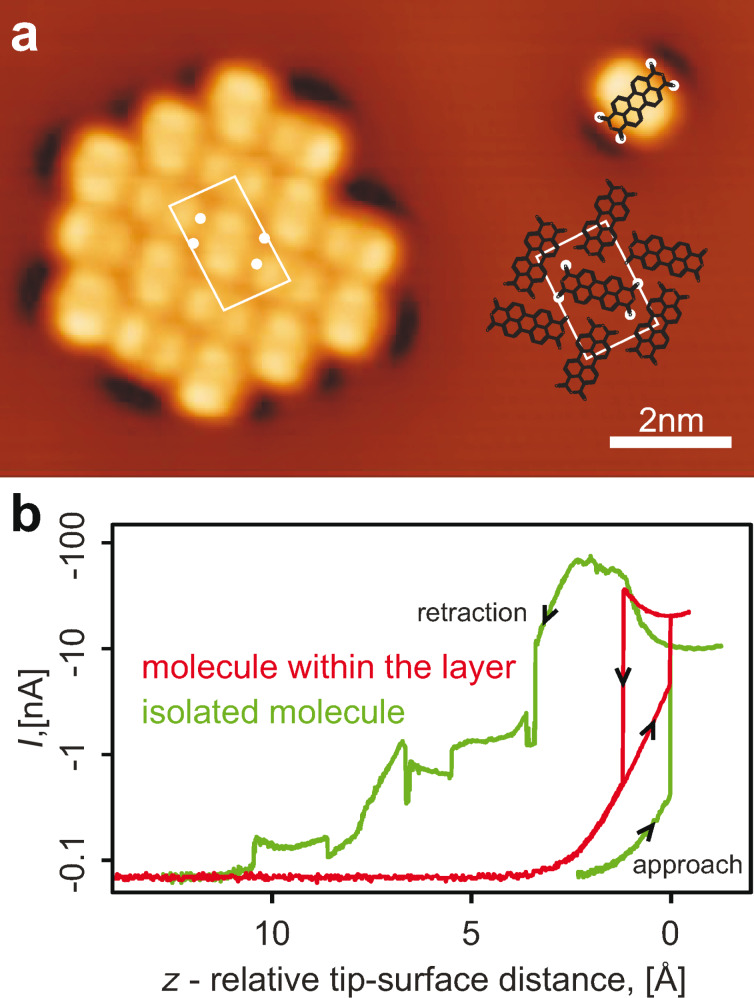
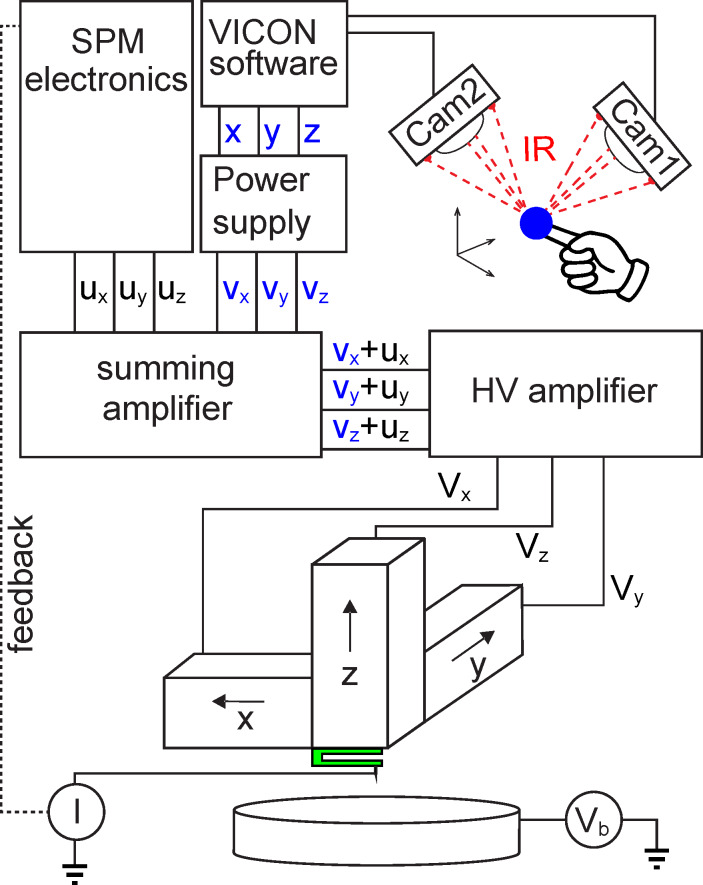
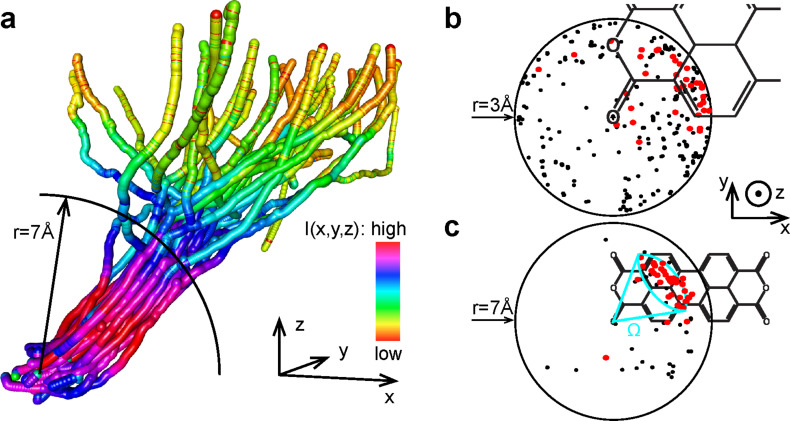
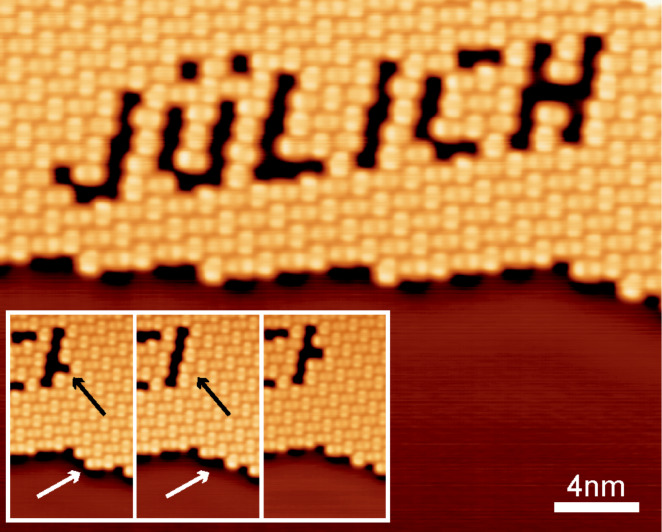
One of the paramount goals in nanotechnology is molecular-scale functional design, which includes arranging molecules into complex structures at will. The first steps towards this goal were made through the invention of the scanning probe microscope (SPM), which put single-atom and single-molecule manipulation into practice for the first time. Extending the controlled manipulation to larger molecules is expected to multiply the potential of engineered nanostructures. Here we report an enhancement of the SPM technique that makes the manipulation of large molecular adsorbates much more effective. By using a commercial motion tracking system, we couple the movements of an operator's hand to the sub-angstrom precise positioning of an SPM tip. Literally moving the tip by hand we write a nanoscale structure in a monolayer of large molecules, thereby showing that our method allows for the successful execution of complex manipulation protocols even when the potential energy surface that governs the interaction behaviour of the manipulated nanoscale object(s) is largely unknown.

Keywords: 3,4,9,10-perylene tetracarboxylic acid dianhydride (PTCDA); atomic force microscopy (AFM); scanning tunneling microscopy (STM); single-molecule manipulation.


Figures

Figure 1
Figure 1
(a) 13 × 8 nm2 STM image of a PTCDA island grown on an Ag(111) surface and of an isolated PTCDA molecule detached from it. The white rectangle marks the unit cell of the monolayer. The structure of the PTCDA/Ag(111) layer is displayed on the right. The positions of the carboxylic oxygen atoms of PTCDA are marked by white circles. All of the STM images were post-processed with WSxM software [14]. (b) I(z) curves measured upon tip approach and subsequent retraction executed over one of the carboxylic oxygen atoms of PTCDA with the applied bias voltage of V = −5 mV. Black arrows superimposed on the red and green curves show the direction of the tip movement. The contact event is observed as a sharp increase of I(z). The isolated PTCDA molecule can be pulled away from the surface simply by retracting the tip vertically (green curve). PTCDA molecules that reside inside monolayer islands resist pulling, which breaks their contact to the tip prematurely (red curve). The relative tip–surface distance scale (z) was aligned such that the contact point defined its zero value.
Figure 2
Figure 2
Scheme of the set-up for manual control of the SPM tip. Lamps mounted on the front of the two cameras emit infrared light that is reflected by a single marker fixed rigidly to the hand of the operator. The reflected light is captured by the cameras; with two cameras full three-dimensional triangulation is achieved. At the system output the real-time x(t), y(t), z(t)-coordinates of the marker are extracted. These coordinates are converted into a set of three voltages vx, vy, vz that are further added to the ux, uy, uz voltages of the SPM software used to control the scanning piezo-elements of the microscope. In this way when the feedback loop is closed the position of the SPM tip is controlled by the SPM software, but when the feedback loop is open the tip is controlled by the hand of the operator. During the manipulation vx + ux, vy + uy and vz + uz voltages are sampled at a frequency of 1 kHz.
Figure 3
Figure 3
a) A perspective view on a set of 34 3-D manipulation trajectories that resulted in the removal of PTCDA molecules from the monolayer. In order to facilitate plotting, the density of recorded data was reduced by a factor of 100 to a sampling frequency of 10 Hz. Each point of the trajectory is plotted as a sphere with a radius of 0.2 Å, corresponding to the amplitude of the oscillations of the AFM/STM tip. The colour of the sphere reflects the value of I(x, y, z) measured at the given point of the manipulation trajectory. The black circle shows the boundary of the sphere from Figure 3c. For a more detailed view of the displayed 3D trajectories download the 3D animation or the interactive 3D model from Supporting Information. b,c) Full statistics of manipulation trajectories (including unsuccessful ones) (top view). The circle marks the boundary of a sphere with the radius 3 Å (b) and 7 Å (c) the center of which was placed at the position of the carboxylic oxygen atom through which the molecule was contacted by the tip. Red (black) points mark locations where the successful (unsuccessful) trajectories penetrate the sphere. Bunching of the successful trajectories in a narrow solid angle is visible at larger tip–surface distances.
Figure 4
Figure 4
Constant current STM image of a structure consisting of 47 vacancies that were created by removing individual PTCDA molecules from the PTCDA/Ag(111) monolayer. The sequence of intermediate steps recorded during writing can be downloaded from the supplement. The three insets show the “repair” of a vacancy created by mistake. The black arrow marks the position of the error vacancy. The white arrow marks the position of the molecule at the edge of the molecular monolayer island that was used to fill the error vacancy. The molecule from the edge was removed by using the same manipulation protocol as for all other vacancies and was then placed into the error vacancy by approaching the tip to the vacancy and increasing the voltage steadily to 0.6 V.

References

    1. Eigler D M, Schweizer E K. Nature. 1990;344:524–526. doi: 10.1038/344524a0. - DOI
    1. Heller E J, Crommie M F, Lutz C P, Eigler D M. Nature. 1994;369:464–466. doi: 10.1038/369464a0. - DOI
    1. Heinrich A J, Lutz C P, Gupta J A, Eigler D M. Science. 2002;298:1381–1387. doi: 10.1126/science.1076768. - DOI - PubMed
    1. Sugimoto Y, Pou P, Custance O, Jelinek P, Abe M, Perez R, Morita S. Science. 2008;322:413–417. doi: 10.1126/science.1160601. - DOI - PubMed
    1. Ternes M, Lutz C P, Hirjibehedin C F, Giessibl F J, Heinrich A J. Science. 2008;319:1066–1069. doi: 10.1126/science.1150288. - DOI - PubMed

LinkOut - more resources