Review
. 2014 Nov 3:5:1944-65.
doi: 10.3762/bjnano.5.205. eCollection 2014.

PVP-coated, negatively charged silver nanoparticles: A multi-center study of their physicochemical characteristics, cell culture and in vivo experiments

Affiliations
Review

PVP-coated, negatively charged silver nanoparticles: A multi-center study of their physicochemical characteristics, cell culture and in vivo experiments

Sebastian Ahlberg et al. Beilstein J Nanotechnol. .

Abstract

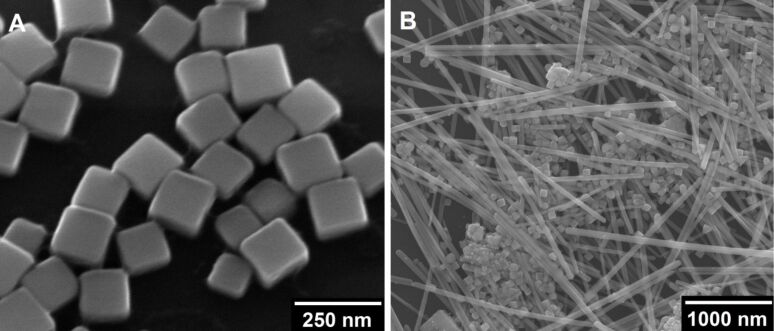
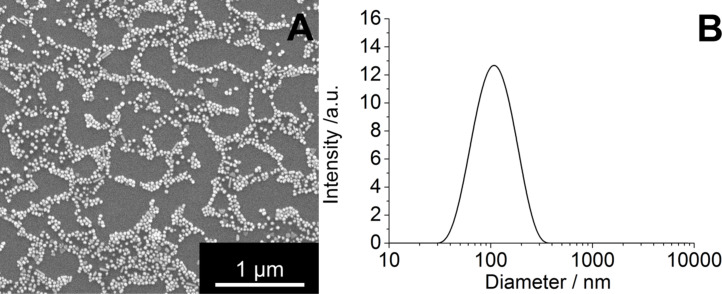
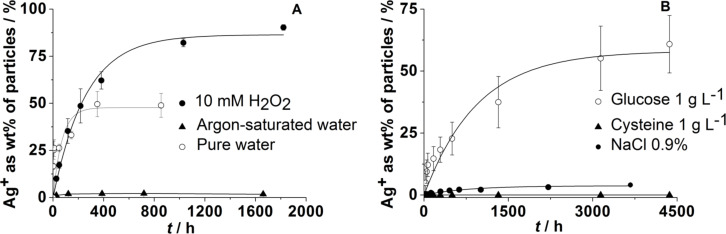
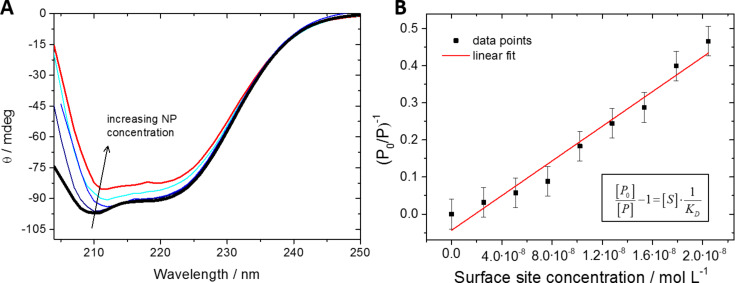
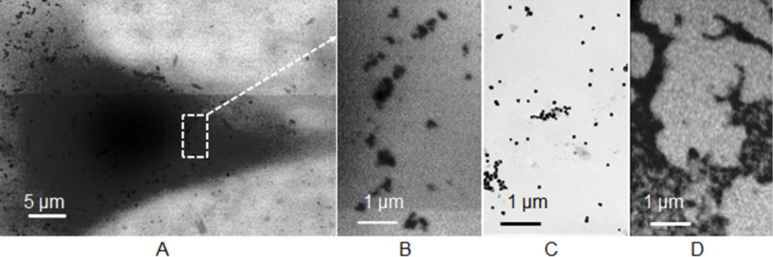
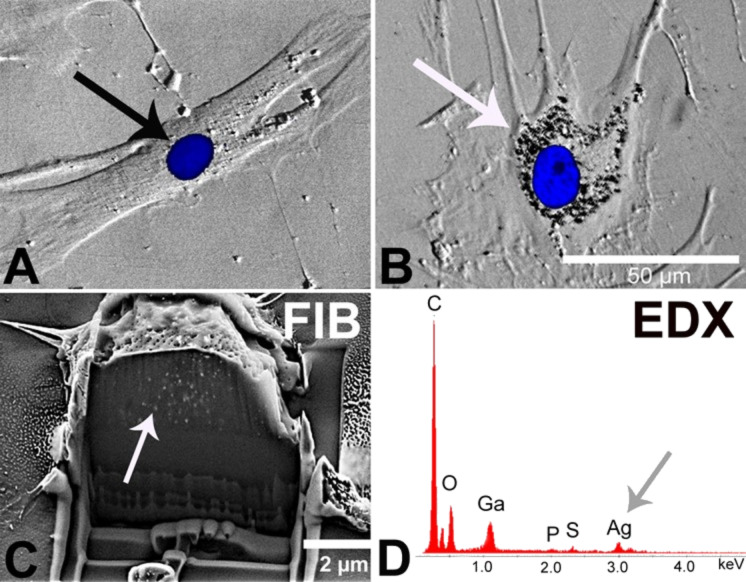
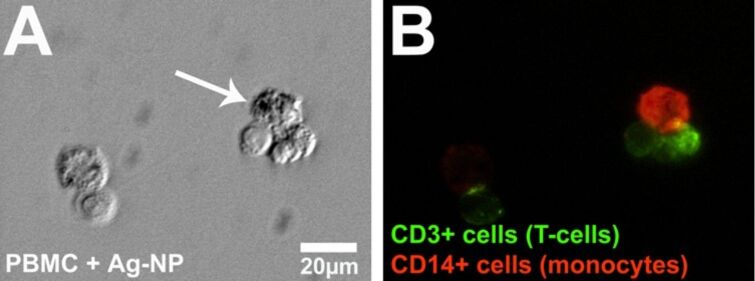
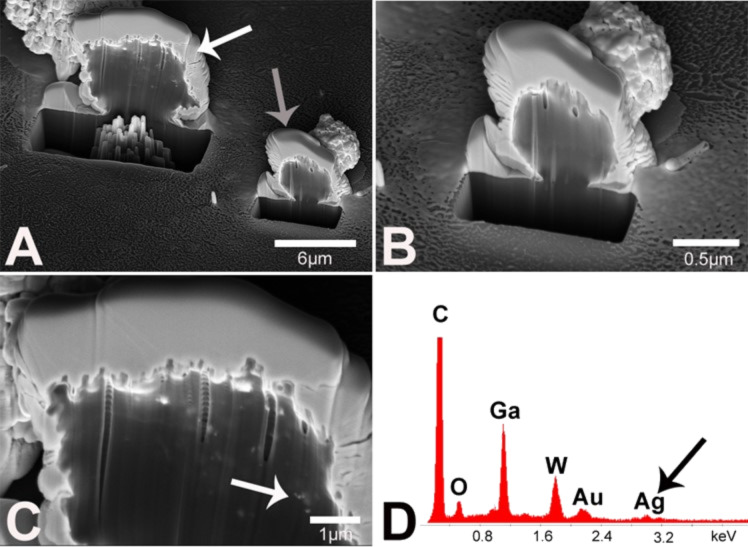
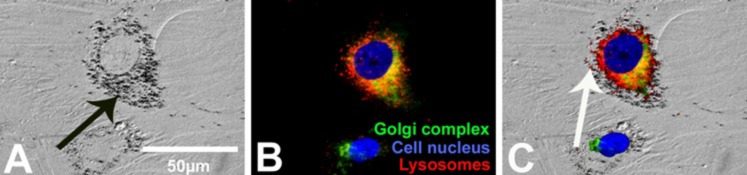
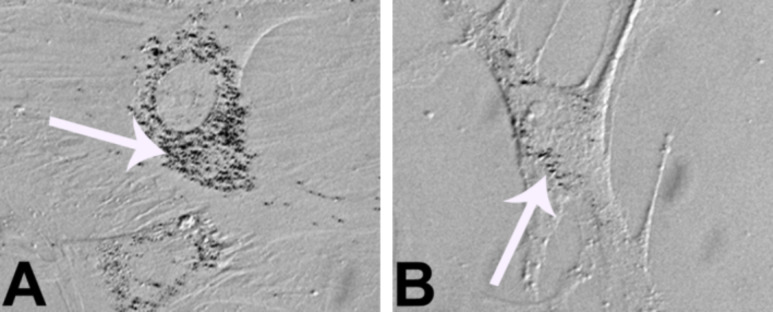
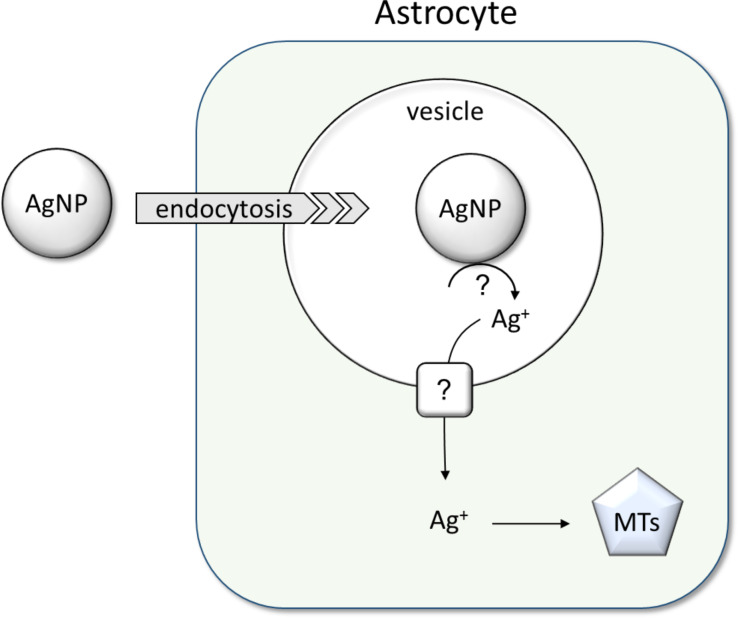
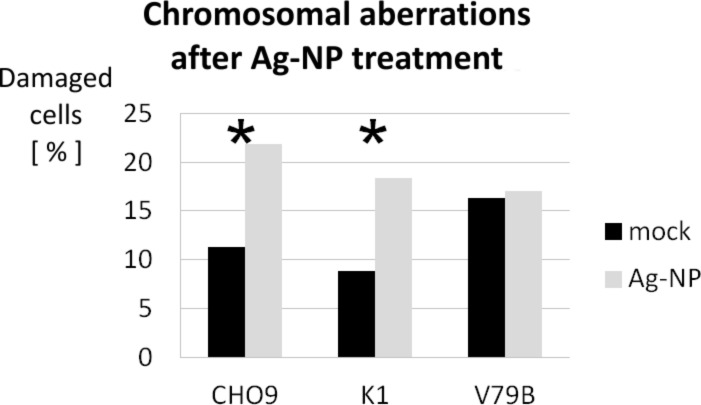
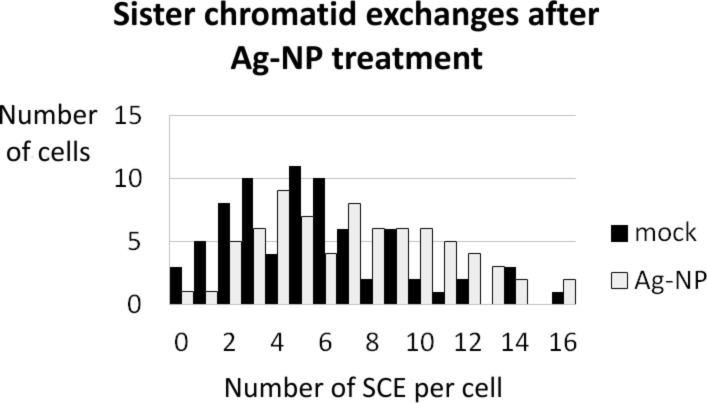
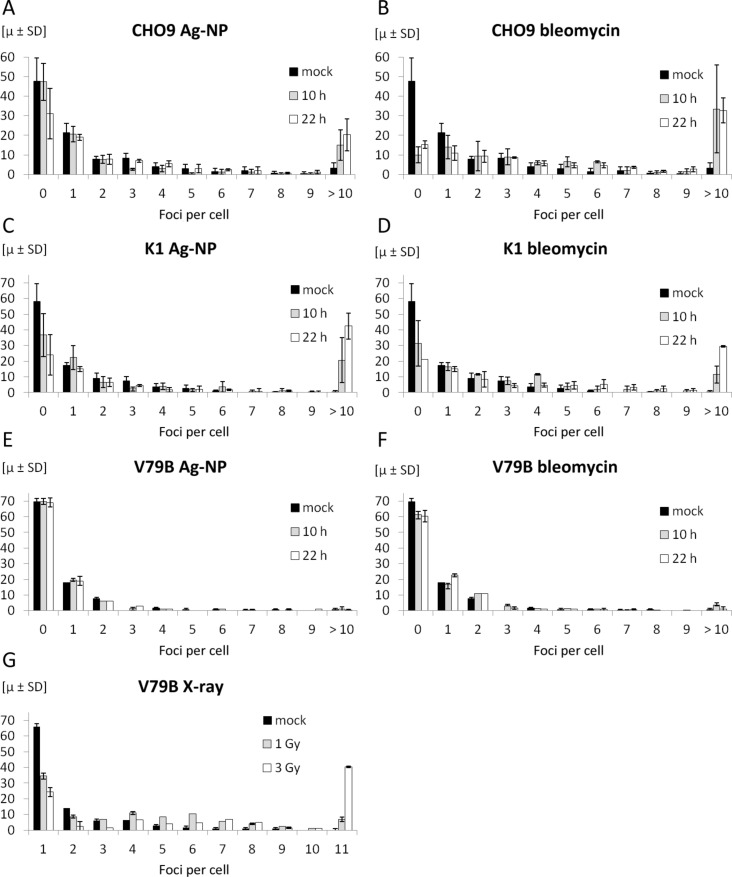
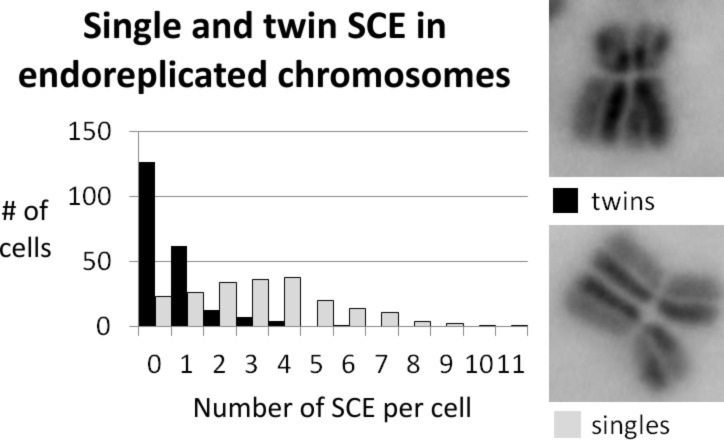
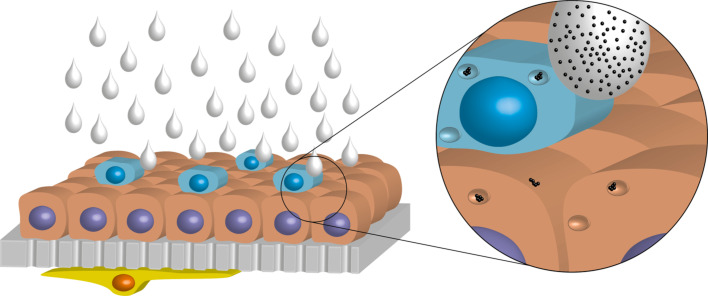
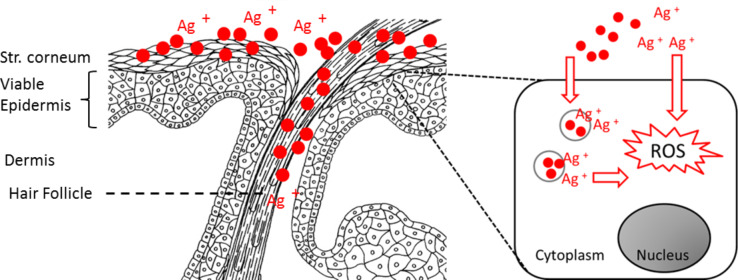
PVP-capped silver nanoparticles with a diameter of the metallic core of 70 nm, a hydrodynamic diameter of 120 nm and a zeta potential of -20 mV were prepared and investigated with regard to their biological activity. This review summarizes the physicochemical properties (dissolution, protein adsorption, dispersability) of these nanoparticles and the cellular consequences of the exposure of a broad range of biological test systems to this defined type of silver nanoparticles. Silver nanoparticles dissolve in water in the presence of oxygen. In addition, in biological media (i.e., in the presence of proteins) the surface of silver nanoparticles is rapidly coated by a protein corona that influences their physicochemical and biological properties including cellular uptake. Silver nanoparticles are taken up by cell-type specific endocytosis pathways as demonstrated for hMSC, primary T-cells, primary monocytes, and astrocytes. A visualization of particles inside cells is possible by X-ray microscopy, fluorescence microscopy, and combined FIB/SEM analysis. By staining organelles, their localization inside the cell can be additionally determined. While primary brain astrocytes are shown to be fairly tolerant toward silver nanoparticles, silver nanoparticles induce the formation of DNA double-strand-breaks (DSB) and lead to chromosomal aberrations and sister-chromatid exchanges in Chinese hamster fibroblast cell lines (CHO9, K1, V79B). An exposure of rats to silver nanoparticles in vivo induced a moderate pulmonary toxicity, however, only at rather high concentrations. The same was found in precision-cut lung slices of rats in which silver nanoparticles remained mainly at the tissue surface. In a human 3D triple-cell culture model consisting of three cell types (alveolar epithelial cells, macrophages, and dendritic cells), adverse effects were also only found at high silver concentrations. The silver ions that are released from silver nanoparticles may be harmful to skin with disrupted barrier (e.g., wounds) and induce oxidative stress in skin cells (HaCaT). In conclusion, the data obtained on the effects of this well-defined type of silver nanoparticles on various biological systems clearly demonstrate that cell-type specific properties as well as experimental conditions determine the biocompatibility of and the cellular responses to an exposure with silver nanoparticles.

Keywords: aerosols; biological properties; cell biology; nanoparticles; nanotoxicology; silver.


Figures

Figure 1
Figure 1
SEM images of silver nanocubes (A) and a mixture of silver nanoparticles with different shapes and sizes (B), both obtained from the polyol synthesis as described by Xia et al. [24] and carried out under exactly the same conditions.
Figure 2
Figure 2
Representative scanning electron microscopy image of PVP-coated silver nanoparticles (A) and particle size distribution as measured by dynamic light scattering (B). These particles were used in all described experiments.
Figure 3
Figure 3
Dissolution of silver nanoparticles immersed in pure water, argon-saturated water under argon atmosphere, and in water with 10 mM H2O2 (A), in aqueous NaCl (0.9%), and in the presence of either cysteine (aq; 1 g L−1) or glucose (aq; 1 g L−1) (B). The data were taken from [20,33].
Figure 4
Figure 4
(A) CD spectra of pure dissolved bovine serum albumin (thick black line) and in the presence of different concentrations of PVP-coated silver nanoparticles. The concentration of the nanoparticles ranged from 1.20·1011 to 1.91·1011 nanoparticles mL−1. (B) Linear fit to the evaluated data for the determination of a KD value for these nanoparticles according to the equation given in [63,69]. Note that the accuracy of the computed KD value is determined by the accuracy of the CD spectra and the resulting values for the occupation of surface sites by the protein.
Figure 5
Figure 5
A: STXM images at 510 eV of human mesenchymal stem cells (hMSC) after 24 h of incubation with spherical silver nanoparticles (A). B: Enlarged view from image A. C: TEM image and D: STXM image at 375 eV of the same batch of silver particles before incubation.
Figure 6
Figure 6
Agglomeration of internalized silver nanoparticles in hMSC analyzed by phase contrast microscopy (B), FIB/SEM (C), and EDX (D). hMSC were incubated for 24 h in the presence of 2 µg mL−1 silver acetate (A) as control or 20 µg mL−1 silver nanoparticles (B–D). Accumulated nanoparticles were detected in perinuclear areas (B, white arrow). Cell nuclei were stained with blue-fluorescent Hoechst33342 (A, black arrow; B). A single cell was cross-cut by FIB milling and the cut interface was analyzed by SEM to visualize the internalized particles (C, white arrow). The corresponding EDX spectrum of the sectioned cell shows silver signals (D, grey arrow).
Figure 7
Figure 7
Intracellular occurrence of agglomerated silver nanoparticles in PBMC analyzed through microscopy. Representative light micrographs (phase contrast) after digital contrast enhancement (DCE filter) (A) and fluorescence micrographs (B) are shown. PBMC were treated with 15 µg mL−1 silver nanoparticles at 37 °C for 24 h and subsequently, the cells were labeled with specific antibodies (anti-CD3, green, and anti-CD14, red). The white arrow denotes the accumulation of particles (A) within a monocyte in the cytoplasm.
Figure 8
Figure 8
Proof of intracellular localization of silver nanoparticle agglomerates in monocytes and lymphocytes by using FIB/SEM and EDX analysis. PBMC were incubated for 24 h in the presence of 20 µg mL−1 silver nanoparticles, and subsequently an individual monocyte (A, white arrow) was crosscut by FIB milling. The cross section was analyzed by SEM to visualize the internalized particles. Additionally, a lymphocyte (A, grey arrow; B) within the nanoparticle-treated PBMC fraction was analyzed accordingly. The intracellular occurrence of nanoparticle agglomerates within the monocyte is denoted by a white arrow (C). No comparable signals were detected within the lymphocyte (B). The corresponding EDX spectrum of the cut monocyte (C) shows silver signals (D, black arrow).
Figure 9
Figure 9
Localization of silver nanoparticles agglomerates in hMSC. A representative light micrograph after digital contrast enhancement (DCE filter; the black arrow denotes silver accumulation) (A), a fluorescence micrograph (B) and a combination of both (C) are shown. The white arrow denotes the intracellular accumulation of silver particles inside the endo-lysosomes (C). The blue fluorescence of Hoechst33342, the green fluorescence of BODIPY FL C5-ceramide and the red fluorescence of Lyso Tracker Red DND 99, were used as probes of cell nucleus, Golgi complex and endo-lysosomes, respectively.
Figure 10
Figure 10
Decrease in the amount of silver agglomerates within hMSC after prolonged cell culture. hMSC were pre-incubated for 24 h with the silver nanoparticles (A), then, the cells were washed and incubated with fresh growth medium for further 72 h (B). The white arrow denotes the intracellular accumulation of silver particles.
Figure 11
Figure 11
Uptake and metabolism of silver nanoparticles in brain astrocytes. Data from cultured astrocytes suggest that endocytosis contributes to the internalization of silver nanoparticles by astrocytes. Silver ions are slowly liberated from accumulated silver nanoparticles and induce the upregulation of the metal storage proteins, metallothioneins (MTs). The upregulation of these protective proteins will help to prevent severe toxicity of silver ions that are liberated from the accumulated silver nanoparticles. The mechanisms involved in the release of silver ions from internalized silver nanoparticles and in the export of such ions from the endosomes remain to be elucidated.
Figure 12
Figure 12
Damaged cells given in percent by scoring for CA in CHO9 (n = 816, p > 0.999), K1 (n = 1851, p > 0.999) and V79B (n = 726, p = 0.714). Black bars show data of untreated cultures and grey bars represent data observed in cultures treated with 5 µg mL−1 of silver nanoparticles. The asterisks indicate data that are significant when using a single sided Χ2 four field test. Mock = control (untreated cells).
Figure 13
Figure 13
The diagram shows the distribution of sister-chromatid exchanges (SCE) in untreated cells (black bars) and silver nanoparticle treated cells (grey bars). The average number of SCE per cell increased from 5.50 in untreated cells to 7.26 in silver nanoparticle-treated cells. This shift of the average number of SCE was significant (p = 0.998) when using a single-sided unpaired t-test. In total there were 407 SCE scored in 74 untreated cells and 537 SCE in 75 silver nanoparticle-treated cells.
Figure 14
Figure 14
These diagrams summarize the quantification of foci formation in CHO9, K1 and V79B. Data derived from silver nanoparticle-treated cell cultures are given in Figure (A), (C), and (E) and control experiments treated with bleomycin are shown in Figure (B), (D), and (F). Panel (G) shows the proficiency of γ-H2AX foci formation in V79B cells after irradiation. These foci were not detectable in V79B cells after silver nanoparticle treatment (E) or treatment with bleomycin (F).
Figure 15
Figure 15
The diagram shows the distribution of twin SCE (black bars) and single SCE (grey bars) in CHO K1 cells, treated with silver nanoparticles. The average number of SCE per cell changes from µ = 0.612 for twin SCE (n = 214) to 3.115 for single SCE (n = 208; p > 0.999). Images on the right side show examples for twin SCE and single SCE.
Figure 16
Figure 16
Schematic image of the triple-cell co-culture model consisting of MDMs (blue), A549 cells (red), a porous membrane (grey), and dendritic cells (yellow). The cells were cultured at the air-liquid interface for exposure of silver nanoparticle suspensions by nebulization. Reproduced from [125].
Figure 17
Figure 17
Cytotoxic effects and free radical production by silver nanoparticles per se versus the effects due to secondary Ag+ ion release.

References

    1. Chernousova S, Epple M. Angew Chem, Int Ed. 2013;52:1636–1653. doi: 10.1002/anie.201205923. - DOI - PubMed
    1. Galdiero S, Falanga A, Vitiello M, Cantisani M, Marra V, Galdiero M. Molecules. 2011;16:8894–8918. doi: 10.3390/molecules16108894. - DOI - PMC - PubMed
    1. Beattie M, Taylor J. J Clin Nurs. 2011;20:2098–2108. doi: 10.1111/j.1365-2702.2010.03561.x. - DOI - PubMed
    1. Simoncic B, Tomsic B. Text Res J. 2010;80:1721–1737. doi: 10.1177/0040517510363193. - DOI
    1. Chaloupka K, Malam Y, Seifalian A M. Trends Biotechnol. 2010;28:580–588. doi: 10.1016/j.tibtech.2010.07.006. - DOI - PubMed

LinkOut - more resources