. 2014 Nov 13;515(7526):269-73.
doi: 10.1038/nature13897. Epub 2014 Nov 5.

The participation of cortical amygdala in innate, odour-driven behaviour

Affiliations

The participation of cortical amygdala in innate, odour-driven behaviour

Cory M Root et al. Nature. .

Abstract

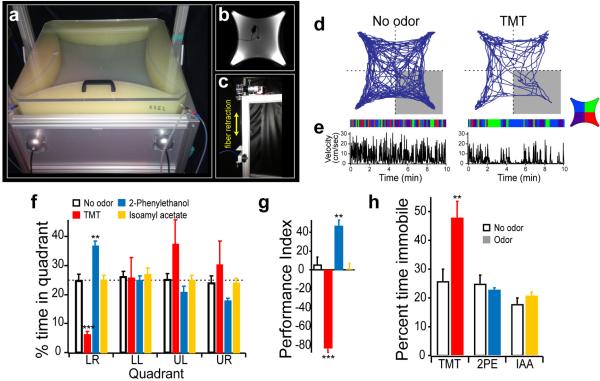
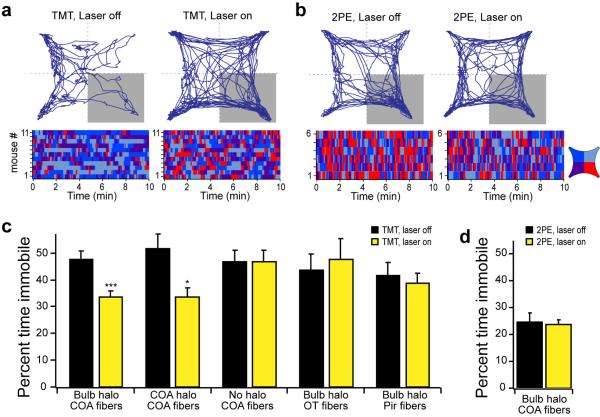
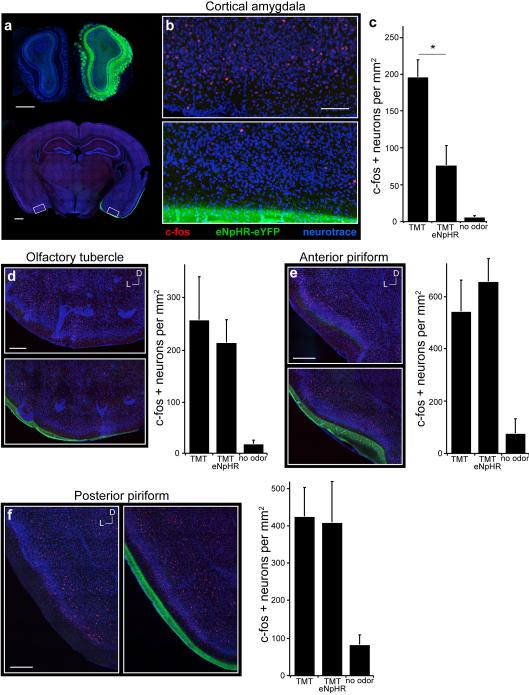
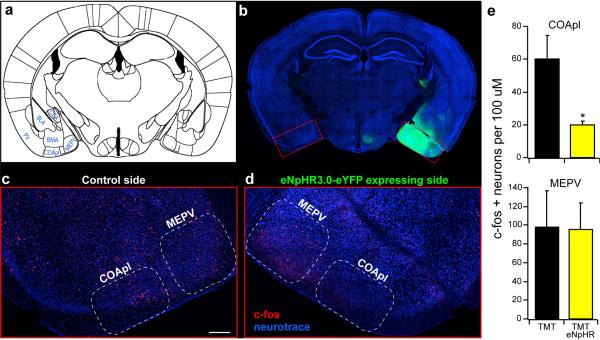
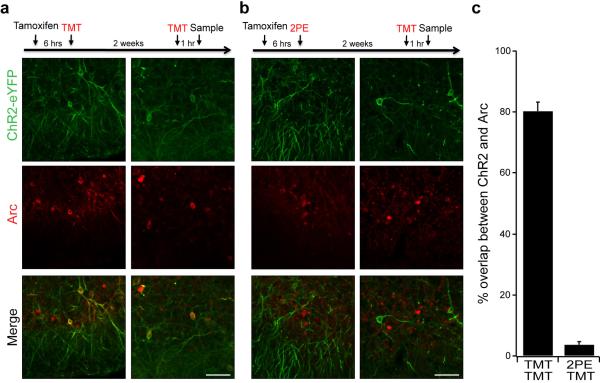
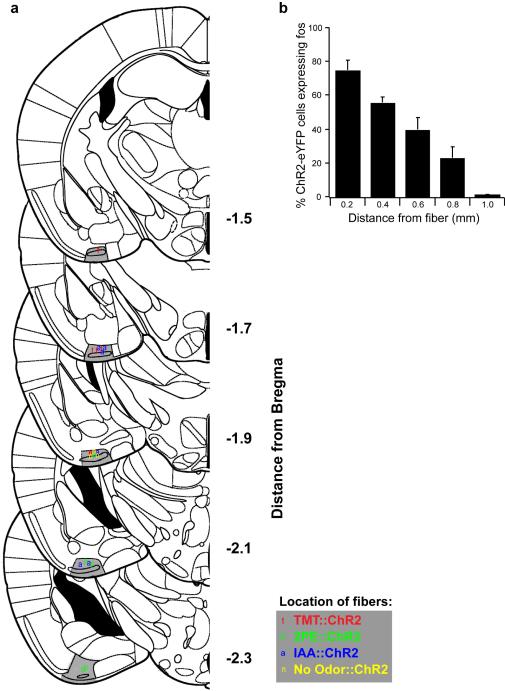
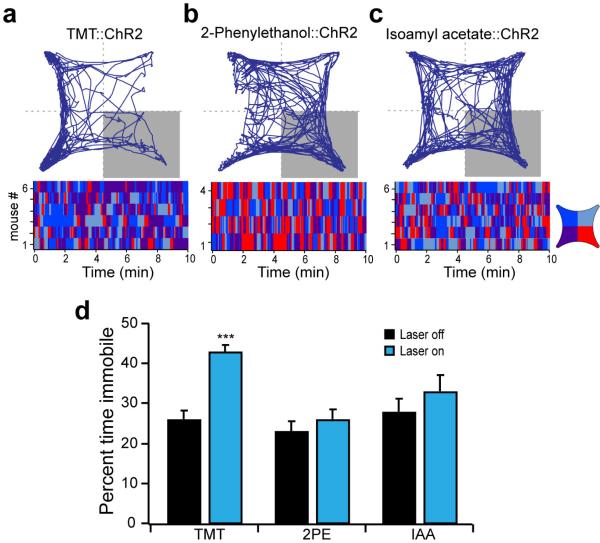
Innate behaviours are observed in naive animals without prior learning or experience, suggesting that the neural circuits that mediate these behaviours are genetically determined and stereotyped. The neural circuits that convey olfactory information from the sense organ to the cortical and subcortical olfactory centres have been anatomically defined, but the specific pathways responsible for innate responses to volatile odours have not been identified. Here we devise genetic strategies that demonstrate that a stereotyped neural circuit that transmits information from the olfactory bulb to cortical amygdala is necessary for innate aversive and appetitive behaviours. Moreover, we use the promoter of the activity-dependent gene arc to express the photosensitive ion channel, channelrhodopsin, in neurons of the cortical amygdala activated by odours that elicit innate behaviours. Optical activation of these neurons leads to appropriate behaviours that recapitulate the responses to innate odours. These data indicate that the cortical amygdala plays a critical role in generating innate odour-driven behaviours but do not preclude its participation in learned olfactory behaviours.


Figures

Extended Data Figure 1
Extended Data Figure 1. Quantification of the four-quadrant behavior assay
a-c, Images of the four-field behavior chamber. b, An image, taken from the camera that tracts the position of the animal, shows a mouse tethered to optic fibers that enter the chamber through a port on the left side. c, A motorized fiber retraction system adjusts the length of the fiber as the mouse traverses the arena. The trajectory of a representative mouse is plotted for a ten minute period in the absence of odor (left), or following the addition of odor to the lower right quadrant (right). The raster plots below the trajectory graphs represent quadrant occupancy over time. e, The velocity over time in the absence of odor (left) or in the presence of TMT (right) reveals bouts of inactivity associated with freezing behavior in the presence of TMT. f, The average amount of time spent in each quadrant either in the absence of odor, or the presence of TMT, 2-phenylethanol, or isoamyl acetate. g, This quantification is reduced when plotted as the performance index (n=5). h, Pauses in locomoter activity are quantified as the percent time immobile in the presence and absence of TMT, 2-phenylethanol, or isoamyl acetate. Immobility is defined as velocity less than 1 cm/sec for at least 1 second. f-h, **P < 0.01, ***P < 0.001 paired t-test comparing PI with and without odor for each odor group; error bars show SEM.
Extended Data Figure 2
Extended Data Figure 2. Location of optical fibers implanted in cortical amygdala for photoactivation of halorhodopsin
Schematics show coronal sections throughout most of the region containing cortical amygdala. The posterolateral cortical amygdala is highlighted in gray and the location of bilaterally implanted fibers is indicated.
Extended Data Figure 3
Extended Data Figure 3. Locomotor activity of mice with Optical suppression in cortical amygdala
a,b Mice with halorhodopsin in the olfactory bulb and optical fibers in cortical amygdala were optically coupled to a yellow laser and tested in the behavioral assay for the response to TMT (a) or 2-phenylethanol (2PE) (b) with and without laser stimulation. The position of a representative mouse during a ten minute period in the presence of TMT (a) or 2-phenylethanol (b) either in the absence (left) or presence (right) of photoactivation during the ten minute behavioral testing. Raster plots show quadrant occupancy over time for each animal (a, n=11; b, n=6). c,d, The percent time immobile in the absence and presence of photoactivation. Immobility is defined as velocity less than 1 cm/sec for at least 1 second. c, Response to TMT in mice receiving photostimulation of halorhodopsin in different experimental animals. Bulb halo and COA halo describe mice with halorhodopsin expression in the olfactory bulb and cortical amygdala, respectively. Optical fibers were placed above cortical amygdala (COA, n=11), olfactory tubercle (OT, n=7) or in piriform cortex (Pir, n=8) as denoted below site of injection. Control animals received no viral injection, and fibers implanted into cortical amygdala (n=4). d, The percent immobility for mice exposed to 2-phenylethanol in the absence and presence of photoactivation of bulbar axons in cortical amygdala (n=6). c,d, *P < 0.05, ***P < 0.001 paired t-test comparing with and without laser; error bars show SEM.
Extended Data Figure 4
Extended Data Figure 4. Optical suppression of bulbar input to cortical amygdala selectively reduces odor-evoked activity in this region
Mice were unilaterally injected with AAV5-eNpHR3.0-eYFP into the olfactory bulb and exposed to TMT while photoactivating the mitral-tufted cell axon terminals in cortical amygdala. a, Coronal section of the olfactory bulbs (top) and of the brain region with cortical amygdala (bottom) reveal halorhodopsin expression in the bulb and the lateral olfactory tract. b, Magnified and cropped image showing the cortical amygdala of both sides of the posterolateral cortical amygdala. Region in the bottom image received photoacivation of halorhodopsin in bulbar axon terminals during odor exposure, whereas the contralateral side (top) did not. Scale bars indicate 200 μm (a) and 100 μm (b). c, The number of c-fos positive neurons was counted for each side of the brain (n=4) as well as in control animals that did not receive any stimuli (n=2) across multiple regions of cortical amygdala. Numbers are normalized by area (mm2) of 100 μm thick sections for comparison between brain areas. *P < 0.05 paired t-test comparing with and without laser; error bars show SEM. d-f, Coronal sections showing the olfactory tubercle (d), anterior piriform (e) and posterior piriform (f); the region in the bottom images received photoactivation of bulbar axon terminals in the cortical amydala. Scale bars indicate 200 μm. Bar Graphs show the number of c-fos positive neurons counted for each side of the brain (n=4) as well as in control animals that did not receive any stimuli (n=2). Error bars show SEM. a-f, Images are taken from sections at the following AP distances from bregma: −1.7 (b), 1.2 (d-e), −1.6 (f).
Extended Data Figure 5
Extended Data Figure 5. Halorhodopsin expression of neurons within cortical amygdala
Injection of AAV into cortical amygdala leads to broad expression of halorhodopsin within cortical amygdala and neighboring areas, however optical silencing is restricted to the cortical amygdala. a, Schematic of a coronal section showing cortical amygdala (COApl) in relation to other ventral brain regions. b-d, Mice were unilaterally injected with AAV5-eNpHR3.0-eYFP into the cortical amygdala and exposed to TMT while photoactivating halorhodopsin in cortical amygdala neurons. b, Coronal section reveals broad expression of halorhodopsin in the cortical amygdala region. This expression is broad covering at least 90% of COApl throughout the anterior-posterior axis. c-d, Magnified and cropped image showing c-fos expression in the cortical amygdala. The right side (d) received photoactivation during odor exposure , whereas the contralateral side (c) did not. Scale bar indicates 200 μm. e, The number of c-fos positive neurons was counted for each side of the brain (n=3) across multiple regions of the cortical amygdala (top) as well as the medial amygdala (MEPV, bottom). The mean cell number for each animal is shown in the bar graph. *P < 0.05 paired t-test comparing with and without laser stimulation; error bars show SEM.
Extended Data Figure 6
Extended Data Figure 6. The arc promoter can be used to faithfully drive channelrhodopsin expression in odor-specific neurons
Arc-Cre-ERT2 mice were administered tamoxifen and exposed to odor to induce ChR2-eYFP expression, and subsequently exposed to either the same odor or a different odor and then sampled for endogenous arc expression. a,b, The timeline for odor exposure is indicated at the top, and images from two different regions of cortical amygdala are shown from representative animals for each experiment. a, TMT exposure induced ChR2-eYFP expression in the cortical amygdala and re-exposure to the same odor induced arc expression detected by immunocytochemistry. b, 2-Phenylethanol induced expression of ChR2-eYFP followed by re-exposure to TMT. Scale bar indicates 100 μm. c, The number of channelrhodopsin expressing neurons that also express the endogenous arc protein. Neurons were counted across randomly chosen sections throughout the cortical amygdala (n=4).
Extended Data Figure 7
Extended Data Figure 7. Location of optical fibers implanted in cortical amygdala for photoactivation of odor responsive neurons
a, Schematics show unilateral coronal sections throughout most of the region containing cortical amygdala. The posterolateral cortical amygdala is highlighted in gray and the location of unilaterally implanted fibers is indicated. Fibers were not preferentially targeted to one side of the brain, but the fiber positions are collapsed onto unilateral schematics. b, The extent of light induced activation of channelrhodopsin expressing neurons as a function of distance from the fiber tip using c-fos expression. ArcCreERT2 mice were injected with AAV5-ef1α-DIO-ChR2-eYFP into cortical amygdala, administered tamoxifen and exposed to TMT to induce channelrhodopsin expression. Three weeks later, the cortical amygdala was photoactivated for 10 min with cycles of 30 seconds of pulsed light (10 Hz, 50% duty cycle) and 30 seconds off. Mice were sampled for c-fos immunoreactivity as a function of distance from the fiber tip in 200 μm bins (n=3). P < 0.001, one-way Anova; error bars show SEM.
Extended Data Figure 8
Extended Data Figure 8. Locomotor activity of mice during activation of odor responsive neurons within cortical amygdala
Mice with odor-driven channelrhodopsin expression were tested in the open field assay where they received pulsed photoactivation upon entrance into the lower right quadrant. a-c, The trajectory graphs (top) show the position of representative animals with ChR2-eYFP in neurons activated by TMT (a), 2-phenylethanol (b) or isoamyl acetate (c). The raster plots (bottom) show quadrant occupancy over time. d, The percent time immobile in the absence and presence of photoactivation. Immobility is defined as velocity less than 1 cm/sec for at least 1 second. a-c, TMT (n=6), 2-phenylethanol (n=4) and isoamyl acetate (n=6); ***P < 0.001 paired t-test comparing with and without laser; error bars show SEM.
Extended Data Figure 9
Extended Data Figure 9. The spatial distribution of neurons responsive to different odors within cortical amgydala
a, ArcCreERT2 mice were administered tamoxifen and exposed to one of five different odors and then consecutive, serial, coronal sections were collected throughout the cortical amygdala region. Images reveal odor driven ChR2-eYFP expression in serial sections across the cortical amygdala of representative mice for each odor. Images of the ventral brain region are magnified and cropped to show only the posterolateral cortical amygdala, and sections are displayed at 200 μm intervals across 1.2 mm of the anterior-posterior axis. Scale bar indicates 100 μm. b, Representative images showing the expression of odor induced ChR2-eYFP with magnified images that reveal identifiable cell bodies for counting. The top image shows a Z-projection of 40 μm through cortical amygdala (left), and the bottom images (i-iv) show magnified single Z-plane images of small areas revealing neuronal cell bodies, indicated by the white arrows. Scale bar indicates 60 μm. c, The average number of neurons counted per 100 μm coronal section throughout the posterolateral cortical amygdala for different odors. Error bars show SEM. c, A one-way Anova was performed for each point along the anterior-posterior axis, comparing the means between different odors (excluding the no-odor condition). The no-odor condition was compared to each odor at −2.3 from bregma using an unpaired t-test; P < 0.001 for each odor.
Figure 1
Figure 1. Behavioral assay for innate responses to odor
An open field, 4-quadrant behavioral chamber was used to measure the response to odor delivered in only one quadrant. a, The trajectory of a representative mouse is plotted for a ten minute period in the absence of odor or following the addition of odor to the lower right quadrant. The raster plots below the trajectory graphs represent quadrant occupancy over time (x-axis) for each of five different animals. The four colors represent occupancy in each of the four quadrants. Odor was delivered to the lower right quadrant (red). b, The average response to an array of odorants is quantified by a performance index that represents the percent difference from chance occupancy in the lower right quadrant (PI = (P-25) /0.25; P = the percent time in the lower right quadrant). One-way anova test, P value < 0.001. n=4-8 for each odor.
Figure 2
Figure 2. The projections from the olfactory bulb to cortical amygdala are required for innate aversion and attraction to odors
a, Coronal section of a mouse olfactory bulb injected with AAV5-eNpHR3.0-eYFP. b, Magnified view of an olfactory bulb showing eNpHR3.0-eYFP expression in mitral cells. c, Coronal section depicting the placement of an optical fiber in cortical amygdala, above the axonal output from the olfactory bulb. Scale bar indicates 500 μm (a,c) and 100 μm (b). d,e, Mice were optically coupled to a yellow laser and tested in the behavioral assay for the response to TMT (d) or 2-phenylethanol (2PE) (e) with and without laser stimulation. The percent time each animal spent in the odor quadrant in the absence or presence of photoactivation. f, The mean performance index for mice exposed to TMT. The black bar indicates the average response of all mice to TMT in the absence of photoactivation, and the yellow bars indicate responses to TMT with photoactivation for different experimental animals. Bulb halo and CoA halo describe mice with halorhodopsin expression in the olfactory bulb and cortical amygdala, respectively. Optical fibers were placed above the bulb (n=3), cortical amygdala (CoA, n=11), olfactory tubercle (OT, n=7) or in piriform cortex (Pir, n=8) as denoted below site of injection. The last two bars on the right side have either halorhodopsin in the neurons of cortical amygdala (n=5), or receive no viral injection (n=4), and fibers implanted into cortical amygdala. g, The mean performance index for mice exposed to 2-phenylethanol in the absence and presence of photoactivation (n=6). f,g, *P < 0.05, **P < 0.01, ***P < 0.001 paired t-test comparing PI with and without laser for each group; error bars indicate SEM.
Figure 3
Figure 3. Activation of odor responsive neurons within cortical amygdala is sufficient to recapitulate behavioral responses
a, The genetic strategy used to express ChR2 in odor responsive neurons. The tamoxifen sensitive Cre recombinase, CreERT2, was expressed under the control of the promoter of the activity-dependent gene, arc, in a transgenic mouse. The gene encoding Cre-dependent ChR2-eYFP was introduced into the cortical amygdala by infection with AAV5. b, The timeline for experimental manipulations. The animal was sampled upon termination of behavioral testing. c, Representative images showing the expression of ChR2-eYFP in mice that received tamoxifen injection followed by exposure to either the odorant isoamyl acetate (bottom) or no odor as a control (top). Scale bar indicates 300 μm. d-f, Mice with odor-driven channelrhodopsin expression were tested in the open field assay where they received pulsed photoactivation upon entrance into one quadrant. The percent time each animal spent in the lower right quadrant in the absence and presence of pulsed photoactivation in mice with neurons activated by TMT (d), 2-phenylethanol (e) and isoamyl acetate (f). g, The average performance index for mice receiving photostimulation of neurons activated by TMT, 2-phenylethanol, isoamyl acetate, or no odor, respectively from left to right (n=3-6). **P < 0.01, ***P < 0.001 t-test comparing PI with and without laser; error bars indicate SEM.
Figure 4
Figure 4. The spatial distribution of neurons responsive to different odors within cortical amygdala
ArcCreERT2 mice were administered tamoxifen and exposed to one of three different odors and then consecutive, serial, coronal sections were collected throughout the cortical amygdala region. a, Images reveal odor driven ChR2-eYFP expression in representative images of anterior (top) and posterior (bottom) cortical amygdala for each odor. Images of the ventral brain region are magnified and cropped to show only the posterolateral cortical amygdala, and sections are displayed at −1.4 and −2.2 mm relative to bregma. Scale bar indicates 100 μm. b, The number of neurons counted per 100 μm throughout the posterolateral cortical amygdala is displayed for each odor. The number for each animal is indicated with a thin black line and the heavier line shows the mean for the odor group (n=4-6).

References

    1. Sosulski DL, Bloom ML, Cutforth T, Axel R, Datta SR. Distinct representations of olfactory information in different cortical centres. Nature. 2011;472:213–216. doi:nature09868 [pii] 10.1038/nature09868. - PMC - PubMed
    1. Miyamichi K, et al. Cortical representations of olfactory input by trans-synaptic tracing. Nature. 2011;472:191–196. doi:nature09714 [pii] 10.1038/nature09714. - PMC - PubMed
    1. Ghosh S, et al. Sensory maps in the olfactory cortex defined by long-range viral tracing of single neurons. Nature. 2011;472:217–220. doi:nature09945 [pii] 10.1038/nature09945. - PubMed
    1. Stowers L, Logan DW. Olfactory mechanisms of stereotyped behavior: on the scent of specialized circuits. Current opinion in neurobiology. 2010;20:274–280. doi:10.1016/j.conb.2010.02.013. - PMC - PubMed
    1. Chamero P, et al. Identification of protein pheromones that promote aggressive behaviour. Nature. 2007;450:899–902. doi:10.1038/nature05997. - PubMed

Publication types