. 2015 Jan 15;517(7534):373-6.
doi: 10.1038/nature13873. Epub 2014 Nov 5.

The neural representation of taste quality at the periphery

Affiliations

The neural representation of taste quality at the periphery

Robert P J Barretto et al. Nature. .

Abstract

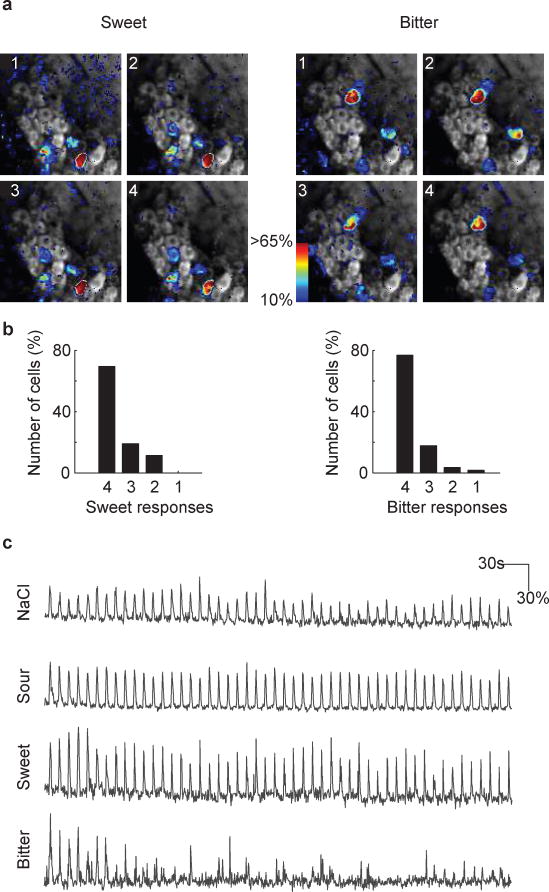
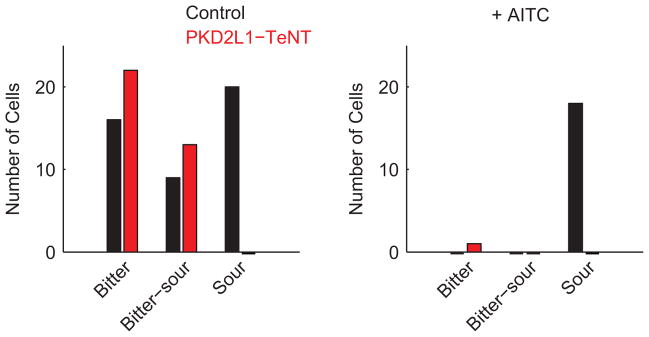
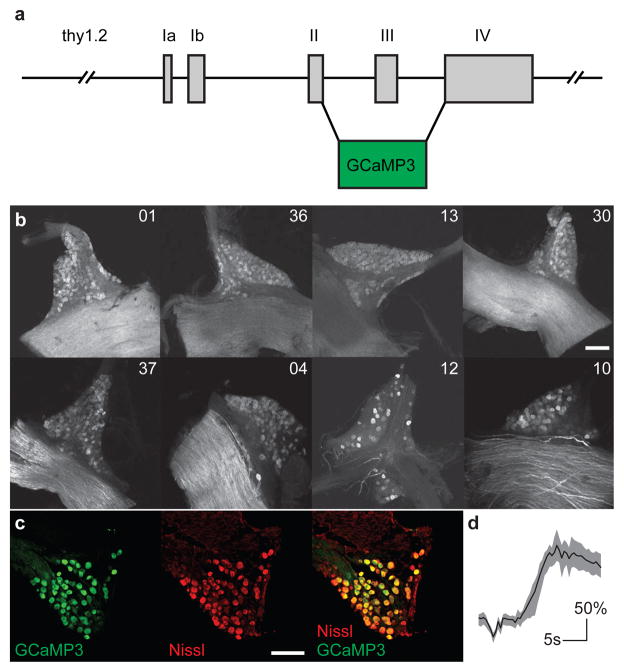
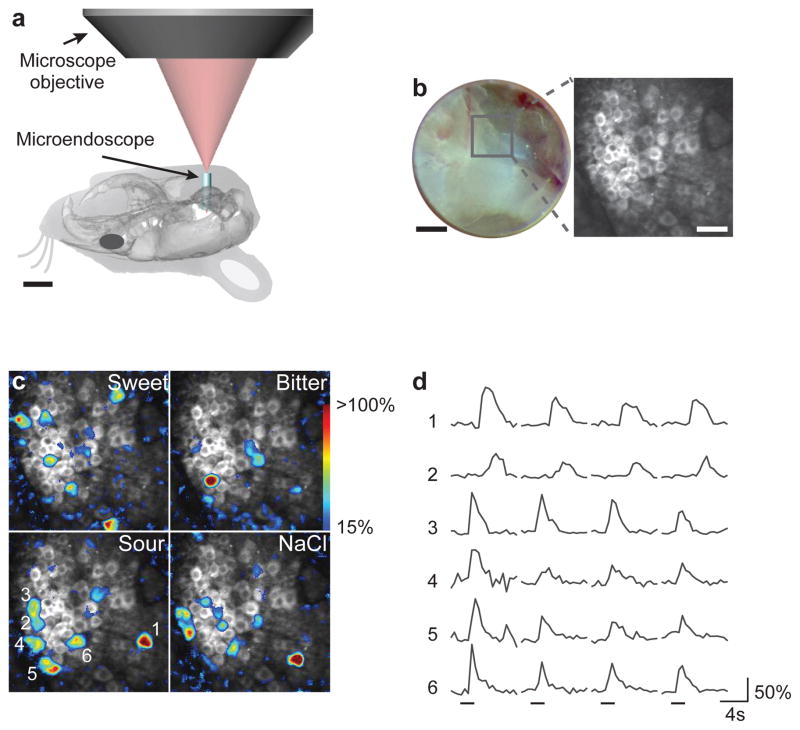
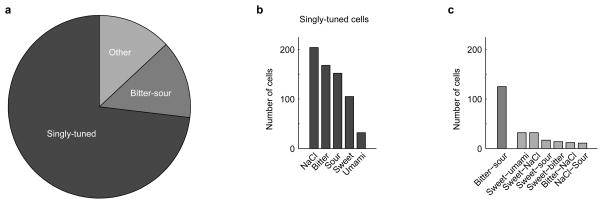
The mammalian taste system is responsible for sensing and responding to the five basic taste qualities: sweet, sour, bitter, salty and umami. Previously, we showed that each taste is detected by dedicated taste receptor cells (TRCs) on the tongue and palate epithelium. To understand how TRCs transmit information to higher neural centres, we examined the tuning properties of large ensembles of neurons in the first neural station of the gustatory system. Here, we generated and characterized a collection of transgenic mice expressing a genetically encoded calcium indicator in central and peripheral neurons, and used a gradient refractive index microendoscope combined with high-resolution two-photon microscopy to image taste responses from ganglion neurons buried deep at the base of the brain. Our results reveal fine selectivity in the taste preference of ganglion neurons; demonstrate a strong match between TRCs in the tongue and the principal neural afferents relaying taste information to the brain; and expose the highly specific transfer of taste information between taste cells and the central nervous system.


Figures

Extended Data Figure 1
Extended Data Figure 1. Thy1-GCaMP3 mice show normal physiological responses to tastants
a, Representative nerve recording traces from control and Thy1-GCaMP3 animals in response to various tastants (see Methods for details). b, Quantification of neural responses show that Thy1-GCaMP3 mice (n=4) are indistinguishable from wildtype mice (n = 3; Student’s t-test, NaCl: P = 0.85, Bitter: P = 0.46, Sour: P = 0.94, Sweet: P = 0.69, Umami: P = 0.77). Recordings were normalized to responses to KCl (500 mM). Horizontal bars below the traces mark the time and duration of the stimulus.
Extended Data Figure 2
Extended Data Figure 2. Reproducibility of tastant-evoked responses in geniculate ganglion neurons
a, Representative images of calcium-evoked GCaMP3 activity in response to sweet (left) and bitter (right) stimulation. Four relative fluorescence images are shown from separate trials. In each trial, the identical cell populations were activated. b, We tested 105 sweet responding cells and 168 bitter responding cells for their reproducibility in our automated scoring algorithm for four trials. The histograms show the number of times the cells responds all four times, three out of four, two out of four, and one out of four. c, Sample traces of four representative neurons challenged with 50 trials of the same tastant over a time window of 10 minutes. Note the high reliability in the activation of the neurons. This experiment also illustrates the desensitization of bitter neurons (bottom traces) over time. Horizontal bars below the traces mark the time and duration of the stimulus.
Extended Data Figure 3
Extended Data Figure 3. Quantification of taste ganglion responses
a–d, Rank-ordered plot of calcium transient amplitudes for various singly-tuned ganglion neurons (see text and Figure 3). For each cell, the mean response amplitudes for preferred stimulus (red) and the mean amplitude of its “next-strongest” tastant response (grey) are shown; minor dots indicate individual trial amplitudes. e, Quantification of mean response amplitudes in singly-tuned salt ganglion neurons before and after amiloride treatment (10 μM, n = 23 cells; paired t-test, P < 0.001). f, Quantification of mean response amplitudes in singly-tuned bitter cells before and after AITC treatment (3 mM, n = 63 cells; paired t-test, P < 0.001).
Extended Data Figure 4
Extended Data Figure 4. Bitter-sour ganglion cells receive taste information from bitter T2R-expressing cells
Distribution of bitter, sour, and bitter-sour ganglion cells in a sample of control animals (n = 4) and in animals expressing tetanus toxin in PKD2L1-expressing TRCs (PKD2L1-TeNT; n = 3). As expected, no cells responsive to citric acid (50 mM) are detected in PKD2L1-TeNT mice. However, “bitter-sour” cells are unaffected (see Figure 4), suggesting that activation of T2R-expressing TRCs mediates these acidic responses. As predicted, subsequent application of the bitter TRC inactivator AITC abolishes bitter responses of the bitter ganglion neurons, as well as the bitter and sour responses in the bitter-sour cells. Note that the solid bars showing less than 1 cell are used to illustrate the lack of responding cells.
Extended Data Figure 5
Extended Data Figure 5. Representation of taste quality does not cluster within the geniculate ganglion
a, Two-photon endoscopic image (left) of a geniculate ganglion expressing GCaMP3. Highlighted are the locations of the facial (VII) and greater superficial petrosal (GSP) cranial nerves (left panel). The right panel shows approximately 50 neurons color-coded according to their taste preference in this field. Sour: yellow, sweet: magenta, NaCl: green, bitter: cyan. Scalebar, 200 μm. b, Representative fields of the geniculate ganglion from 6 different animals. The random distribution of neurons representing the various taste qualities is independent of sensor, or method of sensor delivery/expression (AAV-GCaMP6 or Thy1-GCamP3; Color scheme same as for a).
Extended Data Figure 6
Extended Data Figure 6. Representation of taste mixtures
a, Imaging fields of three representative geniculate ganglia illustrating the ensembles of neurons recruited by two different single taste stimuli presented separately (left panels) versus the ensemble of neurons activated by a mixture of the two compounds presented together (right panels). See text for details; as expected there are no mixture-specific responders, and very few cells responded to each tastant in the mix: only 3 out of 113 cells examined with bitter+sweet responded to both tastants, 5 out of 301 cells examined with sour+salty responded to both, and zero of 39 examined with salty+sweet responded to both tastants. We note that sour stimuli are known to suppress sweet responses, but such suppression is sweet-cell autonomous and not due to interactions between sweet and sour TRCs (data not shown). b, To quantitatively examine the impact of taste mixes on the responses of individual ganglion neurons, we analyzed their response amplitudes in the presence of the single tastant versus the binary mix. Shown are plots of response amplitudes of a representative set of bitter, sweet, salty and sour geniculate neurons stimulated with their selective tastant (x axis) versus their response amplitude when in the presence of an additional tastant (as indicated in the y-axis; shown are average F/F over 4 trials). 95% confidence interval was determined using a ratio t-test: Bitter+Sweet/Bitter 0.73–0.91; Sweet+Bitter/Sweet 1.15–1.34; NaCl+Sour/NaCl 0.74–1.00; Sour+NaCl/Salt 0.95–1.16.
Figure 1
Figure 1. Thy1-GCaMP3 transgenic mice express functional GCaMP3 in taste ganglion cells
a, Structure of the Thy1.2 -GCaMP3 construct. b, Whole-mount confocal images of geniculate ganglion from 8 transgenic lines shows GCaMP3 expression in varying subsets of neurons. c, Line 1, used in our studies, expresses GCaMP3 in nearly all neurons (>90%, n = 6); compare Nissl-staining (red) versus GCaMP3 fluorescence (green). d, Ex vivo calcium imaging of a geniculate from Line 1 illustrating strong GCaMP3 responses to a test depolarizing solution (KCl, 500 mM); over 75% of imaged neurons responded with ΔF/F greater than 100% (n = 25 cells, mean ± quartile). Scalebars in bc, 100 μm.
Figure 2
Figure 2. In vivo two-photon microendoscopy of the geniculate ganglion
a, Diagram illustrating optical access to the geniculate ganglion. A 1-mm GRIN microendoscope was guided into the surgical opening, and imaged using two-photon microscopy. b, Brightfield image through the microendoscope (left), showing individual GCaMP-labeled neurons (right). c, Images of a ganglion with 25 GCaMP3 labeled neurons responding to sweet (acesulfame K, 30 mM), bitter (quinine, 5 mM), sour (citric acid, 50 mM) and NaCl (60 mM). Fluorescence amplitudes were pseudocolored according to ΔF/F (scale at right). d, Traces from six separate neurons (numbered in c) illustrating the time course of amplitude changes in GCaMP3 signals after sour stimulation. Horizontal bars mark the time and duration of the stimulus (inter-stimulus interval was 8s). Scale bars in a, 4 mm, b, 200 μm and 50 μm.
Figure 3
Figure 3. Selective responses of geniculate ganglion neurons
a, Responses of ten ganglion neurons to the five basic taste qualities. Black traces mark average ΔF/F from four individual trials per tastant (gray traces); horizontal bars mark the time and duration of the stimulus. b, Individual ganglion neurons exhibit strong taste preferences. The graph shows a rank-ordered plot of calcium transient amplitudes for 152 sour-responsive neurons. For each cell, the mean sour response amplitudes (red) and the mean amplitude of its next-strongest tastant response (grey) are shown; minor dots indicate individual trial amplitudes. The vast majority of these sour cells are strongly tuned to sour taste versus any other taste quality. c–d, Responses are highly selective. The ENaC inhibitor amiloride blocks NaCl responses (c), while the bitter-TRC inactivator AITC abolishes bitter responses (d); individual traces (gray) and average traces (black) are shown for two representative ganglion neurons before (−) and after (+) pharmacological application of the blockers to the tongue. e, Mice lacking T1R3 lack ganglion responses to sweet and umami stimuli. Black bars denote control animals (n = 8), and red bars T1R3 knockouts (n = 9).
Figure 4
Figure 4. Representation of taste in the primary sensory ganglia
a, Response profile of 904 ganglion neurons from 37 mice according to taste preference; singly-tuned cells (black; see panel b for breakdown), bitter-sour cells (gray), and broadly-tuned cells (light gray; see Extended Data Table 2). Importantly, the bitter-sour class actually reflects the activity of T2R-expressing (bitter) TRCs (see text for details)We note that acid responses from bitter cells are not readily visible in whole-nerve recordings,, likely reflecting sensitivity differences between single-cell imaging and “bulk” extracellular recordings. b–c, Distribution of ganglion neurons according to tastant selectivity.

Comment in

References

    1. Yarmolinsky DA, Zuker CS, Ryba NJP. Common sense about taste: from mammals to insects. Cell. 2009;139:234–244. doi: 10.1016/j.cell.2009.10.001. - DOI - PMC - PubMed
    1. Tian L, et al. Imaging neural activity in worms, flies and mice with improved GCaMP calcium indicators. Nature methods. 2009;6:875–881. doi: 10.1038/nmeth.1398. - DOI - PMC - PubMed
    1. Jung JC, Mehta AD, Aksay E, Stepnoski R, Schnitzer MJ. In vivo mammalian brain imaging using one- and two-photon fluorescence microendoscopy. Journal of neurophysiology. 2004;92:3121–3133. doi: 10.1152/jn.00234.2004. - DOI - PMC - PubMed
    1. Simon SA, de Araujo IE, Gutierrez R, Nicolelis MA. The neural mechanisms of gustation: a distributed processing code. Nature reviews Neuroscience. 2006;7:890–901. doi: 10.1038/nrn2006. - DOI - PubMed
    1. Chandrashekar J, et al. The cells and peripheral representation of sodium taste in mice. Nature. 2010;464:297–301. doi: 10.1038/nature08783. - DOI - PMC - PubMed

Publication types