. 2015 Jan 29;517(7536):608-11.
doi: 10.1038/nature13907. Epub 2014 Nov 10.

Resolving the complexity of the human genome using single-molecule sequencing

Affiliations

Resolving the complexity of the human genome using single-molecule sequencing

Mark J P Chaisson et al. Nature. .

Abstract

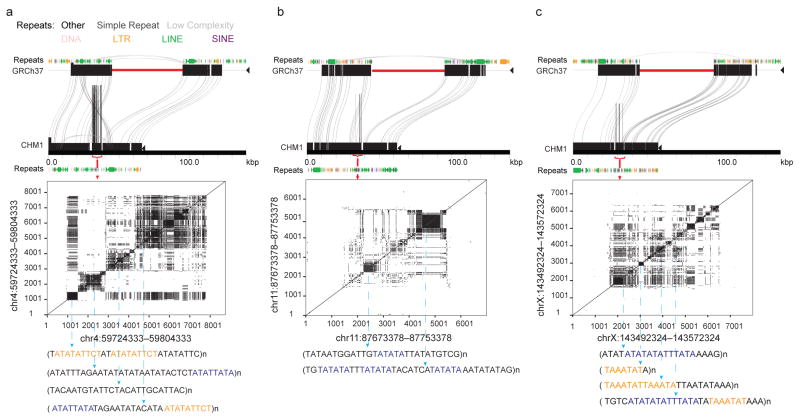
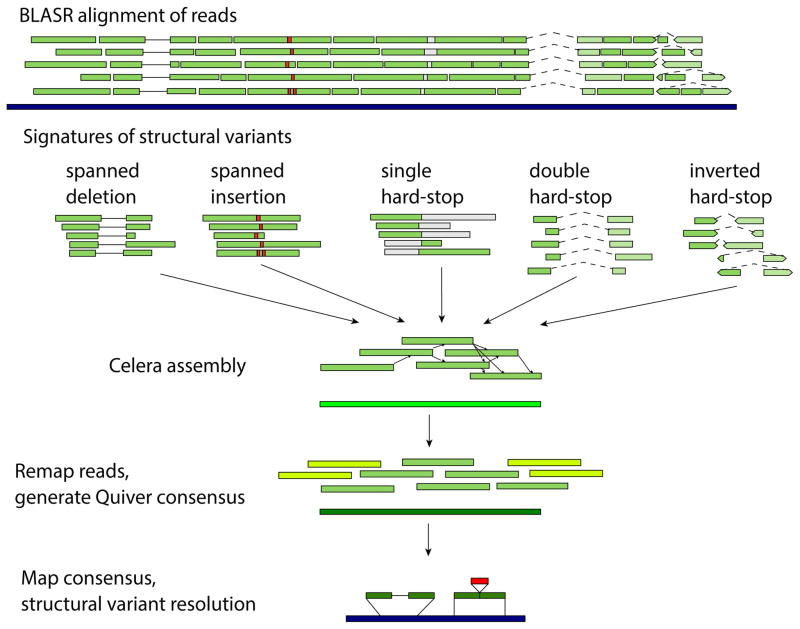
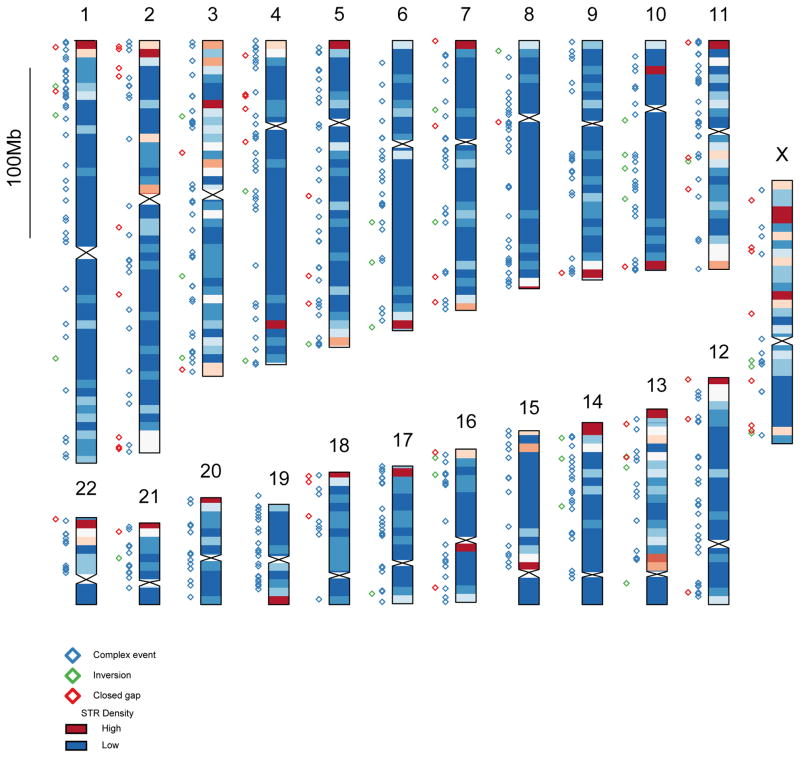
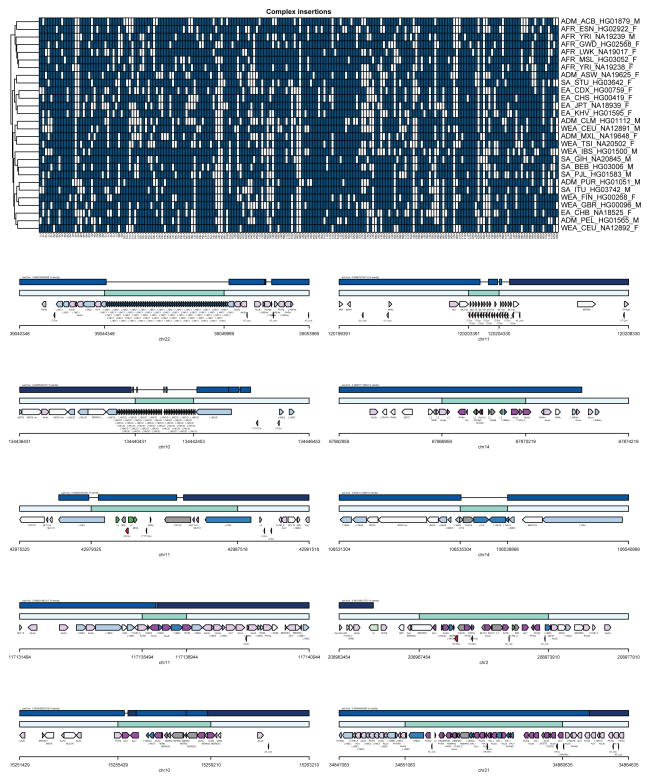
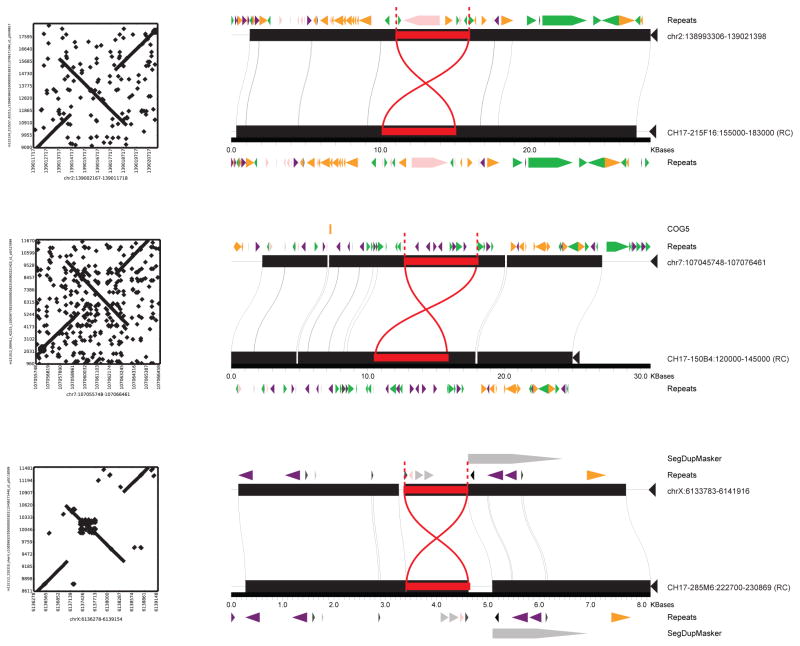
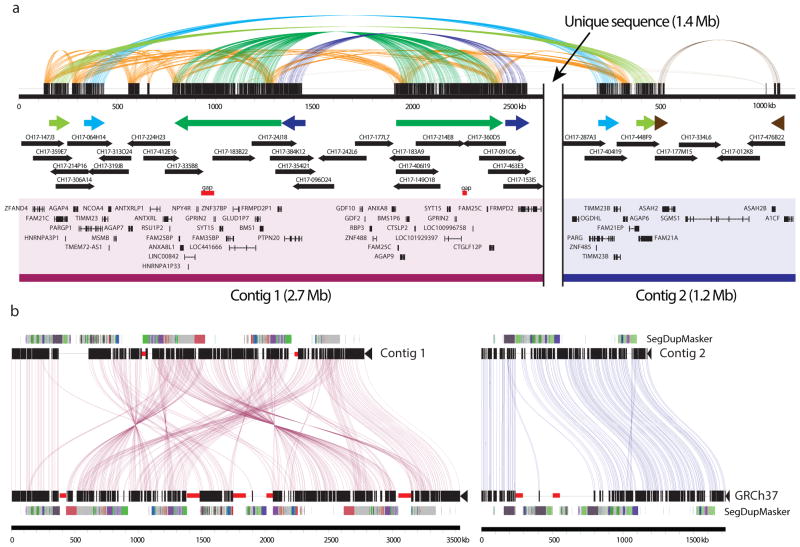
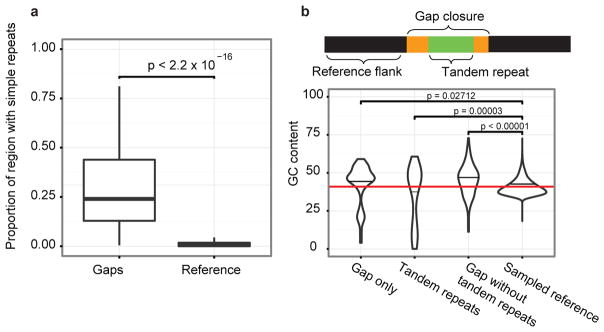
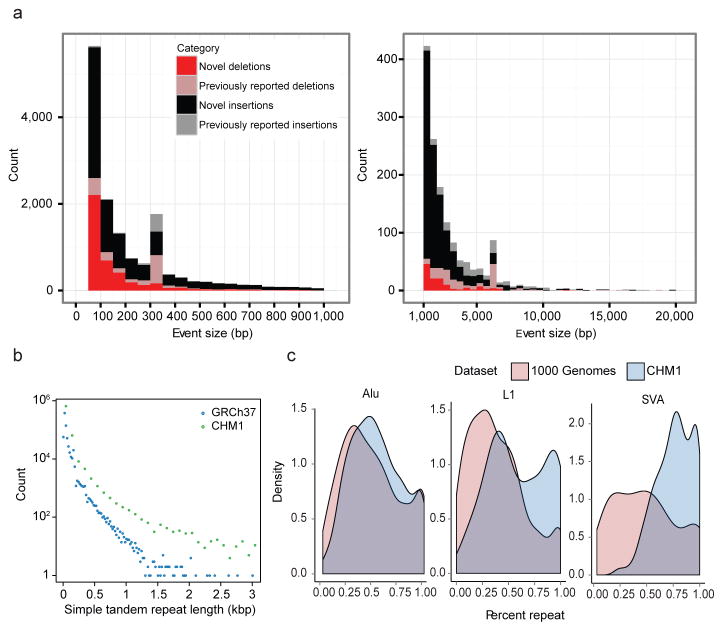
The human genome is arguably the most complete mammalian reference assembly, yet more than 160 euchromatic gaps remain and aspects of its structural variation remain poorly understood ten years after its completion. To identify missing sequence and genetic variation, here we sequence and analyse a haploid human genome (CHM1) using single-molecule, real-time DNA sequencing. We close or extend 55% of the remaining interstitial gaps in the human GRCh37 reference genome--78% of which carried long runs of degenerate short tandem repeats, often several kilobases in length, embedded within (G+C)-rich genomic regions. We resolve the complete sequence of 26,079 euchromatic structural variants at the base-pair level, including inversions, complex insertions and long tracts of tandem repeats. Most have not been previously reported, with the greatest increases in sensitivity occurring for events less than 5 kilobases in size. Compared to the human reference, we find a significant insertional bias (3:1) in regions corresponding to complex insertions and long short tandem repeats. Our results suggest a greater complexity of the human genome in the form of variation of longer and more complex repetitive DNA that can now be largely resolved with the application of this longer-read sequencing technology.


Conflict of interest statement

COMPETING FINANCIAL INTERESTS

The authors declare competing financial interests. M.B., J.L., M.W.H. and J.K. are employees of Pacific Biosciences, Inc., a company commercializing DNA sequencing technologies; E.E.E. is on the scientific advisory board (SAB) of DNAnexus, Inc. and was formerly an SAB member of Pacific Biosciences, Inc. (2009–2013) and SynapDx Corp. (2011–2013); and M.J.C. was a former employee for Pacific Biosciences, Inc.

Figures

Extended Data Figure 1
Extended Data Figure 1. Sequence content of gap closures
a, Gap closures are enriched for simple repeats compared to equivalently sized regions randomly sampled from GRCh37; examples of the organization of these regions is shown using Miropeats for (b) chromosome 4 (GRCh37, chr4:59724333-59804333), (c) chromosome 11 (GRCh37, chr11:87673378-87753378), and (d) chromosome X (GRCh37, chrX:143492324-143572324). Dotplots show the architecture of the degenerate STRs with the core motif highlighted below. Shared sequence motifs between blocks is indicated by color.
Extended Data Figure 2
Extended Data Figure 2. Variant detection pipeline
At every variant locus, we collected the full-length reads that overlap the locus, performed de novo assembly using the Celera assembler, and called a consensus using Quiver after remapping reads used in the assembly as well as reads flanking the assembly (yellow reads) to increase consensus quality at the boundaries of the assembly. BLASR is used to align the assembly consensus sequences to the reference, and insertions and deletions in the alignments are output as variants. Reads spanning a deletion event within a single alignment are shown as bars connected by a solid line, and double hard-stop reads spanning a larger deletion event and split into two separate alignments of the same read are shown as a dotted line.
Extended Data Figure 3
Extended Data Figure 3. Genome distribution of closed gaps and insertions
Chromosome ideogram heatmap depicts the normalized density of inserted CHM1 basepairs per 5 Mbp bin with a strong bias noted near the end of most chromosomes. Locations of SVs and closed gaps are given by colored diamonds to the left of each chromosome: closed gap sequences (red), inversions (green), and complex gaps (blue).
Extended Data Figure 4
Extended Data Figure 4. Confirmation of complex insertions in additional genomes
(top) Genotypes of polymorphic complex regions using read depth of unique k-mers (blue: present; white: absent). (bottom) Extended examples of complex insertion events: (dark blue) alignment to chimpanzee panTro4 reference; (light teal) existing human reference hg19; (dark teal) inserted sequence. The bottom rows show repeat annotations, with darker hues for repeats overlapping the inserted region.
Extended Data Figure 5
Extended Data Figure 5. Inversion validation by BAC-insert sequencing
Inversions detected by alignment of single long reads were validated by sequencing clones from the CHM1 BAC library (CHORI17) whose end mappings to GRCh37 spanned the putative inversions. Inversions were validated by aligning the corresponding BAC sequences to GRCh37 with Miropeats. Shared sequence between the BACs and GRCh37 is shown in black while inversion events are indicated in red.
Extended Data Figure 6
Extended Data Figure 6. CHM1 clone-based assembly of the human 10q11 genomic region
a, The clone-based assembly is composed primarily of BACs from the CH17 library as shown in the tiling path below the internal repeat structure of the region. Colored arrows indicate large segmental duplications with homologous sequences connected by colored lines (Miropeats). Genes annotated from alignment of RefSeq mRNA sequences with GMAP are shown. b, Miropeats comparisons of the 10q11 clone-based assembly against the corresponding sequence from GRCh37, with gaps shown in red highlights the degree to which the reference was misassembled.
Figure 1
Figure 1. Sequence content of gap closures
a, Gap closures are enriched for simple repeats compared to equivalently sized regions randomly sampled from GRCh37. b, Human genome gaps typically consist of GC-rich sequence flanking complex AT-rich STRs (empirical p-value; Supplementary Information).
Figure 2
Figure 2. Structural variation analyses
a, Histograms display the distribution of novel insertions (black/grey) and deletions (red/pink) between CHM1 and GRCh37 haplotypes compared to copy number variants (CNVs) identified from other studies. Most of the increased sensitivity occurs below 5 kbp. Peaks at ~300 and 6 kbp correspond to Alu and L1 insertions, respectively. b, STR insertions in CHM1 (green) are longer when compared to the human genome (blue) and this effect becomes more pronounced with increasing length (x-axis). c, The percent repeat composition (x-axis) of 1 kbp sequences flanking insertion sites for Alu, L1, and SVA MEIs. Insertion calls from the 1000 Genomes Project (light red) compared to calls from CHM1 using PacBio reads (blue) show increased sensitivity for repeat-rich insertions.
Figure 3
Figure 3. CHM1 clone-based assembly of the human 10q11 genomic region
The clone-based assembly is composed primarily of BACs from the CH17 library as shown in the tiling path below the internal repeat structure of the region. Colored arrows indicate large segmental duplications with homologous sequences connected by lines generated by Miropeats.

References

    1. 1000 Genomes Project Consortium. An integrated map of genetic variation from 1. 092 human genomes. Nature. 2012;491:56–65. - PMC - PubMed
    1. The International HapMap Project Consortium. Nature. 2003;426:789–796. - PubMed
    1. International Human Genome Sequencing Consortium. Finishing the euchromatic sequence of the human genome. Nature. 2004;431:931–945. - PubMed
    1. Kurahashi H, et al. Molecular cloning of a translocation breakpoint hotspot in 22q11. Genome Research. 2007;17:461–469. - PMC - PubMed
    1. Genovese G, et al. Using population admixture to help complete maps of the human genome. Nature Genetics. 2013;45:406–414. 414e401–402. - PMC - PubMed

Publication types