. 2014 Dec;17(12):1784-1792.
doi: 10.1038/nn.3865. Epub 2014 Nov 10.

A category-free neural population supports evolving demands during decision-making

Affiliations

A category-free neural population supports evolving demands during decision-making

David Raposo et al. Nat Neurosci. 2014 Dec.

Abstract

The posterior parietal cortex (PPC) receives diverse inputs and is involved in a dizzying array of behaviors. These many behaviors could rely on distinct categories of neurons specialized to represent particular variables or could rely on a single population of PPC neurons that is leveraged in different ways. To distinguish these possibilities, we evaluated rat PPC neurons recorded during multisensory decisions. Newly designed tests revealed that task parameters and temporal response features were distributed randomly across neurons, without evidence of categories. This suggests that PPC neurons constitute a dynamic network that is decoded according to the animal's present needs. To test for an additional signature of a dynamic network, we compared moments when behavioral demands differed: decision and movement. Our new state-space analysis revealed that the network explored different dimensions during decision and movement. These observations suggest that a single network of neurons can support the evolving behavioral demands of decision-making.


Figures
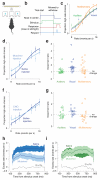
Figure 1
Figure 1. Multisensory decision-making in rodents: behavior and inactivation
a, Schematic drawing of rat in behavioral apparatus. Visual stimuli were presented via a panel of diffused LEDs (top); auditory stimuli were presented via a centrally positioned speaker. b, Schematic of task timeline. c, Example data (818 trials; 1 session) from a single animal (rat 4). Smooth lines are fits (cumulative Gaussian). Error bars reflect the Wilson binomial confidence interval. d-e, Effects of muscimol inactivation. d, Example psychometric functions for 1 animal (visual trials only). Dark blue: a single session following saline injection. Light blue: a single session the next day following muscimol injection. e, Effects of inactivation on performance for auditory (green), visual (blue) and multisensory (orange) trials. Ordinate: impairment ratio: the ratio of values for σ parameter from cumulative Gaussian fit to the data (Online Methods). A value of 1 indicates no effect; values > 1 indicate performance was worse on a single inactivation session (muscimol) relative to the previous control session (saline). Symbols: individual animals (N = 2); horizontal lines: median across animals and sessions. f,g, Same as d,e but for separate inactivation experiments implemented with DREADD (N = 2). h-i, Effect of stimulus on decisions. h, Excess rate is higher for a single rat on visual trials with saline (dark blue) vs. muscimol (light blue) sessions. Values on abscissa: centers of sliding windows. Shaded regions: confidence bounds (mean ± s.e.m.). i, Excess rate for the same rat on auditory trials with saline (dark green) and muscimol (light green).
Figure 2
Figure 2. PPC neurons show mixed selectivity for choice and modality
Plots display visual/auditory trials; for multisensory trials, see Supplementary Figure 4-5. a-d, Peri-stimulus time histograms for four single neurons. Mean spike counts were computed in 10 ms time windows smoothed with a Gaussian (σ = 50 ms). Error trials were excluded. Trials grouped by stimulus rate. Solid line: low rate stimulus; dashed line: high rate stimulus. Color indicates modality. Transparent fills: s.e.m. Responses aligned to the time the visual or auditory stimulus began (“Stim”). a, Neuron reflects mainly categorical choice (392 trials). b, Neuron reflects mainly stimulus modality (414 trials). c, Neuron mixes categorical choice and modality (586 trials). Arrow highlights ambiguous moment in which high rate visual and low rate auditory stimuli gave rise to the same firing rate. d, Neuron mixes categorical choice and modality and displays complex temporal dynamics (440 trials). e, Choice divergence (Online Methods) for auditory trials (green; average of 262 neurons) and visual trials (blue; average of 268 neurons), and modality divergence (black; average of 266 neurons). Transparent fills: s.e.m. (bootstrap). f, Histogram of choice preference for auditory trials, measured 200 ms before decision end. Filled bars indicate neurons where index was significantly different from 0 (p < 0.01, 1000 bootstraps). g, Same as (f) but for visual trials. h, Same as (f-g), but for modality.
Figure 3
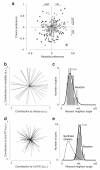
Figure 3. Neural responses defy categorization
a, Choice and modality preferences are unrelated. Each point shows values for a single neuron. Abscissa: average modality preference for high- and low-rate trials. Ordinate: choice preference for visual trials. A nearly identical outcome was achieved when choice preference was computed from auditory trials (data not shown). Shading indicates significance: open: neither choice nor modality preference was significant; gray: choice or modality preference was significant; black: choice and modality preference were significant. Top circled point shows modality-selective neuron in panel (2b); lower circled point shows mixed selectivity neuron in panel (2c). Dashed lines define a region along which neurons would tend to cluster if they had pure selectivity for choice or modality. b, Low-dimensional summaries of neurons’ responses. Each line is a “feature vector” showing the degree to which each neuron contributes to choice and modality. c, Neurons are rarely more similar to one another than expected by chance. Histogram shows the distribution of angles between each neuron and its nearest neighbors (N = 45 neurons, Rat 5). Black line: distribution of nearest-neighbor angles for random 2-D vectors. d, Low-dimensional summaries of neurons’ responses. Responses are shown projected into 2 dimensions of 8 used total. Each vector shows the contribution of one neuron to the two dimensions. The apparently random distribution of vectors suggests that neurons do not tend to cluster. e, Neurons are rarely more similar to one another than expected by chance. Histogram shows the distribution of angles between each neuron and its nearest neighbors (N = 77 neurons; Rat 1). Black line: distribution of nearest-neighbor angles for random 8-D vectors. Dashed: distribution of nearest-neighbor angles is left-shifted when “synthetic clusters” are introduced (Online Methods).
Figure 4
Figure 4. Choice and modality can be decoded from population activity
a, Weighted sums of neural responses; weights were chosen by the classifier. Blue, visual; green, auditory; dashed lines: high-rate trials; solid lines: low-rate trials. Data from Rat 4, N = 94 neurons. b, The choice decoder could correctly classify responses as left vs. right on trials where the rat was successful (bright red traces, one per rat), but is at chance for auditory vs. visual (blue traces). On trials where the rat chose the incorrect port, the decode tracked the rat’s choice (brown traces). Traces reflect the average of 1000 classifications. c, Same as (b) for all 5 rats, correct trials only. Each animal has one trace for modality and one for choice. d, Bars: values of the weights used to generate the traces in (a), ordered by magnitude. Purple lines: values of randomly generated 94-dimensional vectors ordered by magnitude. e-h, Same as a-d but for the modality decoder. The modality decode was nearly identical whether the rats chose the correct or incorrect port (f, bright vs. dark blue).
Figure 5
Figure 5. PPC neurons exhibit different covariance patterns during decision formation and movement
a, Example neuron with a sustained preference for high rate stimuli (dashed line above solid line). Responses were aligned to stimulus onset (left) and to movement onset (right). Alignment to these two events was necessary because the time between the stimulus end and the animal’s movement varied slightly from trial to trial. Traces reflect averaged responses of all correct visual trials (and s.e.m.) computed as in Figure 2a-d. b, Example neuron that switched its preference over the course of the trial. c, Choice preference during decision formation (200 ms before decision end, abscissa) and movement (200 ms after animal leaves choice port, ordinate), frequently differed but were nonetheless correlated across all cells; N = 268 neurons, r = 0.302, p < 0.001. Symbols: individual animals. d-g, Two-dimensional projections of decision-epoch data (same data for all panels). Magenta ellipses indicate 1 s.d. of the data projected into the space specified by the panel’s title. Color/linestyle are the same as in Figure 2. d, Space chosen as first two PCs of decision-epoch data. e, Space chosen as first two PCs of movement-epoch data. f, Space chosen randomly from top 8 PCs. g, Space chosen as PCs 7-8 of decision-epoch data. h, Variance Alignment analysis indicates that activity patterns across neurons differ substantially (and are not just, e.g., scaled) for decision formation vs. movement. Ordinate: decision variance captured in the dimensions used during movement, normalized by how much could maximally be captured in the same number of dimensions. Abscissa: cumulative dimensions included. Black trace: data; other traces: alignment values expected under several scenarios for comparison (see labels). i, Same as (h) except that ordinate shows amount of decision variance for visual trials captured in the dimensions used on multisensory trials, normalized by how much could maximally be captured in the same number of dimensions. Note that unlike (d), the black “data” trace is close to 1, as expected. j, Strength of stimulus modulation for each neuron correlates with strength of movement modulation. Data in (d-j) from Rat 4.

References

    1. Barlow HB. Summation and inhibition in the frog’s retina. The Journal of physiology. 1953;119:69–88. - PMC - PubMed
    1. Kuffler SW. Discharge patterns and functional organization of mammalian retina. J Neurophysiol. 1953;16:37–68. - PubMed
    1. Britten KH, Newsome WT, Shadlen MN, Celebrini S, Movshon JA. A relationship between behavioral choice and the visual responses of neurons in macaque MT. Visual neuroscience. 1996;13:87–100. - PubMed
    1. Nienborg H, Cumming BG. Macaque V2 neurons, but not V1 neurons, show choice-related activity. J Neurosci. 2006;26:9567–9578. doi:26/37/9567 [pii] 10.1523/JNEUROSCI.2256-06.2006. - PMC - PubMed
    1. Roitman JD, Shadlen MN. Response of neurons in the lateral intraparietal area during a combined visual discrimination reaction time task. J Neurosci. 2002;22:9475–9489. doi:22/21/9475 [pii] - PMC - PubMed

Publication types

LinkOut - more resources