. 2014 Dec;46(12):1311-20.
doi: 10.1038/ng.3142. Epub 2014 Nov 10.

Analysis of nascent RNA identifies a unified architecture of initiation regions at mammalian promoters and enhancers

Affiliations

Analysis of nascent RNA identifies a unified architecture of initiation regions at mammalian promoters and enhancers

Leighton J Core et al. Nat Genet. 2014 Dec.

Abstract

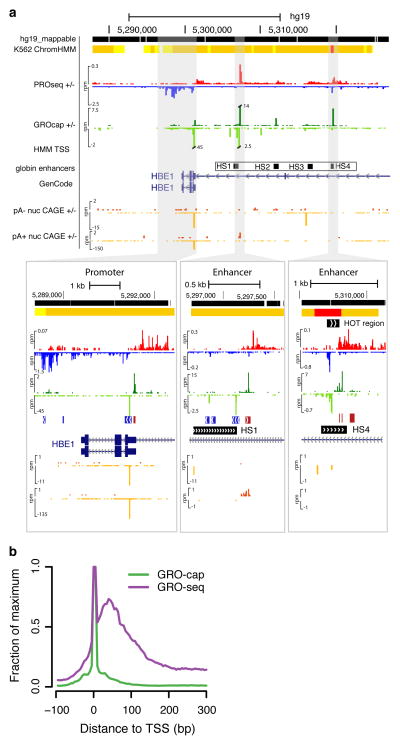
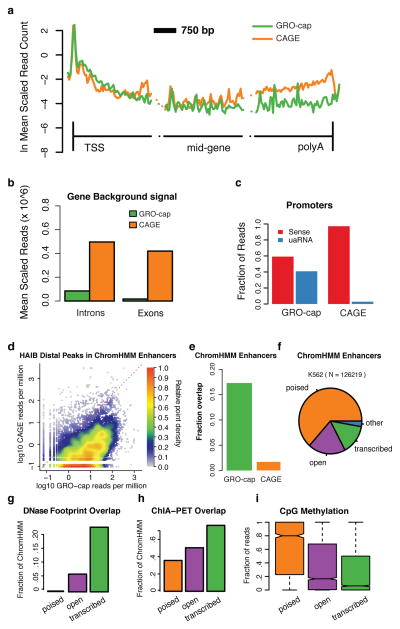
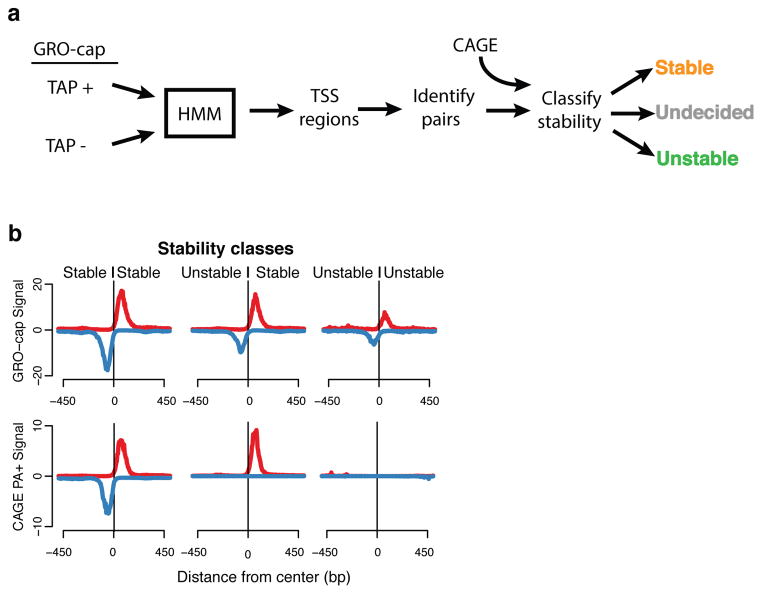
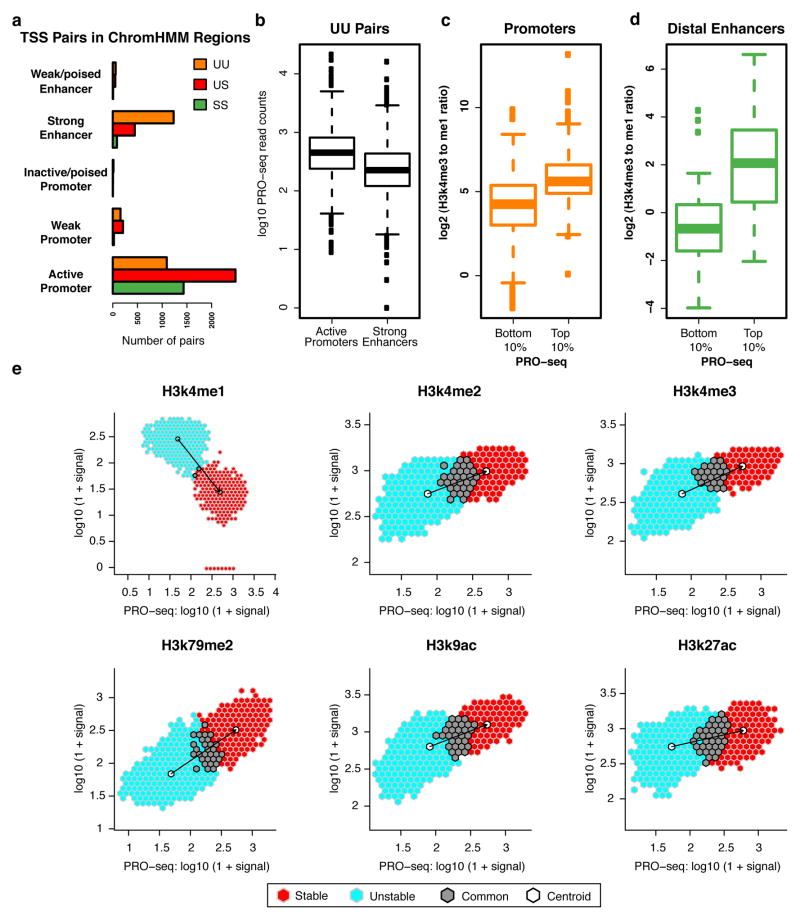
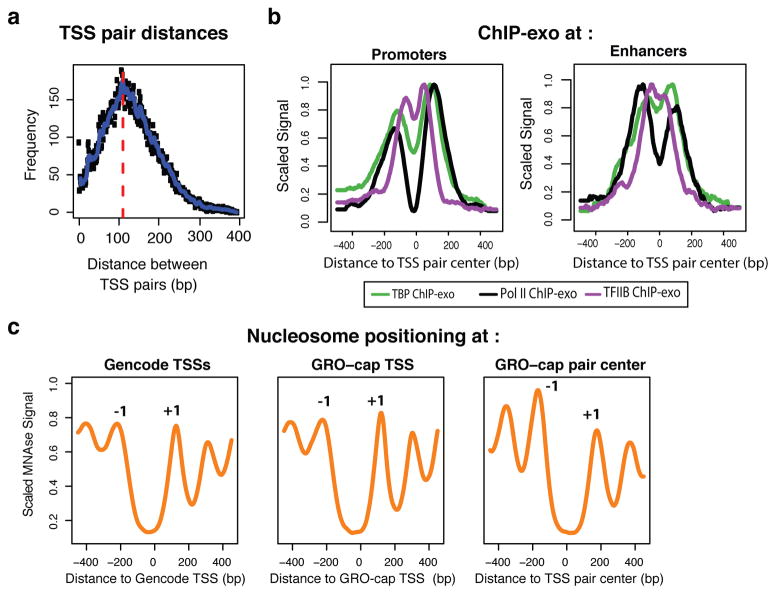
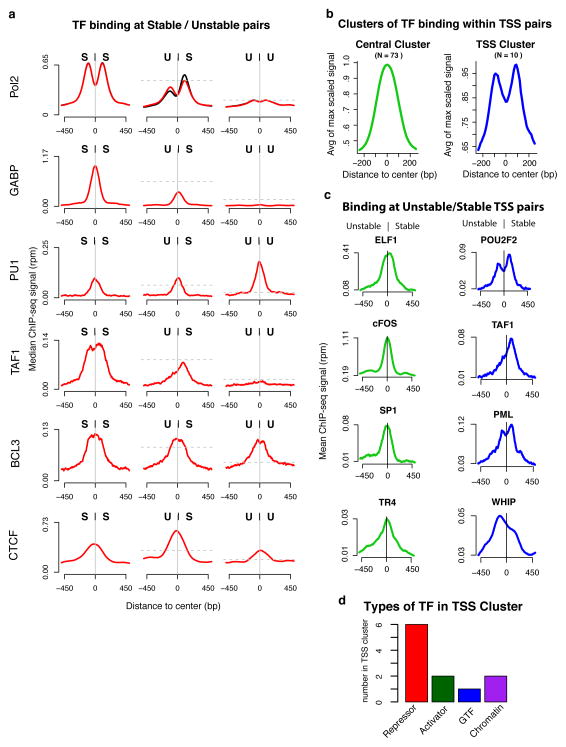
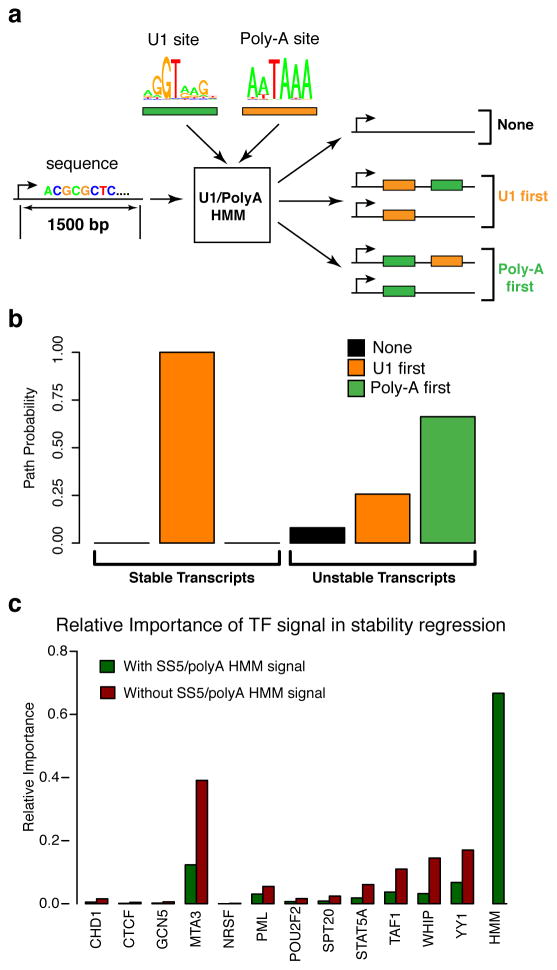
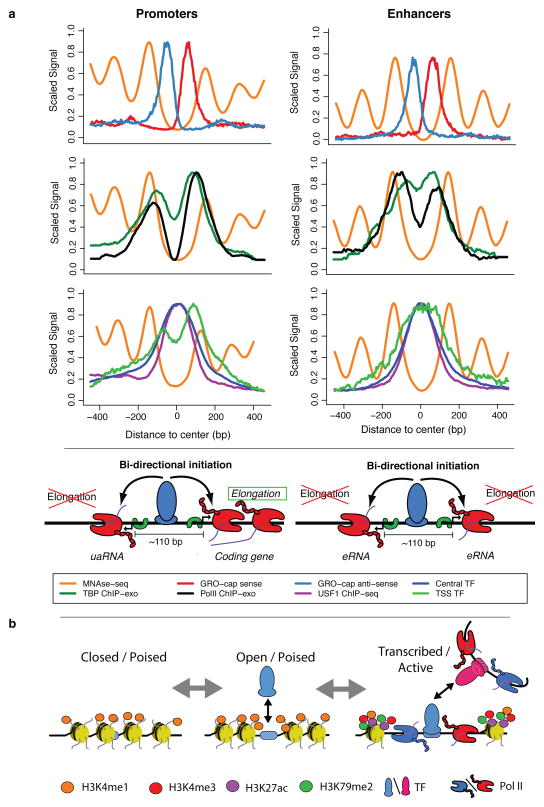
Despite the conventional distinction between them, promoters and enhancers share many features in mammals, including divergent transcription and similar modes of transcription factor binding. Here we examine the architecture of transcription initiation through comprehensive mapping of transcription start sites (TSSs) in human lymphoblastoid B cell (GM12878) and chronic myelogenous leukemic (K562) ENCODE Tier 1 cell lines. Using a nuclear run-on protocol called GRO-cap, which captures TSSs for both stable and unstable transcripts, we conduct detailed comparisons of thousands of promoters and enhancers in human cells. These analyses identify a common architecture of initiation, including tightly spaced (110 bp apart) divergent initiation, similar frequencies of core promoter sequence elements, highly positioned flanking nucleosomes and two modes of transcription factor binding. Post-initiation transcript stability provides a more fundamental distinction between promoters and enhancers than patterns of histone modification and association of transcription factors or co-activators. These results support a unified model of transcription initiation at promoters and enhancers.


Figures

Figure 1
Figure 1. GRO-cap identifies TSSs in promoters and enhancers
(a) A UCSC genome browser shot of the globin locus near the LCR using K562 cell line data sets generated or used in this study. The locus contains a portion of the beta-globin locus, including the globin epsilon gene and LCR enhancers. The insets are zoomed in views of the shaded regions that show the divergent GRO-cap (+ strand: dark green, − strand: light green) signal at the epsilon-globin promoter (left) and two enhancers associated with the hypersensitive site (HS) 1 (center) and HS4 (right). The locations of the HS sites are taken from probe locations in Ashe et al. . ChromHMM regions track is shown on top, with predicted promoters indicated in red and enhancers in orange. Note that CAGE signal (+ strand: dark orange, - strand: light orange) is at background levels in the enhancer region. (b) GRO-cap dramatically enriches the signal for initiation sites when compared with GRO-seq. Composite GRO-seq and GRO-cap reads from the cell line plotted relative to all GENCODE TSSs.
Figure 2
Figure 2. Comparison of GRO-cap with CAGE
(a) GRO-cap and CAGE profiles at protein-coding genes. Genes are broken into three 3 Kb regions covering region around the TSS, the middle of the gene, and near 3′-cleavage/poly-A site. The vertical lines represent the TSS and 3′-cleavage site. (b) Average read density in interior introns and exons (excluding the first and last of each) as a measure of GRO-cap and CAGE background signals. (c) GRO-cap and CAGE relative fraction of reads aligned to sense and divergent (uaRNA) directions at protein-coding genes (counted within underlying ChromHMM region). (d) Density scatterplot showing the signal intensity (reads per million) for GRO-cap vs. CAGE surrounding distal transcription factor ChIP-seq peaks from the Hudson Alpha Institute for Biotechnology (HAIB). (e) Fraction of ChromHMM regions containing a detectable GRO-cap (green) or CAGE (orange) TSS. (f) Comparing enhancer regions based on chromatin marks (ChromHMM Enhancers, Ernst. et al. ) with DNAse HS (OpenChrommatin consortium) and GRO-cap, reveals three main classes of enhancer regions, poised (no DNAse HS peak nor GRO-cap TSS; orange, n = 1624), open (DNAse HS peak, but no GRO-cap TSS; purple; n= 3740) and transcribed (DNAse HS peak and GRO-cap TSS; green), and a negligible ‘other’ (no DNAse HS peak but with GRO-cap TSS; blue; n = 4703). (g–i) These three classes represent a progression in terms of functional activity, as measured by (g) an increase in detectable transcription factor footprints (Wellington footprints on DNAse HS,), (h) chromatin links (ChIA-PET overlap,) and (i) a significant reduction in CpG methylation between each transition The center line of the boxplot represents the median, the boxes encompass the interquartile range, and the whiskers extend to the minimum and maximum.
Figure 3
Figure 3. TSS identification and classification
(a) TSS regions were identified with a hidden Markov model (HMM) from GRO-cap reads and control (GM12878: 117,613; K562: 128,471), and combined into pairs of divergent TSSs which where then classified according to the presence of CAGE signal. (b) Composite profiles of GRO-cap and CAGE aligned to the center of GRO-cap TSS pairs after classifying pairs based on the stability of the transcript produced. Profiles are stable::stable (left), unstable::stable (center), unstable::unstable (right). Y-axes are the median read counts in 5 bp windows.
Figure 4
Figure 4. Histone marks at enhancers and promoters scale with Pol II intensity
(a) Number of TSS pairs from each stability class mapping to different regulatory regions as designated by ChromHMM. (b) UU pairs mapping to active promoter regions (n = 1478) have a higher PRO-seq signal than those mapping to strong enhancer regions (n =3171), where active promoters and strong enhancers are defined by ChromHMM. (c-d) Ratio of mono- to tri-methylation of H3k4 at top and bottom deciles of PRO-seq signal in both (c) promoter (n = 247, 248; top and bottom deciles, respectively) and (d) enhancer TSS regions (n = 91 and 97; top and bottom deciles, respectively). (e) PRO-seq signal versus indicated histone modifications at TSS regions. Signal is further split between TSSs classified as unstable (light blue), stable (red), and points that overlap between the two (grey). Centroid for each subset in white.
Figure 5
Figure 5. Architecture of TSS pairs
(a) Divergent TSSs are tightly packed, with an estimated 110 bp inter-TSS distance, as estimated from the overall distribution of opposing strand read distances. (b) ChIP-exo profile for Pol II (black), TBP (green) and TFIIB (purple), centered on TSS pairs and split between promoter (top) and enhancer (bottom) regions (ChromHMM). (c) Mnase-seq profiles at protein-coding promoters, aligned either by GENCODE annotations (left; also positive for GRO-cap signal), GRO-cap TSS at GENCODE promoters (center), or to GRO-cap TSS pair centers (right). Peaks corresponding to -1 and +1 nucleosomes are indicated.
Figure 6
Figure 6. Modes of transcription factor binding at TSS pairs
(a) Representative ChIP-seq profiles of different modes of transcription factor binding at different TSS pair stability classes. Signals are subject to paired subsampling to correct for Pol II signal dependency (top plot, Methods). The y axes are the median read density in 5bp windows. The horizontal dashed lines represent the expected peak signal level if the signal followed the scaling of Pol II relative to the SS panel. (b) ENCODE transcription factor ChIP-seq profiles, anchored on TSS pairs, cluster into two distinct groups, central binders (green) and TSS binders (blue). (c) Examples of the two positional modes of binding at US (Unstable, Stable) pairs. (d) Classification of factors within the TSS binding cluster. The total number of factors in d are greater than the number of TSS binding factors because factors can be part of more than one functional group (see Supplemental table 2).
Figure 7
Figure 7. Determinants of RNA stability for both promoters and enhancers
(a) Diagram of transcript U1/poly-A classification. Each transcript (first 1.5kbp) is processed through an HMM to determine relative order and occurrence of SS5 and PAS elements. (b) Estimated path probabilities of alternative element occurrences (neither SS5 nor PAS: black, SS5 first: orange, PAS first: green) obtained by applying the EM algorithm to each transcript subset (stable and unstable TSS stability classes). (c) Relative importance of various transcript factors in a logistic regression of the stability classes, with (green) and without (red) including the U1/poly-A HMM derived signal (posterior path probability of being in unstable class).
Figure 8
Figure 8. Summary of transcription initiation at regulatory regions
(a) Our analysis of TSSs reveals a common structure across all initiation regions, including promoters and enhancers. In both cases, (first row) a tightly packed (110 bp \apart) divergent TSS pair (+ strand: red, − strand: blue) surrounded by well-positioned nucleosomes (orange), with independent pre-initiation complexes (separate TBP (green) and Pol II ChIP-exo peaks (black), second row) and sharing two distinct transcription factor cluster binding modes (central: green, over TSS: blue; third row). We propose that central, activator transcription factor binding (USF1 example: purple), in conjunction with core promoter elements, determines the positioning of the divergent initiation sites. Finally, DNA sequence properties (not depicted here), possibly in cooperation with other factors, determine the resulting transcript type (stable/elongating: protein coding, unstable/terminating: uaRNA, eRNA, etc.). (b) A model depicting possible progression of enhancer states from chromatin marked but largely inaccessible regions (left), followed by more open regions through transcription factor binding (center) and finally, active transcription, which brings with it the associated chromatin marks (in particular, H3K79me2 and H3K27ac and increased methylation levels of H3K4; right).

Comment in

References

    1. Kapranov P, et al. RNA maps reveal new RNA classes and a possible function for pervasive transcription. Science. 2007;316:1484–1488. - PubMed
    1. Core LJ, Waterfall J, Lis J. Nascent RNA sequencing reveals widespread pausing and divergent initiation at human promoters. Science. 2008 - PMC - PubMed
    1. Seila AC, et al. Divergent transcription from active promoters. Science. 2008;322:1849–1851. - PMC - PubMed
    1. Almada AE, Wu X, Kriz AJ, Burge CB, Sharp PA. Promoter directionality is controlled by U1 snRNP and polyadenylation signals. Nature. 2013;499:360–363. - PMC - PubMed
    1. Ntini E, et al. Polyadenylation site-induced decay of upstream transcripts enforces promoter directionality. Nat Struct Mol Biol. 2013;20:923–928. - PubMed

Publication types

Associated data