. 2014 Dec;20(12):1458-63.
doi: 10.1038/nm.3709. Epub 2014 Nov 10.

Immune complexes stimulate CCR7-dependent dendritic cell migration to lymph nodes

Affiliations

Immune complexes stimulate CCR7-dependent dendritic cell migration to lymph nodes

Menna R Clatworthy et al. Nat Med. 2014 Dec.

Abstract

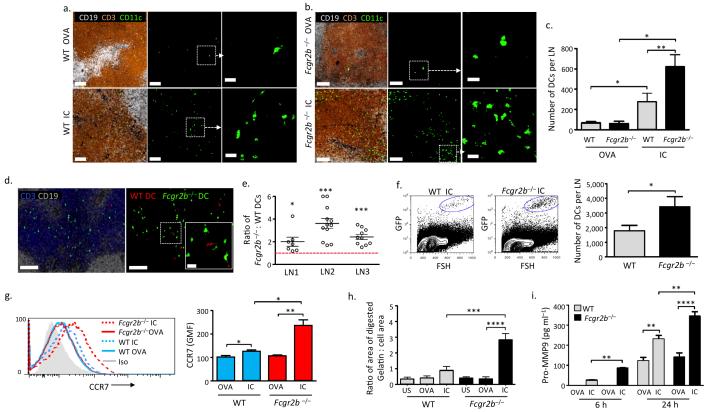
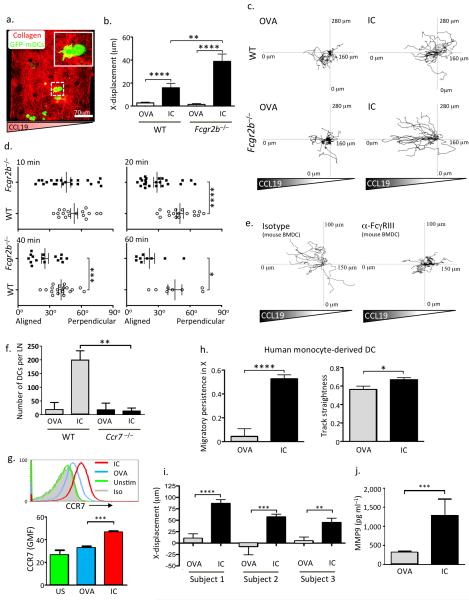
Antibodies are critical for defense against a variety of microbes, but they may also be pathogenic in some autoimmune diseases. Many effector functions of antibodies are mediated by Fcγ receptors (FcγRs), which are found on most immune cells, including dendritic cells (DCs)-important antigen-presenting cells that play a central role in inducing antigen-specific tolerance or immunity. Following antigen acquisition in peripheral tissues, DCs migrate to draining lymph nodes via the lymphatics to present antigen to T cells. Here we demonstrate that FcγR engagement by IgG immune complexes (ICs) stimulates DC migration from peripheral tissues to the paracortex of draining lymph nodes. In vitro, IC-stimulated mouse and human DCs showed greater directional migration in a chemokine (C-C) ligand 19 (CCL19) gradient and increased chemokine (C-C) receptor 7 (CCR7) expression. Using intravital two-photon microscopy, we observed that local administration of IC resulted in dermal DC mobilization. We confirmed that dermal DC migration to lymph nodes depended on CCR7 and increased in the absence of the inhibitory receptor FcγRIIB. These observations have relevance to autoimmunity because autoantibody-containing serum from humans with systemic lupus erythematosus (SLE) and from a mouse model of SLE also increased dermal DC migration in vivo, suggesting that this process may occur in lupus, potentially driving the inappropriate localization of autoantigen-bearing DCs.


Figures

Figure 1
Figure 1. Immune complexes increase CCR7 expression, matrix metalloprotease production, and migration of murine bone marrow-derived DCs
Representative images of a draining lymph node 48 hours following subcutaneous transfer of bone marrow-derived DCs (BMDCs) (green) from WT (a) or Fcgr2b−/− (b) mice incubated with ovalbumin (OVA, upper panels) or IgG-opsonised ovalbumin (IC, lower panels) for 24 hours prior to transfer. B cell follicles shown in white (CD19) and T cells (CD3) in brown. Scale bars in left and middle panels = 80 μm. Right panels show high power image (scale bars = 20 μm). (c) Total number of WT and Fcgr2b−/− DCs per lymph node 48 hours following transfer, as enumerated from serial 50μm sections. Graph shows mean and standard error of mean (SEM). (d) Representative images of draining lymph node 48 hours following the transfer of BMDCs from WT (red) and Fcgr2b−/− (green) mice stimulated for 24 hours with IC. B cell stained with CD19 (white) and T cells with CD3 (blue). Scale bar = 100μm. Inset shows high power image of area outlined by white square (scale bar = 20μm). (e) Ratio of Fcgr2b−/− to WT IC-stimulated BMDCs in the paracortex of three lymph nodes (LN) 48 hours following subcutaneous transfer. Each point represents the ratio observed in a 50μm section. Bars show mean and standard error of mean. Red dashed line marks a ratio of 1 (value of equivalent DC migration). (f) Representative flow cytometric data from dissociated lymph nodes 48 hours following transfer of GFP+ mouse BMDCs. IC-stimulated WT BMDCs are shown in left panel and Fcgr2b−/− BMDCs in the middle panel. Right panel shows quantification of lymph node BMDCs by flow cytometry 48 hours following transfer (Mean and SEM from 7 lymph nodes from 4 mice in each group). (g) Representative histograms of CCR7 expression on WT (blue lines) and Fcgr2b−/− (red lines) BMDCs following 24 hours of incubation with OVA (solid lines) or IC (dotted lines) (left panel) and geometric mean fluorescence (GMF) of CCR7 staining in WT and Fcgr2b−/− BMDCs (right panel). (h) Gelatinase production as quantified by area of FITC-gelatin digested over 24 hours by DCs following FcγR cross-linking with IC. Graph shows mean and SEM values obtained from combined result of three separate experiments. (i) MMP-9 levels in culture supernatants obtained from WT and Fcgr2b−/− BMDCs 6 and 24 hours following incubation with OVA or IC. Graph shows mean and SEM of triplicates from representative experiment of three repeats. P values calculated using a Student’s t test (two-tailed). * = P ≤ 0.05, ** = P ≤ 0.01, *** = P ≤ 0.001, **** = P ≤ 0.0001.
Figure 2
Figure 2. Immune complex FcγR engagement promotes chemokine-directed mouse and human DC migration in vitro
(a) Representative image of WT bone marrow-derived DCs ((BMDCs), GFP, green) embedded in a collagen matrix (red) prior to the application of a CCL19 gradient. (b) X-displacement of WT and Fcgr2b−/− BMDCs incubated with ovalbumin (OVA) or IgG-opsonised ovalbumin (IC) for 24 hours prior to incorporation within a collagen matrix and subsequent exposure to a CCL19 gradient. Graphs show mean and SEM of values obtained from one collagen gel, representative of at least three experimental replicates. (c) Representative migration tracks in a CCL19 gradient of WT (upper panels) and Fcgr2b−/− (lower panels) BMDCs incubated with OVA (left panels) or IC (right panels) for 24 hours prior to suspension in the collagen matrix. (d) Angle of leading protrusion relative to chemokine gradient of WT (open circles) and Fcgr2b−/− (filled squares) BMDCs suspended in a collagen matrix at 10, 20, 40, and 60 minutes following application of CCL19 gradient. Angles closer to 0° indicate cell polarization parallel to the gradient. (e) Representative migration tracks in a CCL19 gradient of BMDCs incubated with IC, either in the presence of an FcγRIII blocking antibody (right panel) or an isotype control antibody (left panel). (f) Quantification of number of WT and Ccr7−/− DCs within draining lymph nodes 48 hours following subcutaneous transfer. Mean and SEM from 6 lymph nodes from 3 mice in each group shown. (g) CCR7 expression on human monocyte-derived DCs incubated with OVA (blue line) or IC (red line) for 24 hours. Representative histograms are shown in the upper panel and GMF and SEM of triplicates from one of three replicates shown in the lower panel. (h) Migratory persistence in X (left panel) and track straightness (right panel) of human monocyte-derived DCs in a human CCL19 gradient following incubated with OVA or IC for 24 hours prior. Values represent the mean and SEM from cells migrating in at least three collagen gels per subject and from three healthy subjects. (i) X-displacement of human monocyte-derived DCs from 3 subjects following application of a CCL19 gradient. Values represent the mean and SEM. (j) MMP-9 levels in culture supernatants obtained from human monocyte-derived DCs isolated from 3 healthy subjects. Values represent the mean and SEM. In (c) and (e), tracks are derived from a single collagen gel and representative of three similar experiments. P values calculated using a Students t test (two-tailed). * = P ≤ 0.05, ** = P ≤ 0.01, *** = P ≤ 0.001, **** = P ≤ 0.0001.
Figure 3
Figure 3. Immune complexes stimulate CCR7-dependent dermal dendritic cell migration to lymph nodes in vivo
(a) Footpad dermal DCs (green) were imaged by two-photon microscopy in WT CD11cEYFP (upper panels) and Fcgr2b−/− CD11cEYFP mice (lower panels), 16 hours following the administration of ovalbumin (OVA) or IgG-opsonised ovalbumin (IC) subcutaneously to the footpad. Blood vessels are shown in red (Qdots IV) and cell tracks over an 80 minute period shown in white. Scale bars = 50 μm. Quantification of displacement and persistence index for dermal DCs from three mice in each group is shown in (b). (c) Sequential images obtained by intravital two-photon microscopy of the footpad 16 hours after IC administration. Movement of a dermal DC (green) tracked (white broken line) through a dermal lymphatic vessel (LYVE-1, red). Scale bars = 10 μm. Representative flow cytometric plots and quantification of live/FITC+/MHCIIhigh/CD11c+ cells in draining lymph nodes in WT and Fcgr2b−/− mice (d and e) and WT and Ccr7−/− mice (f and g) 48 hours after application of FITC to skin followed by intradermal administration of OVA or IC as indicated. Mean and SEM from 4 mice in each group shown. P values calculated using a Students t test (two-tailed). (h) Quantification of live/FITC+/MHCIIhigh/CD11c+ cells present in draining lymph nodes of WT mice treated with MMP-9 blocking antibody or isotype control prior to application of FITC to skin with intradermal administration of OVA or IC. Mean and SEM from 4 mice in each group shown. P values calculated using a paired t test to compare lymph nodes draining skin treated with OVA (left inguinal) and IC (right inguinal) or non-draining lymph nodes (brachial) from the same mouse. * = P ≤ 0.05, ** = P ≤ 0.01, *** = P ≤ 0.001, **** = P ≤ 0.0001.
Figure 4
Figure 4. Murine and human lupus sera stimulate dermal dendritic cell migration to lymph nodes in vivo
(a) Cell tracks (white) of footpad dermal DCs (green) 16 hours following the administration of heat-inactivated, aged WT mouse serum, or serum obtained from autoimmune NZB/W F1 mice. Blood vessels shown in red (Qdots IV) and cell tracks over an 80 minute period in white. Scale bar = 50μm. Quantification of displacement and persistence index of dermal DCs from three mice in each group is shown in (b). (c) Quantification of displacement and persistence index of footpad dermal DCs in CD11cEYFP mice 16 hours following the administration of heat-inactivated, NZB/W F1 mouse serum containing IgG (IgG+) or an aliquot depleted of IgG (IgG-). (d) Number of live/FITC+/MHCIIhigh/CD11c+ cells per draining lymph node in WT mice and (e) Representative flow cytometric plots (left panel) and quantification (right panel) of FITC+/MHCIIhigh/CD11c+/EPCAM+ (Langerhans cells) and CD11c+/CD103+ (dermal DCs) in draining lymph nodes 48 hours after application of FITC to skin in mice given heat-inactivated WT (open circles) or SLE (black circles) serum intraperitoneally 12 hours previously. Each circle in d and e represents quantification from a single lymph node. (f) Number of CD11c+/MHCIIhigh/CD103+ cells in renal lymph nodes of aged NZM mice with lupus nephritis and aged-match NZW controls. Graphs show mean and SEM of lymph nodes taken from four mice. (g) Representative cell tracks (white) of footpad dermal DCs (green) and (h) Quantification of displacement and persistence index of dermal DCs in WT mice 16 hours following the administration of heat-inactivated serum obtained from healthy controls or from patients with SLE. Scale bar in g = 50 μm. Graphs show values from mice treated with three healthy control sera (open circles) or from three SLE patients with low disease activity (BILAG scores 2-9, filled squares, ‘SLE low’) or three SLE patients with high disease activity (BILAG scores 15-21, open squares, ‘SLE high’). (i) CCR7 expression on WT U937 cells or those stably expressing FcγRIIB-I232 or FcγRIIB-T232 24 hours following incubation with OVA or IC. Graph shows mean and SEM of duplicates from one of three experiments. In (b), (c), and (h) each point represents a single dermal DC, and the bar shows the mean value. P values calculated using a Students t test (two-tailed). * = P ≤ 0.05, ** = P ≤ 0.01, *** = P ≤ 0.001, **** = P ≤ 0.0001.

References

    1. Banchereau J, Steinman RM. Dendritic cells and the control of immunity. Nature. 1998;392:245–252. - PubMed
    1. Steinman RM. Decisions about dendritic cells: past, present, and future. Annu Rev Immunol. 2012;30:1–22. - PubMed
    1. Krause RM, Dimmock NJ, Morens DM. Summary of antibody workshop: The Role of Humoral Immunity in the Treatment and Prevention of Emerging and Extant Infectious Diseases. J Infect Dis. 1997;176:549–559. - PubMed
    1. Joller N, Weber SS, Oxenius A. Antibody-Fc receptor interactions in protection against intracellular pathogens. Eur J Immunol. 2011;41:889–897. - PubMed
    1. Ravetch JV, Bolland S. IgG Fc receptors. Annu Rev Immunol. 2001;19:275–290. - PubMed

Supplementary references

    1. Schaefer BC, Schaefer ML, Kappler JW, Marrack P, Kedl RM. Observation of antigen-dependent CD8+ T-cell/ dendritic cell interactions in vivo. Cell Immunol. 2001;214:110–122. - PubMed
    1. Lindquist RL, et al. Visualizing dendritic cell networks in vivo. Nat Immunol. 2004;5:1243–1250. - PubMed
    1. Lammermann T, et al. Rapid leukocyte migration by integrin-independent flowing and squeezing. Nature. 2008;453:51–55. - PubMed
    1. Bowden ET, Coopman PJ, Mueller SC. Invadopodia: unique methods for measurement of extracellular matrix degradation in vitro. Methods Cell Biol. 2001;63:613–627. - PubMed
    1. Haessler U, Pisano M, Wu M, Swartz MA. Dendritic cell chemotaxis in 3D under defined chemokine gradients reveals differential response to ligands CCL21 and CCL19. Proc Natl Acad Sci U S A. 2011;108:5614–5619. - PMC - PubMed

Publication types