Clinical Trial

Germinal center reentries of BCL2-overexpressing B cells drive follicular lymphoma progression

Stéphanie Sungalee et al. J Clin Invest. 2014 Dec.

Abstract

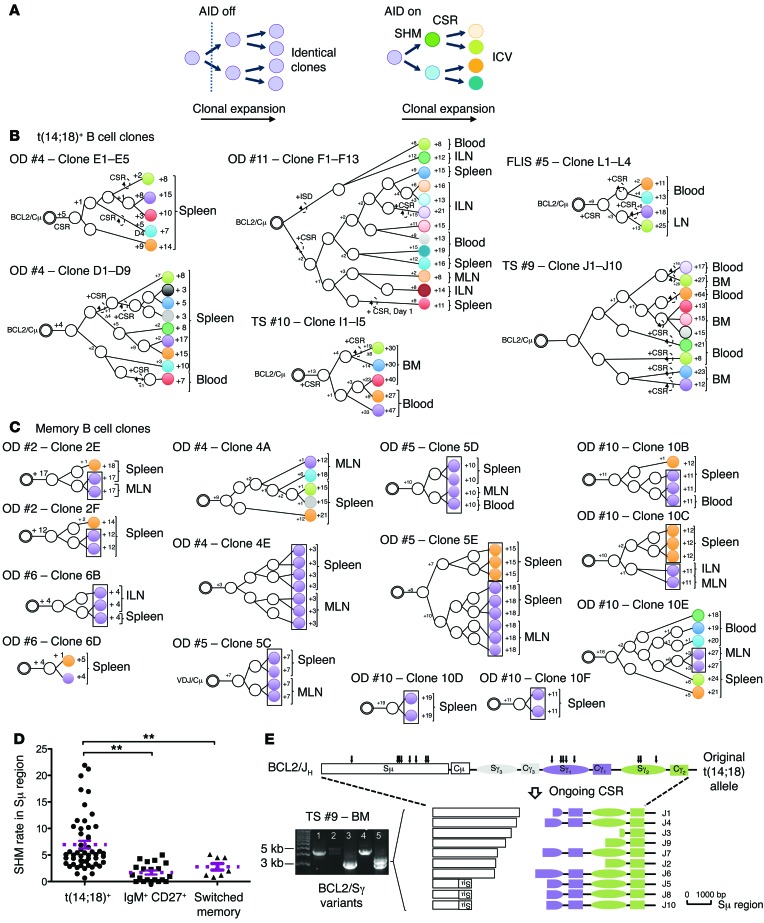
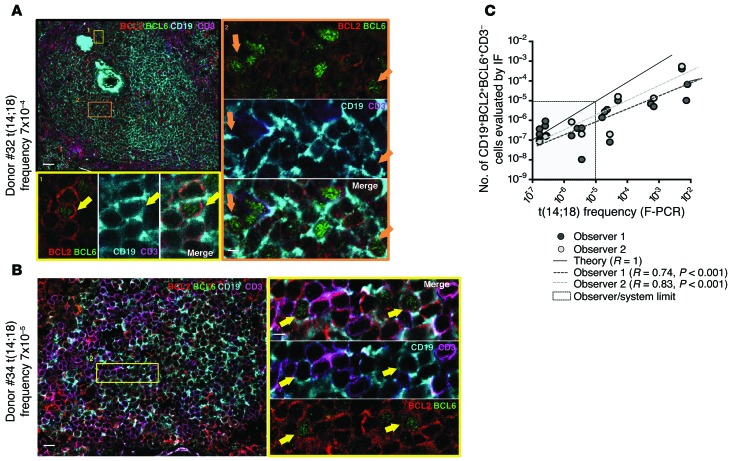
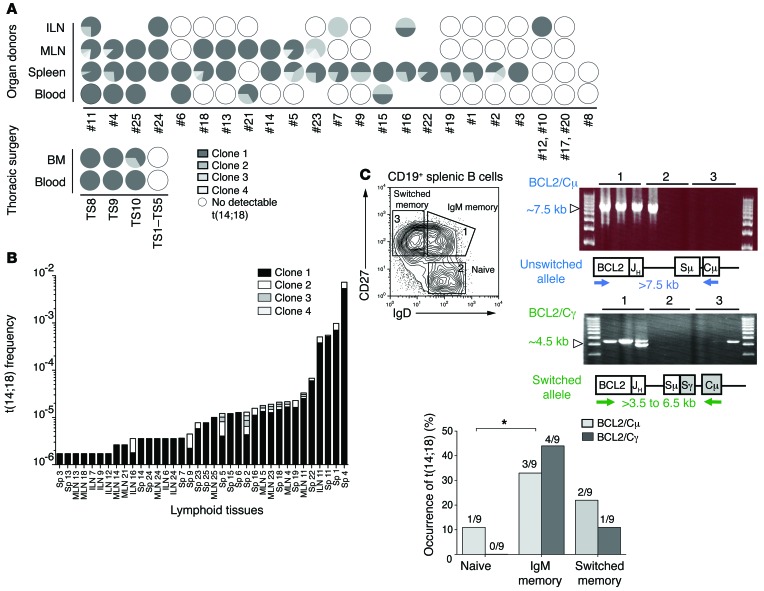
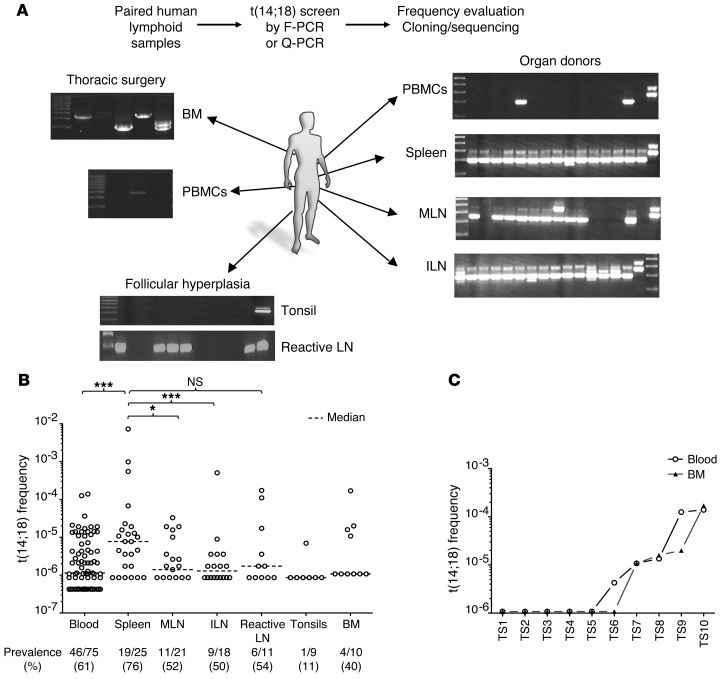
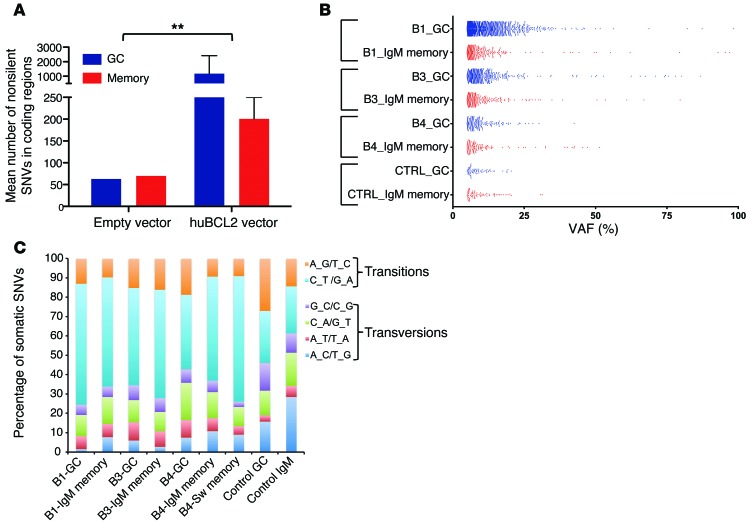
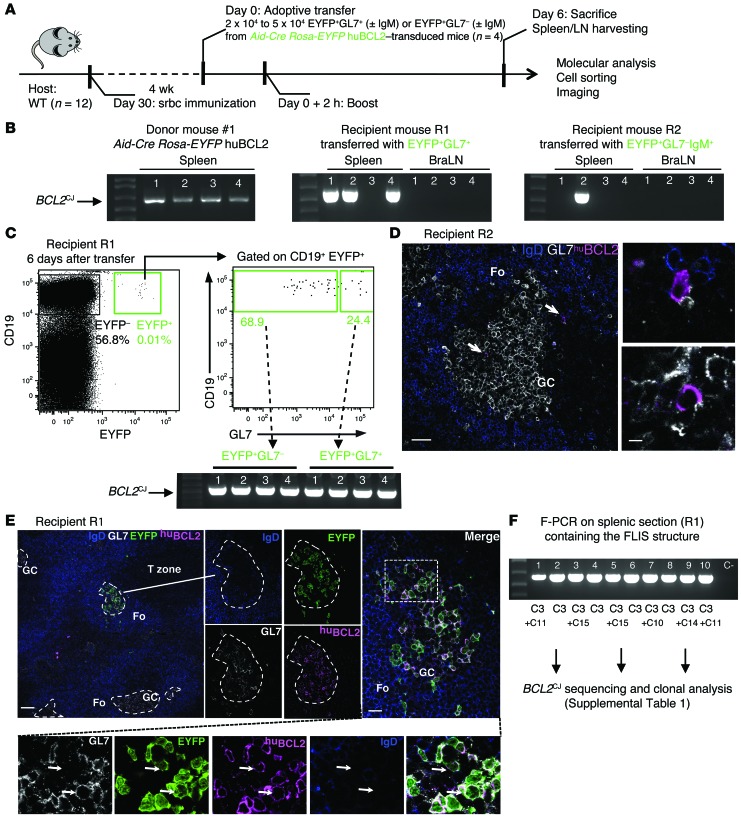
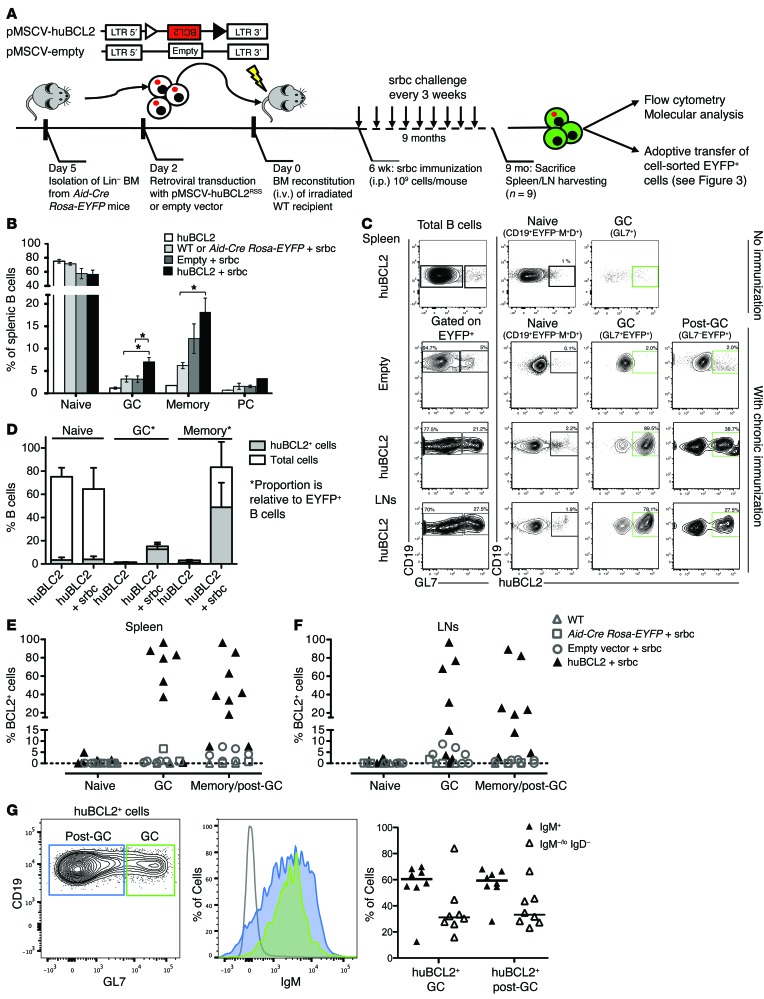
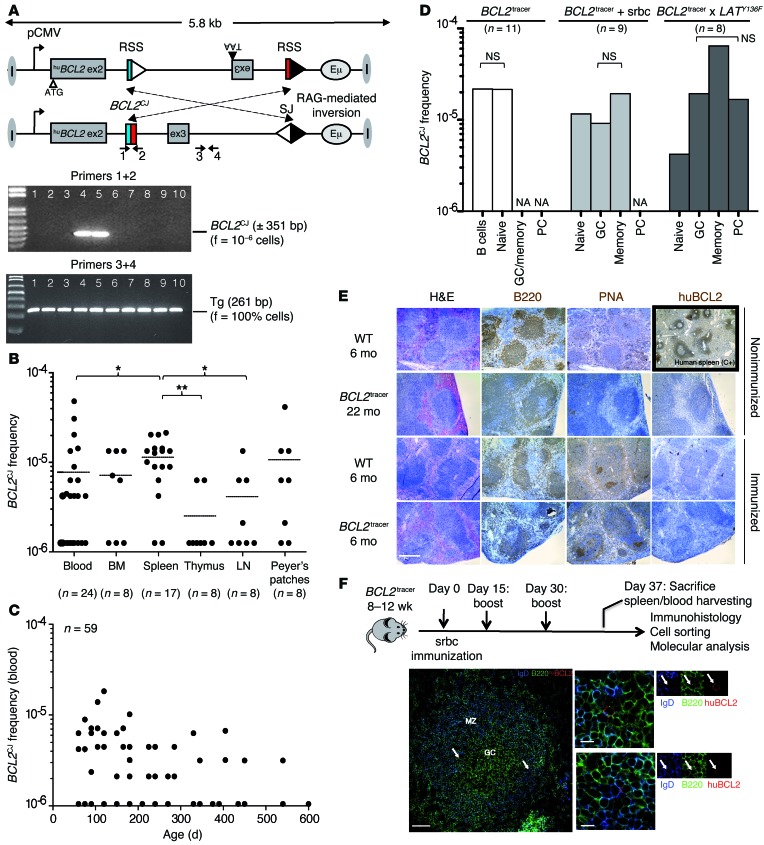
It has recently been demonstrated that memory B cells can reenter and reengage germinal center (GC) reactions, opening the possibility that multi-hit lymphomagenesis gradually occurs throughout life during successive immunological challenges. Here, we investigated this scenario in follicular lymphoma (FL), an indolent GC-derived malignancy. We developed a mouse model that recapitulates the FL hallmark t(14;18) translocation, which results in constitutive activation of antiapoptotic protein B cell lymphoma 2 (BCL2) in a subset of B cells, and applied a combination of molecular and immunofluorescence approaches to track normal and t(14;18)(+) memory B cells in human and BCL2-overexpressing B cells in murine lymphoid tissues. BCL2-overexpressing B cells required multiple GC transits before acquiring FL-associated developmental arrest and presenting as GC B cells with constitutive activation-induced cytidine deaminase (AID) mutator activity. Moreover, multiple reentries into the GC were necessary for the progression to advanced precursor stages of FL. Together, our results demonstrate that protracted subversion of immune dynamics contributes to early dissemination and progression of t(14;18)(+) precursors and shapes the systemic presentation of FL patients.


Figures

Figure 8
Figure 8. Clonal divergence between FLLCs and memory B cells in blood and tissues.
(A) Schematic representation of ICV accumulating during clonal expansion in the presence of AID. Distinct subclones are designated with distinct colors. (B) Genealogical trees generated from t(14;18)+ subclones issued from 4 organ donors and 1 FLIS. Trees are rooted from an identical BCL2/JH breakpoint and organized based on ICV in the Sμ/Sγ regions of the translocated allele. Shared mutations were used to define putative intermediate filiation (white circles). Stepwise accumulation of mutations is indicated by the numbers above the branches (+1 to +64). Total mutations are summarized at the end of each branch. Dashed arrows indicate ongoing CSR. ISD, intra-switch deletion. (C) Genealogical trees generated from memory B cells issued from 5 organ donors. Trees are rooted from an identical VH (D)JH junction and organized based on ICV in the VH region. Identical subclones (no ICV) are boxed. (D) SHM rate in the switch regions from t(14;18)+ B cells, IgM+CD27+ B cells, and switched memory B cells. The rate is given as a percentage per 1,000 bp. (E) Aberrant CSR in t(14;18)+ variants from a paired BM/blood sample (TS #9). The amplified PCR fragments were cloned and sequenced. Arrows indicate the positions of ongoing CSR breaks and are represented below. Some clones displayed an inversion of part of the Sμ region. OD, organ donor; TS, thoracic surgery.
Figure 7
Figure 7. Resident t(14;18)+ cells coexpressing BCL2 and BCL6 in organ donors’ secondary lymphoid organs.
(A and B) Representative IF staining of 2 organ donors’ t(14;18)+ spleens. CD3neg BCL2+/BCL6+/CD19+ cells are indicated with yellow arrows. (C) Correlation plot showing the frequency of CD3neg BCL2+/BCL6+/CD19+ triple-positive cells evaluated by IF against the frequency of t(14;18)+ cells evaluated by F-PCR. The theoretical value (R = 1) is shown. Two independent observers performed the IF measurements. Scale bars: 50 μm (A, left) and 5 μm (A, right); 30 μm (B, left) and 5 μm (B, right).
Figure 6
Figure 6. Molecular characterization of resident t(14;18)+ cells in lymphoid organs from healthy donors.
(A) Relative clonal distribution in paired samples (compiled from Supplemental Table 7). Each clone [defined as t(14;18) from the indicated donor displaying the same BCL2/JH breakpoint] is coded by gray shading within the circles. White circles indicate t(14;18) samples; absence of a circle indicates that the tissue was not available. (B) Clonal expansion in organ donor’s samples. Clones from above are coded by gray shading according to their relative frequency in the indicated tissue and individual. Sp, spleen. (C) Geno-phenotypic characterization of resident t(14;18)+ clones. Top panel (left): Cell-sorting strategy of splenic B cell subsets (according to CD19, CD27, IgD, and IgM expression. Top panel (right): Representative long-range F-PCR on indicated B cell subsets. BCL2/Sμ amplifies unswitched translocated alleles; BCL2/Sγ amplified switched translocated alleles. Bottom panel: Overall distribution of switched versus unswitched t(14;18) alleles in the B cell subsets from 3 human samples (see Supplemental Table 9 for raw data). Cμ, constant mu region; Cγ, constant γ region; Sμ, switch mu region; Sγ, switch γ region.
Figure 5
Figure 5. t(14;18)+ cells are present in blood, BM, and lymphoid organs from healthy individuals.
(A) Representative F-PCR screen of t(14;18)+ cells in paired lymphoid tissue samples from organ donors. F-PCR and quantitative-PCR (Q-PCR) analysis allowed determination of both t(14;18) frequency and clonality (through BCL2/JH breakpoint sequencing). (B) Prevalence and frequency of t(14;18)+ cells in lymphoid organs and blood (compiled from Supplemental Table 7); additional blood samples were obtained from a blood bank. The detection threshold was approximately 10–6. (C) Prevalence and frequency of t(14;18)+ cells in paired BM and blood samples from thoracic surgeries. ILN, iliac LN; MLN, mesenteric LN; PBMCs, peripheral blood mononuclear cells. *P < 0.05, ***P < 0.005.
Figure 4
Figure 4. Somatic mutation analysis of BCL2-enriched GC and post-GC subsets by exome sequencing.
(A) Histograms of the mean number (± SEM) of nonsilent SNVs in BCL2-enriched GC and post-GC subsets from BCL2 and control mice. (B) Frequency distribution of VAFs for all the gene loci variants identified in each B cell subset from BCL2-transduced versus control (empty vector) mice. (C) Base-level transitions and transversions of all variant loci shown in B.
Figure 3
Figure 3. BCL2+ GC and post-GC B cells are able to reenter and reactivate GC reactions during repeated antigenic challenges.
(A) Schematic of the adoptive transfer procedure. (B) Representative F-PCR analysis of BCL2CJ junctions in total spleen and LNs harvested before (left panel) and after adoptive transfer of the indicated EYFP+ cell subpopulations (middle and right panel). BraLN, brachial LN. (C) FACS plots showing the retrieved EYPF+ cells in recipient mouse R1 6 days after adoptive transfer of EYFP+GL7+ cells and F-PCR analysis of BCL2CJ in FACS-sorted EYFP+GL7+ and EYFP+GL7 cells. 650 EYFP+GL7 and 250 EYFP+GL7+ cells were recovered from the EYFP+ cell subpopulation (0.01% of total splenic B cells). (D) Spleen histology from recipient mouse R2 after adoptive transfer of EYFP+GL7IgM+ cells, stained with IgD (blue), GL7 (white), and huBCL2 (pink) antibodies. huBCL2+ cells in GCs and peri-GCs are shown (arrows). Images are representative of 2 independent experiments with 2 mice per condition. Scale bars: 50 μm (left) and 10 μm (right). (E) Splenic histology from recipient mouse R1 after adoptive transfer of EYFP+GL7+ cells. A single GC invaded with huBCL2+EYFP+ cells was observed among otherwise normal GCs (dashed line outlines), mimicking a human FLIS. Arrows indicate the presence of both GL7+ and GL7 BCL2+EYFP+IgD cells in the same GC. Images are representative of 3 independent experiments with 2 mice per condition (additional figures in Supplemental Figure 3, A and B). Fo, follicular zone. (F) F-PCR of BCL2CJ in the splenic section containing the FLIS structure that was scraped off the slide. Ten PCR replicates of 100 ng DNA each were performed in parallel, cloned, and sequenced. Scale bars: 200 μm (left) and 30 μm (right).
Figure 2
Figure 2. Chronic immunization drives preferential accumulation and reentry of activated BCL2+ B cells in the GC.
(A) Schematic of BMT and chronic immunization assays; hematopoietic stem cells were transduced with an inactive (unrearranged) huBCL2, a small fraction of which (~10–5) will rearrange (and thus express huBCL2) during pro–B cell differentiation. (B) Distribution of the splenic B cell subsets by flow cytometric analysis from unchallenged versus chronically immunized huBCL2-transduced and control animals. Spleens were collected after 6 and 9 months, respectively. Values are shown as the means ± SEM from 3 independent experiments with 2 to 4 mice per group. *P < 0.05 and **P < 0.01 by Student’s t test. (C) Representative flow cytometric profiles of splenocytes and peripheral LNs (inguinal, brachial, and mesenteric) from control (empty vector) and huBCL2-transduced mice with or without chronic immunization. (D) Relative proportion of huBCL2+ cells in the indicated splenic B cell subsets from unchallenged versus chronically immunized huBCL2 -transduced animals. Note that in the absence of immunization, the percentage of EYPF+ cells was less than 1%. (E and F) Frequency of huBCL2+ cells identified by FACS as in C are plotted for the whole cohort of chronically immunized mice. Spleen (left panel) and LNs (right panel). Values from individual mice are shown, summarizing 3 retroviral transduction experiments, with 2 to 4 mice per group, except for WT and Aid-Cre Rosa-EYFP mice (1 mouse/experiment). (G) FACS analysis showing surface IgM expression in BCL2+ GC and post-GC B cells from BCL2-transduced mice.
Figure 1
Figure 1. The sporadic BCL2tracer model.
(A) Germline and rearranged configuration of the BCL2tracer transgene by RAG-mediated inversion. Only the rearranged configuration allows the expression of a full-sized, functional huBCL2 oncoprotein. Recombination signal sequences (DH3-RSS, JH6RSS) are indicated by triangles. V(D)J-mediated coding joints (BCL2CJ) and signal joints are indicated. A representative F-PCR screen from a 3-month-old mouse shows the presence of the transgene in all replicates (3+4, bottom) and a sporadic clonotypic BCL2CJ rearrangement in a few replicates (1+2, top). The frequency of inversion is calculated using Poisson’s assumption based on the number of positive PCRs and input DNA. ex, exon; f, frequency. (B) BCL2CJ frequency evaluated by F-PCR in lymphoid organs and blood from 2- to 12-month-old BCL2tracer mice. Black lines represent the mean. *P < 0.05; **P < 0.01. (C) BCL2CJ follow-up with aging in blood at steady state. (D) BCL2CJ frequency in total spleen and cell-sorted B cell subpopulations from resting (white bars) and challenged mice (light and dark gray bars). Pooled splenocytes (3–5 mice) were used in each condition. NA, absent or too small to sort. (E) IHC of unchallenged or srbc-immunized BCL2tracer mice stained with B220 (pan-B), PNA (GC marker), and huBCL2 antibodies. A human spleen was used as a positive control for huBCL2 staining. PNA was used instead of GL7 (44) because of better staining intensity. Scale bar: 500 μm. (F) Immunization scheme and immunofluorescence (IF) microscopy of BCL2tracer spleen sections stained with IgD (blue), B220 (green), and huBCL2 (red) antibodies. IgD staining indicates GC boundaries. Arrows point to rare huBCL2+ cells. Scale bars: 100 μm (left panel), 20 μm (middle panels).

Comment in

References

    1. MacLennan IC. Germinal centers. Annu Rev Immunol. 1994;12:117–139. doi: 10.1146/annurev.iy.12.040194.001001. - DOI - PubMed
    1. Victora GD, et al. Germinal center dynamics revealed by multiphoton microscopy with a photoactivatable fluorescent reporter. Cell. 2010;143(4):592–605. doi: 10.1016/j.cell.2010.10.032. - DOI - PMC - PubMed
    1. Gitlin AD, Shulman Z, Nussenzweig MC. Clonal selection in the germinal centre by regulated proliferation and hypermutation. Nature. 2014;509(7502):637–640. doi: 10.1038/nature13300. - DOI - PMC - PubMed
    1. Schwickert TA, Alabyev B, Manser T, Nussenzweig MC. Germinal center reutilization by newly activated B cells. J Exp Med. 2009;206(13):2907–2914. doi: 10.1084/jem.20091225. - DOI - PMC - PubMed
    1. Bende RJ, van Maldegem F, Triesscheijn M, Wormhoudt TA, Guijt R, van Noesel CJ. Germinal centers in human lymph nodes contain reactivated memory B cells. J Exp Med. 2007;204(11):2655–2665. doi: 10.1084/jem.20071006. - DOI - PMC - PubMed

Publication types

MeSH terms

Substances