Comparative Study
. 2015 Apr;473(4):1234-46.
doi: 10.1007/s11999-014-4038-3.

What are the radiographic reference values for acetabular under- and overcoverage?

Affiliations
Comparative Study

What are the radiographic reference values for acetabular under- and overcoverage?

Moritz Tannast et al. Clin Orthop Relat Res. 2015 Apr.

Abstract

Background: Both acetabular undercoverage (hip dysplasia) and overcoverage (pincer-type femoroacetabular impingement) can result in hip osteoarthritis. In contrast to undercoverage, there is a lack of information on radiographic reference values for excessive acetabular coverage.

Questions/purposes: (1) How do common radiographic hip parameters differ in hips with a deficient or an excessive acetabulum in relation to a control group; and (2) what are the reference values determined from these data for acetabular under- and overcoverage?

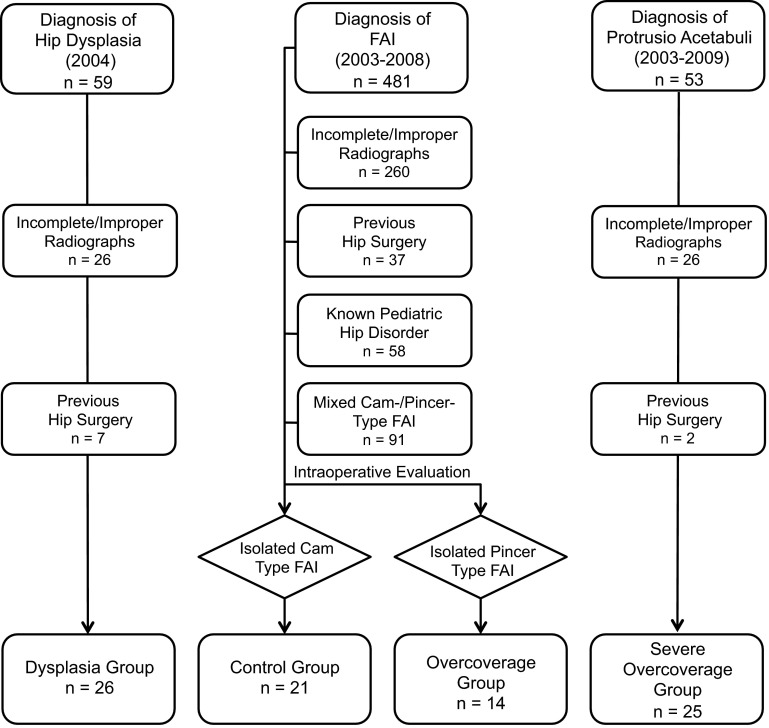
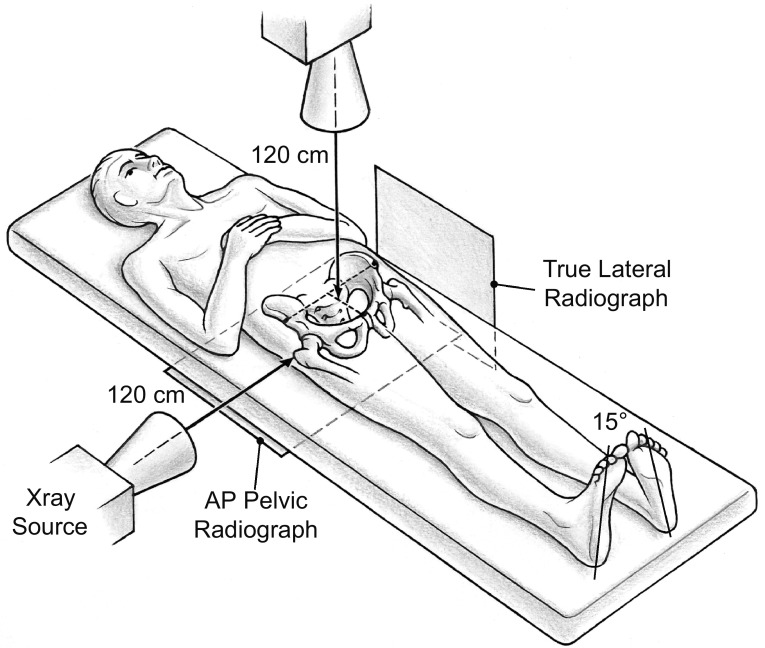
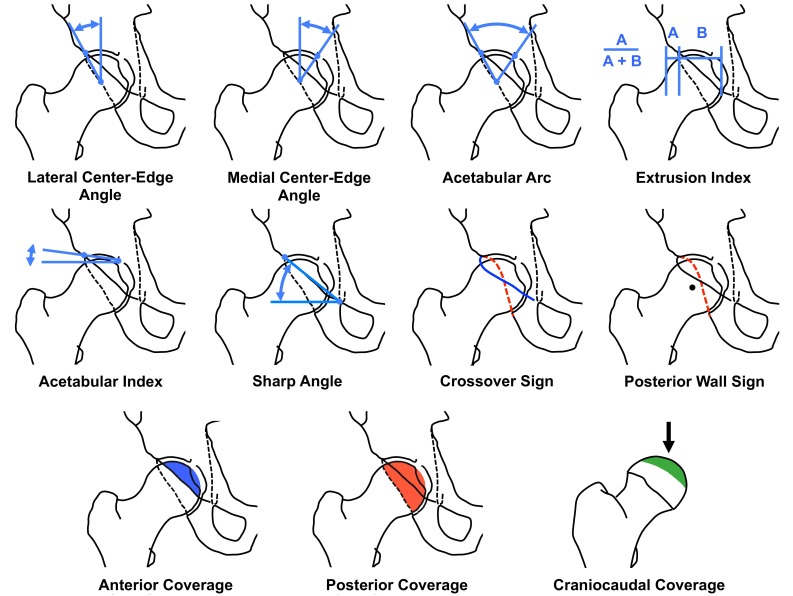
Methods: We retrospectively compared 11 radiographic parameters describing the radiographic acetabular anatomy among hip dysplasia (26 hips undergoing periacetabular osteotomy), control hips (21 hips, requiring no rim trimming during surgical hip dislocation), hips with overcoverage (14 hips, requiring rim trimming during surgical hip dislocation), and hips with severe overcoverage (25 hips, defined as having acetabular protrusio). The hips were selected from a patient cohort of a total of 593 hips. Radiographic parameters were assessed with computerized methods on anteroposterior pelvic radiographs and corrected for neutral pelvic orientation with the help of a true lateral radiograph.

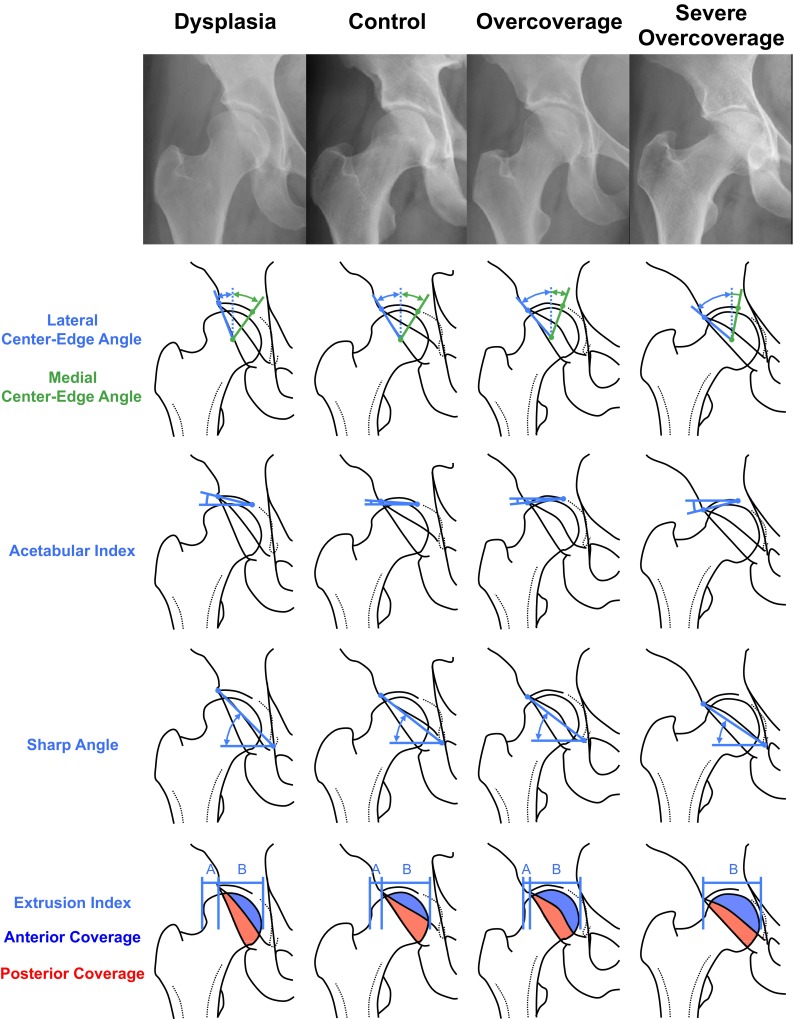
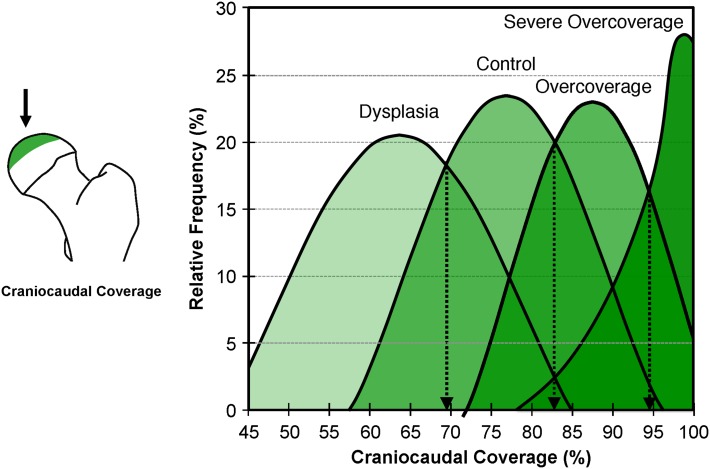
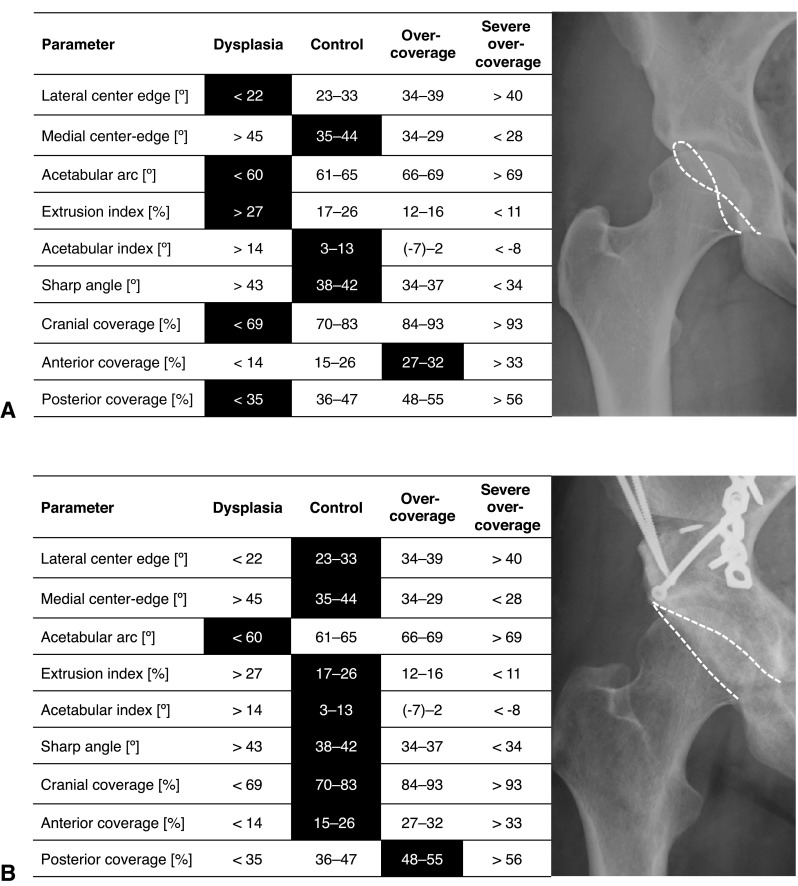
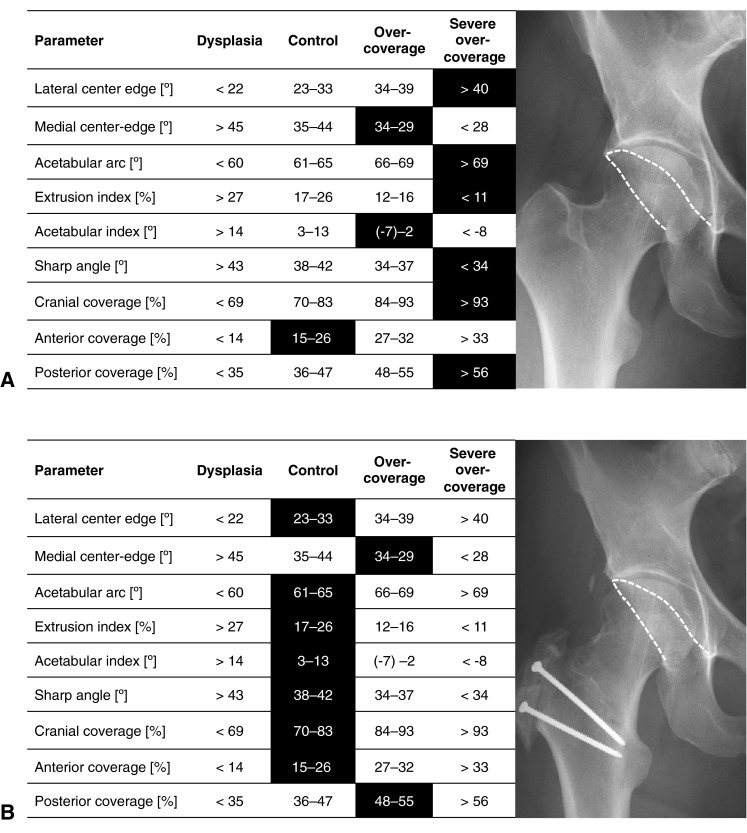
Results: All parameters except the crossover sign differed among the four study groups. From dysplasia through control and overcoverage, the lateral center-edge angle, acetabular arc, and anteroposterior/craniocaudal coverage increased. In contrast, the medial center-edge angle, extrusion/acetabular index, Sharp angle, and prevalence of the posterior wall sign decreased. The following reference values were found: lateral center-edge angle 23° to 33°, medial center-edge angle 35° to 44°, acetabular arc 61° to 65°, extrusion index 17% to 27%, acetabular index 3° to 13°, Sharp angle 38° to 42°, negative crossover sign, positive posterior wall sign, anterior femoral head coverage 15% to 26%, posterior femoral head coverage 36% to 47%, and craniocaudal coverage 70% to 83%.

Conclusions: These acetabular reference values define excessive and deficient coverage. They may be used for radiographic evaluation of symptomatic hips, may offer possible predictors for surgical outcomes, and serve to guide clinical decision-making.


Figures

Fig. 1
Fig. 1
The figure shows how the four different groups were recruited.
Fig. 2
Fig. 2
The figure shows the radiographic setup for the AP and the true lateral pelvic radiographs. Both radiographs are taken consecutively without repositioning of the patient. The film-focus distance is 120 cm for both radiographs. For the AP pelvic radiograph, the center of the x-ray beam is directed to the midpoint of the symphysis and a line connecting the anterosuperior iliac spines. For the true lateral radiograph, the x-ray beam was centered on the tip of the greater trochanter. Reprinted with kind permission from the American Roentgen Ray Society: Tannast M, Siebenrock KA, Anderson SE. Femoroacetabular impingement: radiographic diagnosis—what the radiologist should know. AJR Am J Roentgenol. 2007;188:1540–1552.
Fig. 3
Fig. 3
The definitions of the 11 evaluated radiographic parameters are illustrated using schematic drawings. The craniocaudal view direction is indicated (black arrow).
Fig. 4
Fig. 4
Schematic illustration showing the differences of the radiographic parameters among the four study groups. From dysplasia through control, overcoverage and severe overcoverage, LCE angle, acetabular arc, and AP coverage increased. In contrast, medial center-edge angle, acetabular/extrusion indices, and the Sharp angle decreased from dysplasia to severe overcoverage.
Fig. 5
Fig. 5
The distribution curves for craniocaudal coverage of the four study groups are shown as an example for definition of the range of values for each group. The intersection of the distribution curves resulted in the definition thresholds for each parameter (Table 4). Image to the left indicates craniocaudal coverage and craniocaudal view direction (black arrow).
Fig. 6A–B
Fig. 6A–B
This figure shows a potential application of the established reference values in clinical practice. (A) The case of a 24-year-old female patient with groin pain is shown. The results of the analysis with Hip2Norm (indicated by darkened boxes) show that most of the parameters are indicative for a deficient acetabulum (dysplasia) except the anterior coverage, which is excessive. A dysplastic hip with acetabular retroversion was diagnosed. (B) The patient underwent anteverting PAO, which could normalize almost all parameters.
Fig. 7A–B
Fig. 7A–B
This figure shows a second potential application of the determined reference values for the acetabulum. (A) The AP pelvic radiograph of a 32-year-old male patient is shown. The analysis with Hip2Norm reveals excessive values of all parameters (indicated by darkened boxes) except for the anterior coverage, which was normal. Acetabular overcoverage with a too prominent posterior acetabular rim was diagnosed. (B) The patient underwent surgical hip dislocation with trimming of the posterior and superior acetabular rim. The anterior rim was not addressed surgically. This led to normalization of most of the parameters.

Similar articles

Cited by

References

    1. Albers CE, Steppacher SD, Ganz R, Tannast M, Siebenrock KA. Impingement adversely affects 10-year survivorship after periacetabular osteotomy for DDH. Clin Orthop Relat Res. 2013;471:1602–1614. doi: 10.1007/s11999-013-2799-8. - DOI - PMC - PubMed
    1. Anda S, Svenningsen S, Dale LG, Benum P. The acetabular sector angle of the adult hip determined by computed tomography. Acta Radiol Diagn (Stockh). 1986;27:443–447. - PubMed
    1. Anda S, Terjesen T, Kvistad KA, Svenningsen S. Acetabular angles and femoral anteversion in dysplastic hips in adults: CT investigation. J Comput Assist Tomogr. 1991;15:115–120. doi: 10.1097/00004728-199101000-00018. - DOI - PubMed
    1. Chegini S, Beck M, Ferguson SJ. The effects of impingement and dysplasia on stress distributions in the hip joint during sitting and walking: a finite element analysis. J Orthop Res. 2009;27:195–201. doi: 10.1002/jor.20747. - DOI - PubMed
    1. Dandachli W, Islam SU, Liu M, Richards R, Hall-Craggs M, Witt J. Three-dimensional CT analysis to determine acetabular retroversion and the implications for the management of femoro-acetabular impingement. J Bone Joint Surg Br. 2009;91:1031–1036. doi: 10.1302/0301-620X.91B8.22389. - DOI - PubMed

Publication types