

Contributions of white and brown adipose tissues and skeletal muscles to acute cold-induced metabolic responses in healthy men
- PMID: 25384777
- PMCID: PMC4324714
- DOI: 10.1113/jphysiol.2014.283598
Contributions of white and brown adipose tissues and skeletal muscles to acute cold-induced metabolic responses in healthy men
Abstract
Key points: Both brown adipose tissue (BAT) and skeletal muscle activation contribute to the metabolic response of acute cold exposure in healthy men even under minimal shivering. Activation of adipose tissue intracellular lipolysis is associated with BAT metabolic response upon acute cold exposure in healthy men. Although BAT glucose uptake per volume of tissue is important, the bulk of glucose turnover during cold exposure is mediated by skeletal muscle metabolic activation even when shivering is minimized.
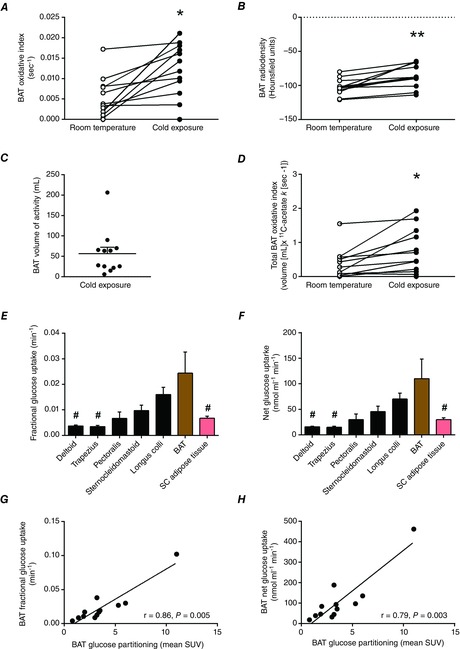
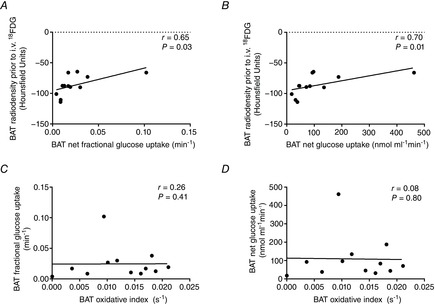
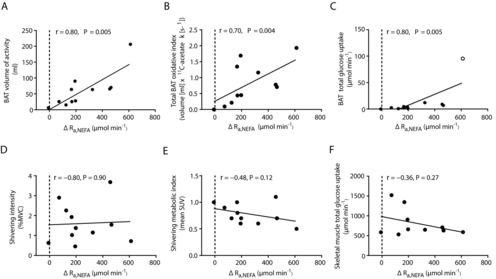
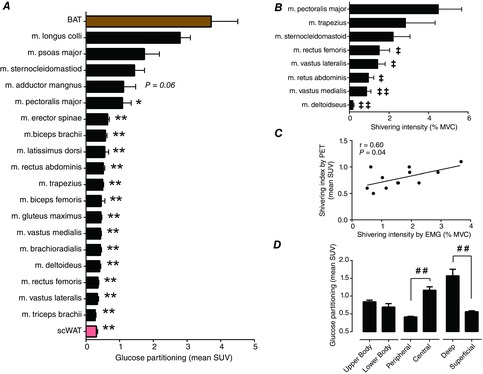
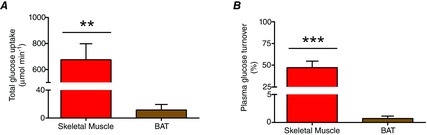
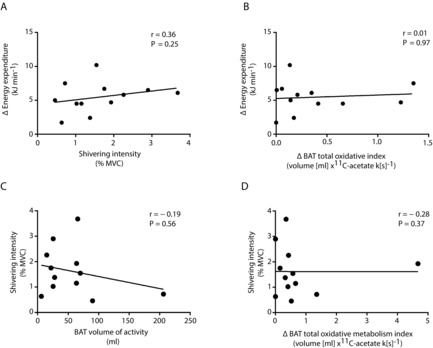
Abstract: Cold exposure stimulates the sympathetic nervous system (SNS), triggering the activation of cold-defence responses and mobilizing substrates to fuel the thermogenic processes. Although these processes have been investigated independently, the physiological interaction and coordinated contribution of the tissues involved in producing heat or mobilizing substrates has never been investigated in humans. Using [U-(13)C]-palmitate and [3-(3)H]-glucose tracer methodologies coupled with positron emission tomography using (11)C-acetate and (18)F-fluorodeoxyglucose, we examined the relationship between whole body sympathetically induced white adipose tissue (WAT) lipolysis and brown adipose tissue (BAT) metabolism and mapped the skeletal muscle shivering and metabolic activation pattern during a mild, acute cold exposure designed to minimize shivering response in 12 lean healthy men. Cold-induced increase in whole-body oxygen consumption was not independently associated with BAT volume of activity, BAT oxidative metabolism, or muscle metabolism or shivering intensity, but depended on the sum of responses of these two metabolic tissues. Cold-induced increase in non-esterified fatty acid (NEFA) appearance rate was strongly associated with the volume of metabolically active BAT (r = 0.80, P = 0.005), total BAT oxidative metabolism (r = 0.70, P = 0.004) and BAT glucose uptake (r = 0.80, P = 0.005), but not muscle glucose metabolism. The total glucose uptake was more than one order of magnitude greater in skeletal muscles compared to BAT during cold exposure (674 ± 124 vs. 12 ± 8 μmol min(-1), respectively, P < 0.001). Glucose uptake demonstrated that deeper, centrally located muscles of the neck, back and inner thigh were the greatest contributors of muscle glucose uptake during cold exposure due to their more important shivering response. In summary, these results demonstrate for the first time that the increase in plasma NEFA appearance from WAT lipolysis is closely associated with BAT metabolic activation upon acute cold exposure in healthy men. In humans, muscle glucose utilization during shivering contributes to a much greater extent than BAT to systemic glucose utilization during acute cold exposure.
© 2014 The Authors. The Journal of Physiology © 2014 The Physiological Society.
Figures
Comment in
-
Brown adipose tissue--not as hot as we thought.J Physiol. 2015 Feb 1;593(3):489. doi: 10.1113/jphysiol.2014.287979. J Physiol. 2015. PMID: 25774394 Free PMC article. No abstract available.
References
-
- Bartelt A, Bruns OT, Reimer R, Hohenberg H, Ittrich H, Peldschus K, Kaul MG, Tromsdorf UI, Weller H, Waurisch C, Eychmuller A, Gordts PL, Rinninger F, Bruegelmann K, Freund B, Nielsen P, Merkel M. Heeren J. Brown adipose tissue activity controls triglyceride clearance. Nat Med. 2011;17:200–205. - PubMed
-
- Bell DG, Tikuisis P. Jacobs I. Relative intensity of muscular contraction during shivering. J Appl Physiol. 1992;72:2336–2342. - PubMed
-
- Brito NA, Brito MN. Bartness TJ. Differential sympathetic drive to adipose tissues after food deprivation, cold exposure or glucoprivation. Am J Physiol Regul Integr Comp Physiol. 2008;294:R1445–1452. - PubMed
-
- Buck A, Wolpers HG, Hutchins GD, Savas V, Mangner TJ, Nguyen N. Schwaiger M. Effect of carbon-11-acetate recirculation on estimates of myocardial oxygen consumption by PET. J Nucl Med. 1991;32:1950–1957. - PubMed
Publication types
MeSH terms
Substances
Grants and funding
LinkOut - more resources
Full Text Sources
Other Literature Sources
Miscellaneous