. 2015 Jan;35(2):479-95.
doi: 10.1128/MCB.01204-14. Epub 2014 Nov 10.

Human monocyte recognition of adenosine-based cyclic dinucleotides unveils the A2a Gαs protein-coupled receptor tonic inhibition of mitochondrially induced cell death

Affiliations

Human monocyte recognition of adenosine-based cyclic dinucleotides unveils the A2a Gαs protein-coupled receptor tonic inhibition of mitochondrially induced cell death

Marie Tosolini et al. Mol Cell Biol. 2015 Jan.

Abstract

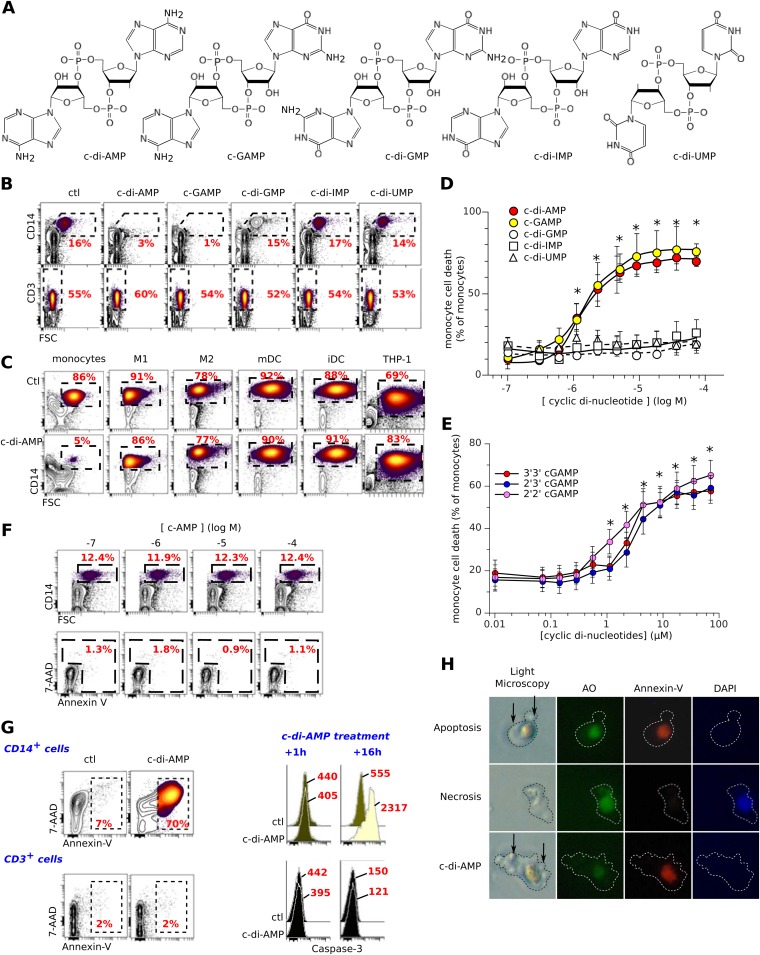
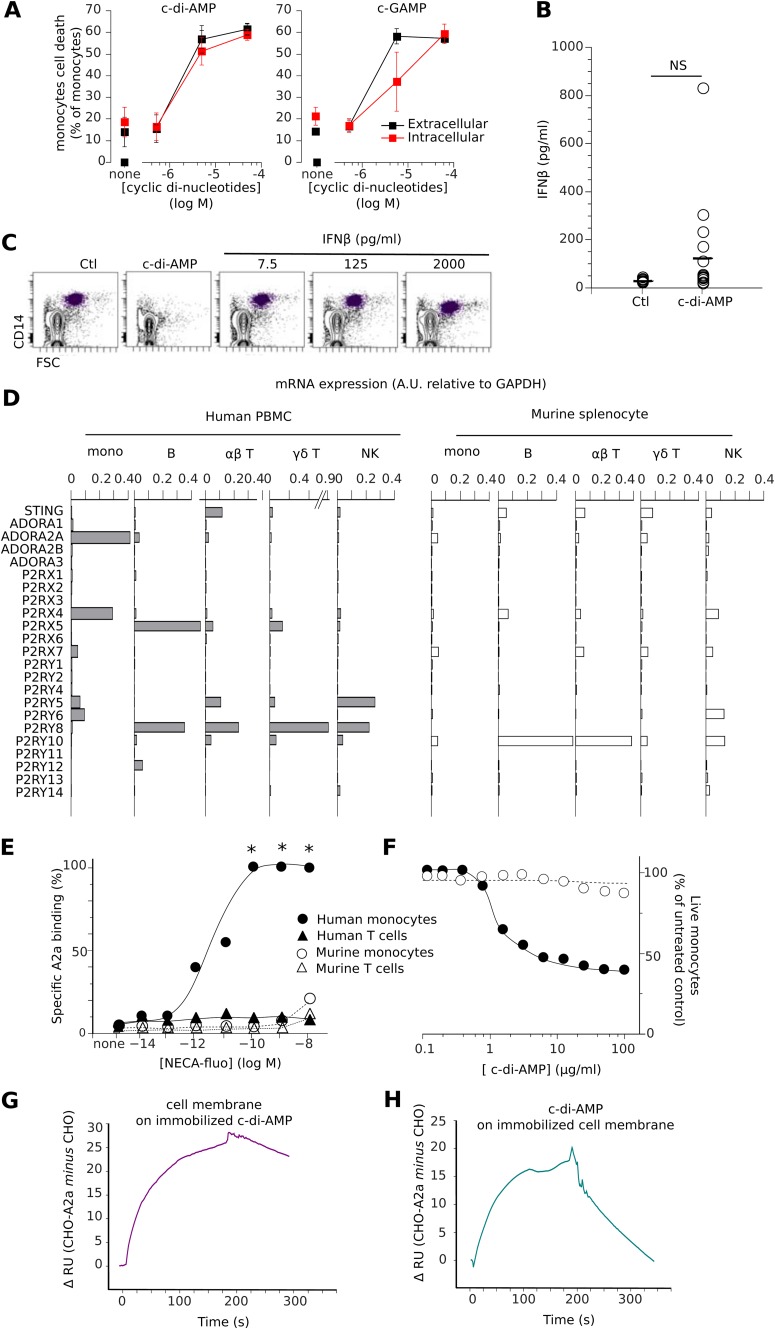
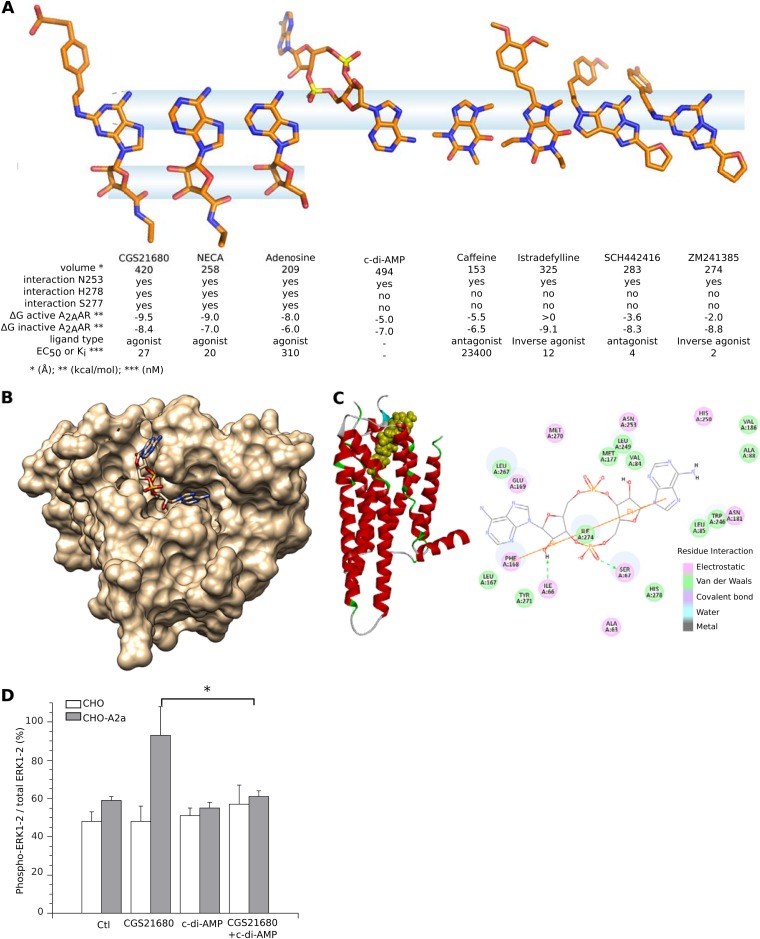
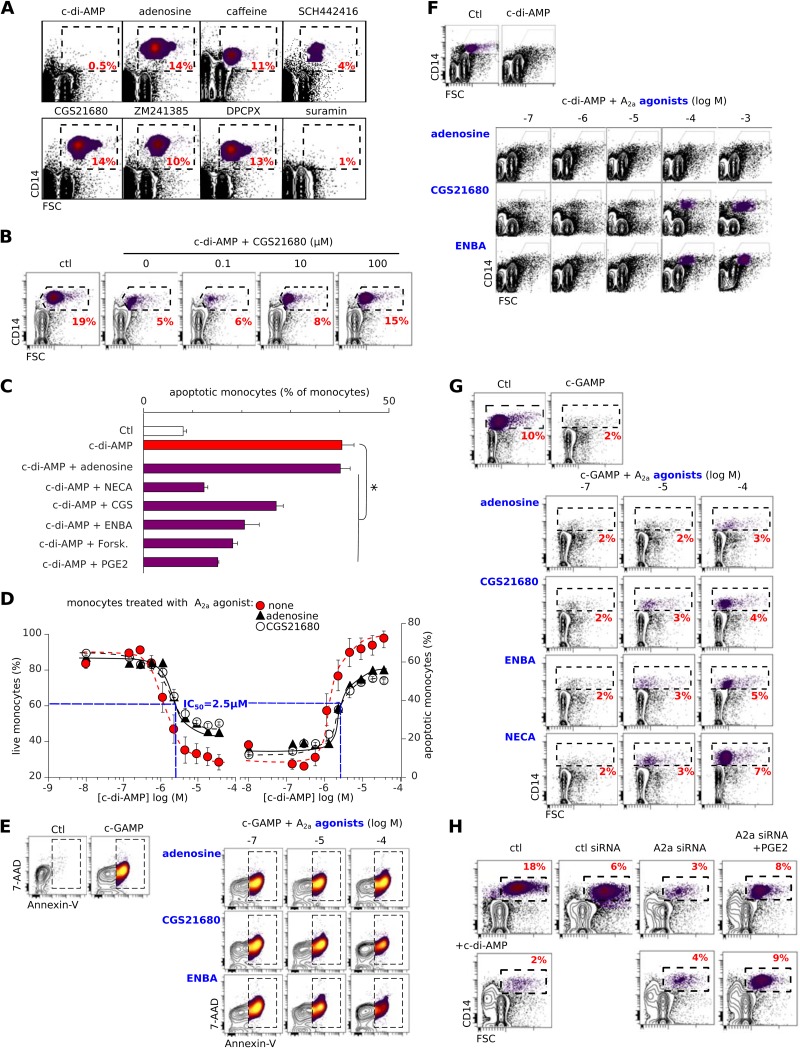
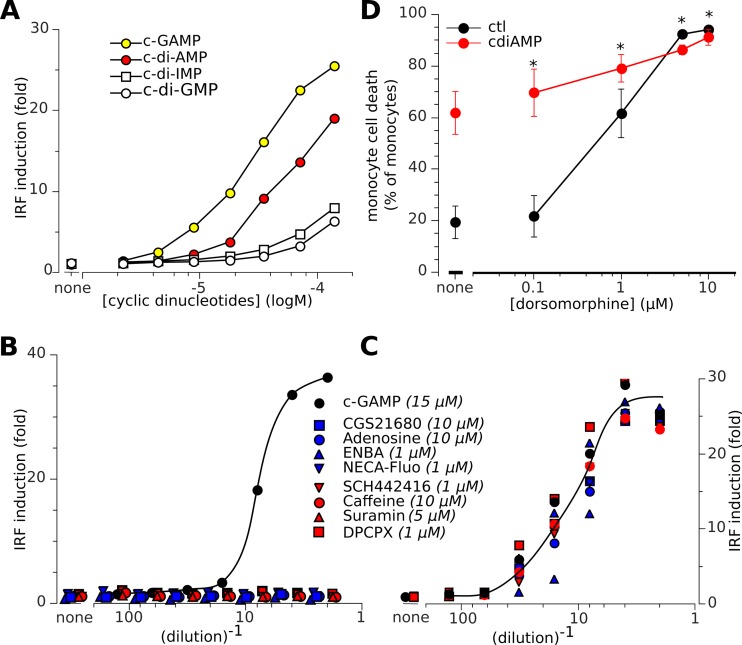
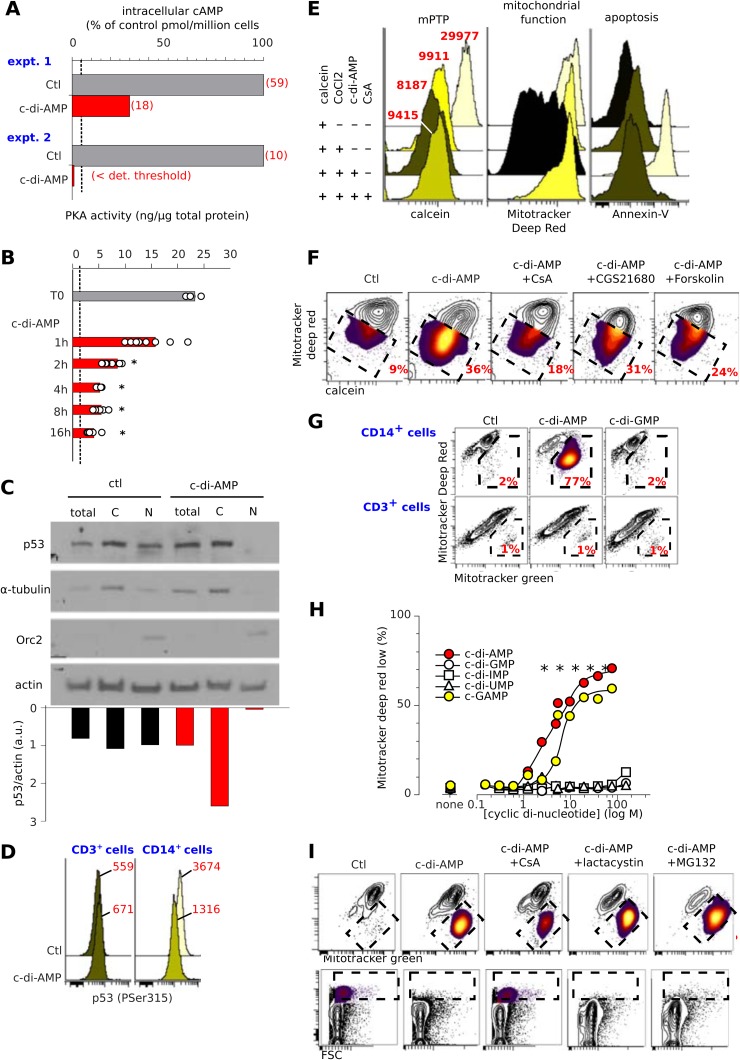
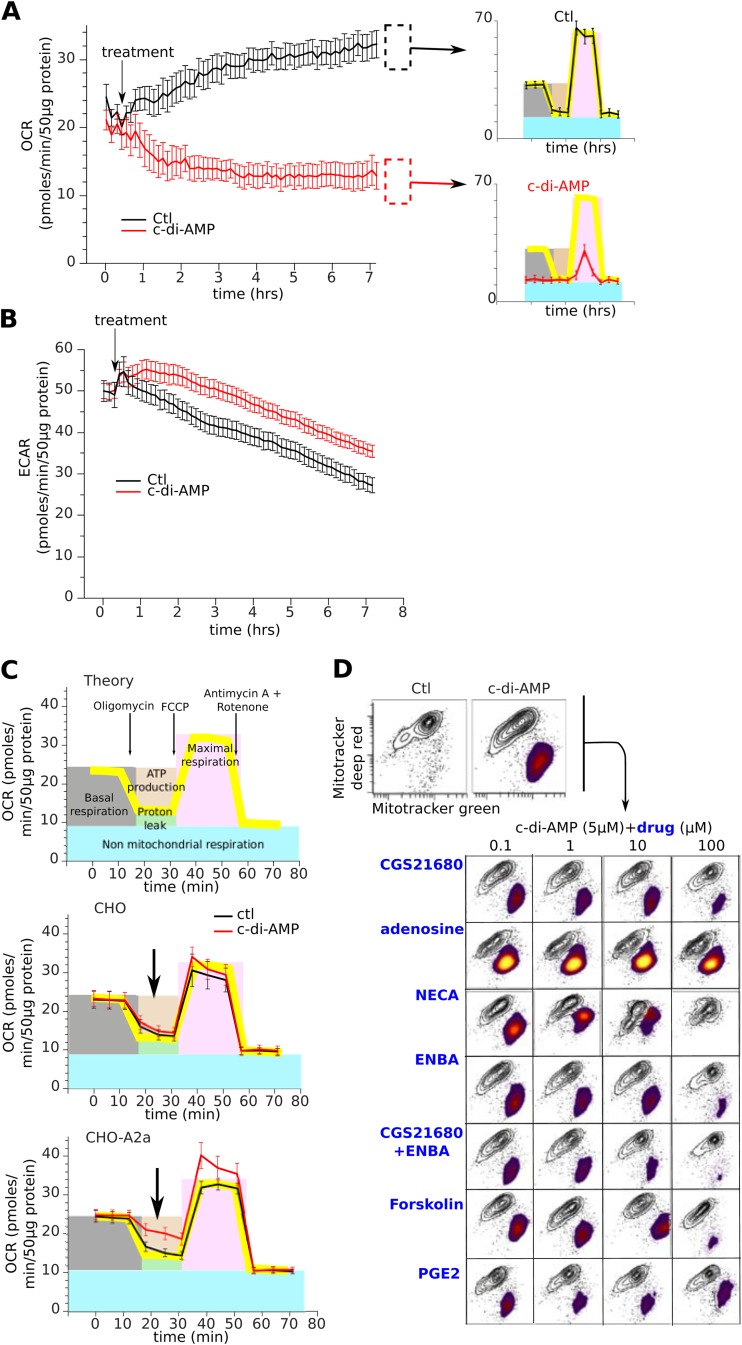
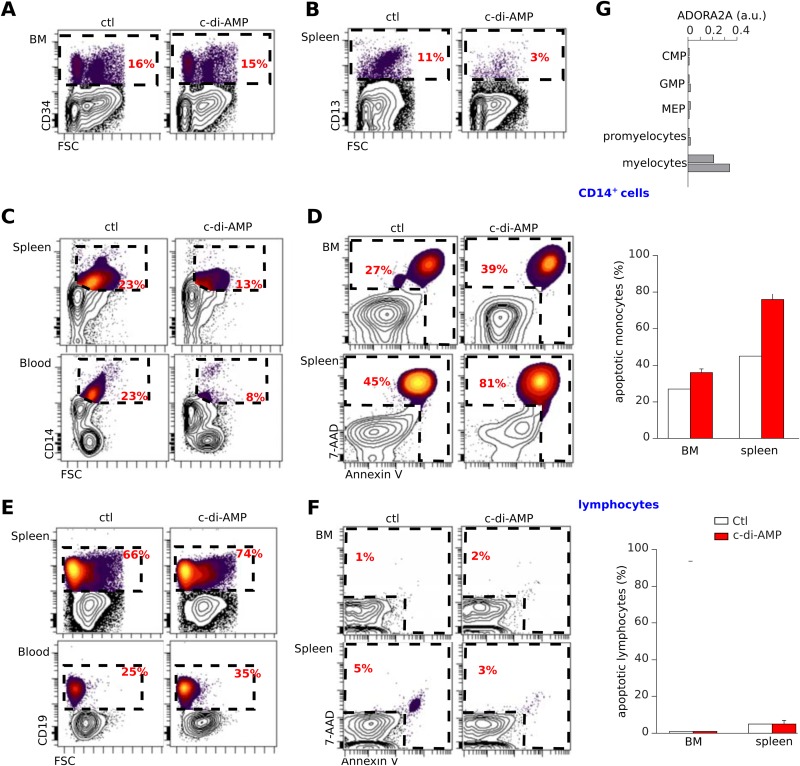
Cyclic dinucleotides are important messengers for bacteria and protozoa and are well-characterized immunity alarmins for infected mammalian cells through intracellular binding to STING receptors. We sought to investigate their unknown extracellular effects by adding cyclic dinucleotides to the culture medium of freshly isolated human blood cells in vitro. Here we report that adenosine-containing cyclic dinucleotides induce the selective apoptosis of monocytes through a novel apoptotic pathway. We demonstrate that these compounds are inverse agonist ligands of A2a, a Gαs-coupled adenosine receptor selectively expressed by monocytes. Inhibition of monocyte A2a by these ligands induces apoptosis through a mechanism independent of that of the STING receptors. The blockade of basal (adenosine-free) signaling from A2a inhibits protein kinase A (PKA) activity, thereby recruiting cytosolic p53, which opens the mitochondrial permeability transition pore and impairs mitochondrial respiration, resulting in apoptosis. A2a antagonists and inverse agonist ligands induce apoptosis of human monocytes, while A2a agonists are antiapoptotic. In vivo, we used a mock developing human hematopoietic system through NSG mice transplanted with human CD34(+) cells. Treatment with cyclic di-AMP selectively depleted A2a-expressing monocytes and their precursors via apoptosis. Thus, monocyte recognition of cyclic dinucleotides unravels a novel proapoptotic pathway: the A2a Gαs protein-coupled receptor (GPCR)-driven tonic inhibitory signaling of mitochondrion-induced cell death.


Figures

FIG 1
FIG 1
Adenosine-based 3′,5′-cyclic dinucleotides induce the selective apoptosis of human monocytes. (A) Structure of the cyclic dinucleotides. (B) Freshly isolated PBMCs were cultured for 16 h in complete medium with the 3′,5′ cyclic dinucleotides (5 μM) and then stained for CD14 or CD3. ctl, control. (C) Same as for panel B but using monocytes, M1 and M2 macrophages, mature and immature dendritic cells (mDC and iDC, respectively) and the THP1 monocytic cancer cell line. (D) Titration of 3′,5′ cyclic dinucleotide bioactivity on CD14+ monocyte death. Means and SD from 14 independent experiments are shown. *, P < 0.05 (Student t test) versus untreated control. (E) Titration of 3′,3′, 2′,3′, and 2′,2′ cGAMP bioactivity on CD14+ monocyte death. Shown are means and SD from six independent experiments. *, P < 0.05 (paired Student t test) versus control. (F) Same as for panel D but using freshly isolated monocytes incubated with cAMP. (G) PBMCs were cultured for 16 h with c-di-AMP (5 μM) and then stained for CD14, CD3, and caspase 3 and labeled with 7-AAD and annexin V prior to flow cytometry analysis of either CD14+ (monocytes) or CD3+ (T lymphocytes) cells. Mean values of caspase 3 fluorescence intensity are indicated. (H) Representative images of monocytes stained with acridine orange (AO), annexin V, and DAPI while dying of apoptosis (anti-FAS treatment for 7 h), necrosis (7 h in 10% ethanol), or c-di-AMP (0.6 μM for 7 h). Arrows indicate membrane blebbing and apoptotic bodies. These data indicate that c-di-AMP induces the selective apoptosis of monocytes.
Fig 2
Fig 2
Human monocytes selectively expressing the Adora2a gene and A2a adenosine receptor are c-di-AMP sensitive. (A) Freshly isolated PBMCs were cultured for 16 h in complete medium with increased doses of adenosine-based cyclic dinucleotides in the medium (extracellular) or using a transfection method (intracellular [red]). (B) Release of IFN-β from sorted human monocytes in culture with and without c-di-AMP (5 μM). (C) Monocytes were not depleted from PBMC cultures in complete medium supplemented with IFN-β. (D) Relative levels of STING mRNA expression and purinergic receptor-encoding genes (Affymetrix Human Genome U133 Plus 2.0 and Affymetrix Mouse Genome 430 2.0 microarrays) in the specified human and murine cell subsets. Means of values normalized to GAPDH are shown. (E) Specific binding of NECA-fluo to the specified human or murine cell subsets. Means shown are percent specific binding from nine independent measures of mean NECA-fluo signal intensity, with 0% binding obtained in cells without tracker and 100% binding obtained in cells with maximal fluorescence (e.g., [NECA-fluo] >10−6 M). *, P < 0.05 (Student paired t test) versus controls. (F) Incubation of c-di-AMP with human or murine monocytes from PBMCs or splenocytes, respectively (n = 4 for murine cells and n = 14 for human cells). (G) Differential (CHO-A2a versus CHO) binding of solubilized purified cell membranes expressing A2a over immobilized c-di-AMP surface. (H) Differential (CHO-A2a versus CHO) binding of soluble c-di-AMP (100 μM) over surfaces coated with purified cell membranes expressing or not the A2a receptor.
FIG 3
FIG 3
3′,5′ cyclic di-AMP is an antagonist/inverse agonist ligand of the human A2a adenosine receptor. (A) Structural comparison of c-di-AMP to known A2a ligands. The crystallized conformations of A2a-bound agonists, inverse agonists, and antagonists were aligned using their respective Asn253-binding atoms as a reference. The information summarizes the distinct A2a-binding patterns of agonists and antagonists and suggests that the A2a-binding conformation of c-di-AMP, predicted by molecular docking to bind to the inactive receptor (PDB code 3PWH), corresponds to an antagonist ligand. (B) Top-view model of c-di-AMP docked in the inactive A2a adenosine receptor (PDB code 3PWH). (C) Predicted interactions between c-di-AMP and A2a receptor. The corresponding tridimensional structure of the c-di-AMP/A2a complex is shown on the left, with inactive A2a conformation represented by red ribbons and c-di-AMP by spheres. The A2a residues interacting with c-di-AMP are indicated, color-coded by type of interaction. In this model, the A2a (N253) residue has electrostatic interaction with adenine, but neither A2a (S277) nor A2a (H278) interacts with the corresponding ribose 2′ OH. As illustrated in panel A, this pattern corresponds to A2a antagonists/inverse agonists. (D) Phosphorylation of ERK1/2 in CHO-A2a cells induced by A2a agonist CGS21680 (100 nM) is inhibited by c-di-AMP (10 μM). *, P < 0.05 (Student paired t test) for CHO-A2a cells treated with CGS21680 versus CHO-A2a cells treated with CGS21680 plus c-di-AMP.
FIG 4
FIG 4
Ligands of A2a regulate monocyte apoptosis induced by c-di-AMP and cGAMP. (A) c-di-AMP (5 μM) but not the A2a agonists adenosine and CGS21680 (100 μM) deplete monocytes. The A2a antagonists/inverse agonists caffeine, SCH244416, and ZM241385 (100 μM) or the A2a decoupler suramin (100 μM) also depletes monocytes, but less efficiently. The percentages of monocytes are indicated in the dashed boxes. (B and C) Monocytes were rescued from c-di-AMP-induced cell death in the same assay as for panel A, either by the A2a agonist CGS21680 (B) or by other c-AMP-raising drugs (100 μM) (C). Data are means ± SD from more than five independent experiments. *, P < 0.05 (paired Student t test) versus monocytes treated with c-di-AMP. (D) Monocyte death or survival as a measurement of the competition for A2a by agonists and c-di-AMP. Shown are the percentages of live (left) or apoptotic (annexin V+) (right) monocytes among PBMCs that had been incubated for 16 h in complete medium with either of the A2a agonists adenosine (310 nM) and CGS21680 (30 nM) and the indicated concentrations of c-di-AMP. Means and SD from six independent experiments are shown. (E) Monocyte (FSChigh CD14+ cells, boxed) death/survival after 24 h of in vitro PBMC culture with c-GAMP (5 μM) and the specified concentrations of A2a agonists. Representative results from six independent experiments are shown. (F and G) Monocytes (FSChigh CD14+ cells, boxed) after 16 h of in vitro PBMC culture with c-di-AMP (F) or cGAMP (G) (5 μM) and the specified concentrations of A2a agonists. The monocyte depletion by c-di-AMP or cGAMP was avoided by the highest concentrations of CGS21680 and ENBA agonists, while 1 mM adenosine weakly protected the monocytes. Representative results from six independent experiments are shown. (H) Freshly isolated PBMCs were transfected with control or A2a siRNA with or without c-di-AMP (5 μM) and stained for CD14. Representative results from three independent experiments are shown.
FIG 5
FIG 5
Independence of the human A2a and STING pathways. (A to C) The THP1-Blue-hSEAP human monocyte line was used for monitoring of the human STING/IRF3 pathway. When their STING pathway is activated, THP1-Blue-hSEAP cells induce IRF3 and thus express a secreted embryonic alkaline phosphatase reporter gene under the control of an ISG54 promoter in conjunction with five IFN-stimulated response elements. Hence, STING activation is measured by the OD (655 nm) of the chromogenic product of SEAP activity and expressed as fold change normalized to baseline levels in resting cells. (A) When THP1-Blue-hSEAP cells are exposed to various extracellular cyclic dinucleotides, their human STING pathway is activated. In contrast to the A2a pathway (Fig. 1D), c-di-AMP is less potent than cGAMP for activation of the human STING/IRF3 pathway. (B) Alone, agonist and antagonist ligands of the A2a receptor, or suramin (stock concentrations specified in italics), do not activate the STING pathway downstream from the A2a pathway. (C) Modulation of the A2a receptor pathway by A2a agonists and antagonists or by suramin does not affect simultaneous activation of the STING pathway by cGAMP (15 μM). (D) Monocytes are treated with increased doses of dorsomorphin with (red) and without (black) c-di-AMP (5 μM). Data are means ± SD from more than five independent experiments. *, P < 0.05 (paired Student t test).
Fig 6
Fig 6
The A2a inverse agonist c-di-AMP induces mPTP-dependent cell death. (A to D) Extracellular c-di-AMP affects intracellular cAMP, PKA, and p53. Treatment of purified human monocytes (107 cells per assay) with c-di-AMP (5 μM) reduces cytosolic cAMP (italics: pmol/million monocytes) (A) and inhibits PKA activity (ng of activity per μg of total cytosolic protein) (B). Bars show means from eight independent experiments; dots show individual data. *, P < 0.05 (paired Student t test) versus untreated cells. (C) c-di-AMP induces p53 relocalization. (Top) Western blots of p53 from c-di-AMP-treated and control monocytes in whole-cell (total), nuclear (N), and cytosolic (C) extracts. The purity of these fractions was checked by labeling for Orc2 (nuclear fraction) and α-tubulin (cytoplasm). (Bottom) p53 densitometric quantification relative to actin. (D) Flow cytometry of cells labeled for intracellular phospho-Ser315 of p53 shows a reduction in nuclear p53 in c-di-AMP-treated monocytes (MFIs are in red), while staining with isotype control was unaffected under the same conditions (MFI = 95 [data not shown]). (E) Flow cytometry assay for the mPTP. Shown are histograms of calcein, Mitotracker deep red, and annexin V fluorescence of gated monocytes tested in the specified settings. CsA, cyclosporine. MFIs are indicated in red. Representative results from more than three independent experiments are shown. Cells were loaded with the cell-permeant calcein AM (upper track). Upon addition of the calcein fluorescence quencher CoCl2, the fluorescence of cytoplasmic calcein is lost, while that of mitochondria is retained. Upon c-di-AMP treatment, however, opening of the mPTP allows quenching of mitochondrial calcein fluorescence, but CsA protects this quenching by inhibiting the mPTP. (F) c-di-AMP induces opening of the mPTP. Contour plots of flow cytometry mPTP assays in monocytes gated from PBMCs treated as specified with c-di AMP (5 μM), CsA (100 μM), CGS21680 (100 μM), or forskolin (100 μM) are shown. Decreased calcein fluorescence indicates the mPTP, and a decreased Mitotracker deep red signal indicates dysfunctional mitochondria; dashed boxes show cells with the mPTP and the percentages. Representative results from four independent experiments are shown. (G) Representative results of contour plots showing that c-di-AMP but not c-di-GMP induces mitochondrial dysfunction (Mitotracker deep red fluorescence) but not total mitochondria (Mitotracker green fluorescence) from monocytes but not lymphocytes in the same experiments. Dashed boxes show cells with mitochondrial dysfunction and their percentages. (H) Titration of the cyclic dinucleotide bioactivity on reduction of the mitochondrial function in monocytes. Shown are means from eight independent experiments. *, P < 0.05 (paired Student t test) versus control. (I) c-di-AMP-induced mPTP opening reduces mitochondrial function (Mitotracker deep red fluorescence) but not total mitochondria (Mitotracker green fluorescence) (top row) and depletes monocytes from PBMCs (bottom row). Cells were treated with CsA (100 μM), lactacystin (10 μM), and MG132 (10 μM) as specified.
FIG 7
FIG 7
c-di-AMP induces formation of the mPTP and defective mitochondrial function. (A and B) The bioenergetic profiles of purified human monocytes treated with c-di-AMP (5 M) were determined using the extracellular flux analyzer. The rates of oxygen consumption (OCR, an indicator of mitochondrial respiration) (A) and extracellular acidification (ECAR, an indicator of glycolysis) (B) were followed for 6 h after treatment. OCR was followed by sequential injection of oligomycin (1 μM), carbonyl cyanide-4-(trifluoromethoxy)phenylhydrazone (FCCP) (1 μM), and antimycin A plus rotenone (1 μM) to determine the indices of mitochondrial function (top right). Data are means ± SD from representative donor profiles; six assay replicates were carried out per sample. (C) Same as for panel A but using CHO or CHO-A2a cells. Data are means ± SD from representative assay profiles; six assay replicates were carried out per sample. (D) Mitochondrial dysfunction induced by A2a antagonism can be rescued by A2a agonists or other cAMP-elevating drugs.
FIG 8
FIG 8
c-di-AMP induces apoptosis of human monocytes and myeloid precursors developing in NSG mice reconstituted with human CD34+ cells. (A to G) Newborn NSG mice engrafted with human cord blood CD34+ cells showing >30% human CD45+ cells in the blood after 10 weeks of reconstitution were injected with 2 cycles of c-di-AMP (50 μg) or PBS (100 μl). Forty-eight hours after injection, the hematopoietic tissues of these mice were stained and compared. (A) Bone marrow (BM) CD34+ progenitor cells were not affected by c-di-AMP, whereas the numbers of CD13+ myelocytes and splenocytes were reduced in these mice (B). The number of human CD14+ monocytes was reduced in blood, spleen, and marrow of c-di-AMP-treated mice (C) as they were undergoing apoptosis (D). (E and F) Human B cell development was unaffected by c-di-AMP. Representative rates and apoptotic phenotypes of B cells from the same animals as shown in panels C and D are shown. The right images show composites of results (mean and SEM; n = 7). (G) Relative levels of mRNA expression of Adora2a gene (Affymetrix Human Genome U133 Plus 2.0 microarray) in human common myeloid precursor (CMP) CD34+ cells, granulocyte/macrophage progenitor (GMP) CD34+ cells, megakaryocyte/erythrocyte progenitor (MEP) CD34+ cells, promyelocytes, and CD13+ myelocytes. Data were extracted from the GEO data set under accession number GSE19599 (10) and normalized to GAPDH as for Fig. 2D.

References

    1. Pesavento C, Hengge R. 2009. Bacterial nucleotide-based second messengers. Curr Opin Microbiol 12:170–176. doi:10.1016/j.mib.2009.01.007. - DOI - PubMed
    1. Chen Z-H, Schaap P. 2012. The prokaryote messenger c-di-GMP triggers stalk cell differentiation in Dictyostelium. Nature 488:680–683. doi:10.1038/nature11313. - DOI - PMC - PubMed
    1. Gao D, Wu J, Wu Y-T, Du F, Aroh C, Yan N, Sun L, Chen ZJ. 2013. Cyclic GMP-AMP synthase is an innate immune sensor of HIV and other retroviruses. Science 341:903–906. doi:10.1126/science.1240933. - DOI - PMC - PubMed
    1. Wu J, Sun L, Chen X, Du F, Shi H, Chen C, Chen ZJ. 2013. Cyclic GMP-AMP is an endogenous second messenger in innate immune signaling by cytosolic DNA. Science 339:826–830. doi:10.1126/science.1229963. - DOI - PMC - PubMed
    1. Sun L, Wu J, Du F, Chen X, Chen ZJ. 2013. Cyclic GMP-AMP synthase is a cytosolic DNA sensor that activates the type I interferon pathway. Science 339:786–791. doi:10.1126/science.1232458. - DOI - PMC - PubMed

Publication types