Comparative Study
. 2015 Nov;64(11):1721-31.
doi: 10.1136/gutjnl-2014-308252. Epub 2014 Nov 10.

Signatures of tumour immunity distinguish Asian and non-Asian gastric adenocarcinomas

Affiliations
Comparative Study

Signatures of tumour immunity distinguish Asian and non-Asian gastric adenocarcinomas

Suling J Lin et al. Gut. 2015 Nov.

Abstract

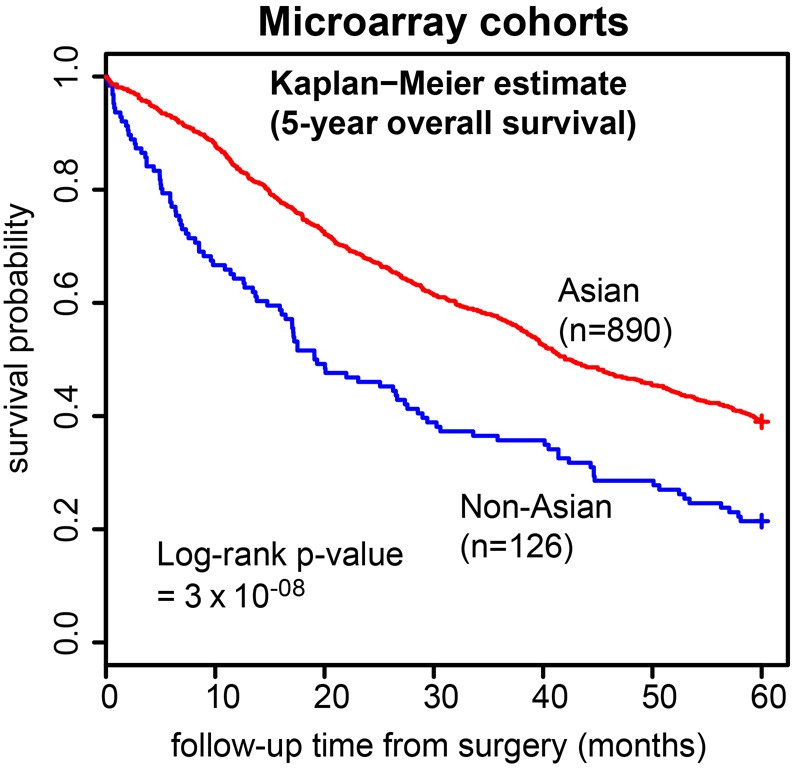
Objective: Differences in gastric cancer (GC) clinical outcomes between patients in Asian and non-Asian countries has been historically attributed to variability in clinical management. However, recent international Phase III trials suggest that even with standardised treatments, GC outcomes differ by geography. Here, we investigated gene expression differences between Asian and non-Asian GCs, and if these molecular differences might influence clinical outcome.

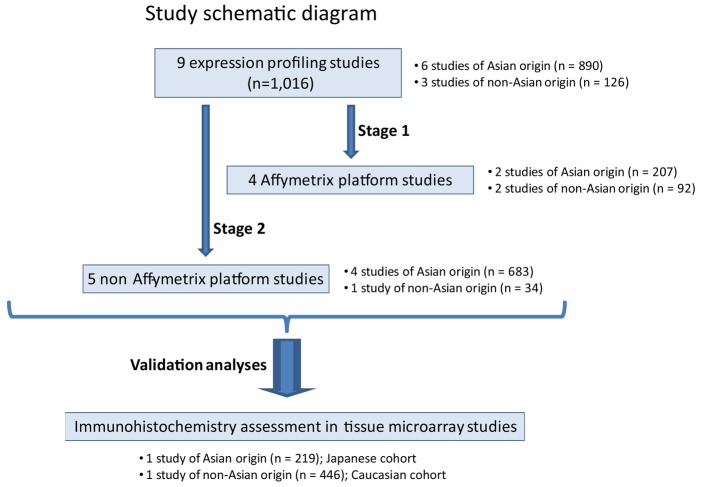
Design: We compared gene expression profiles of 1016 GCs from six Asian and three non-Asian GC cohorts, using a two-stage meta-analysis design and a novel biostatistical method (RUV-4) to adjust for technical variation between cohorts. We further validated our findings by computerised immunohistochemical analysis on two independent tissue microarray (TMA) cohorts from Asian and non-Asian localities (n=665).

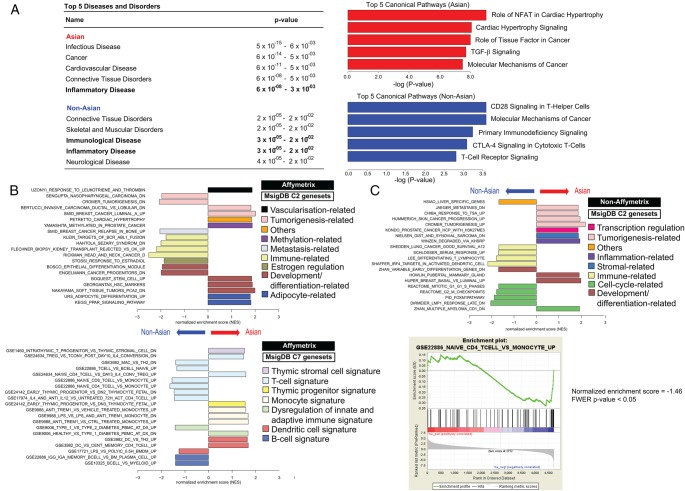
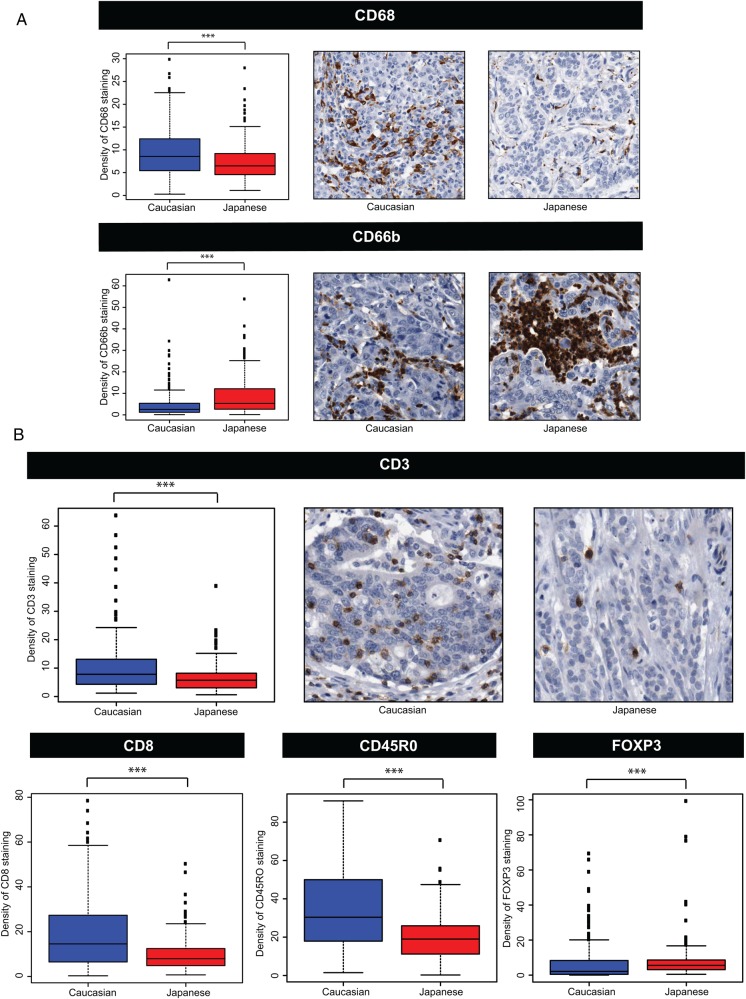
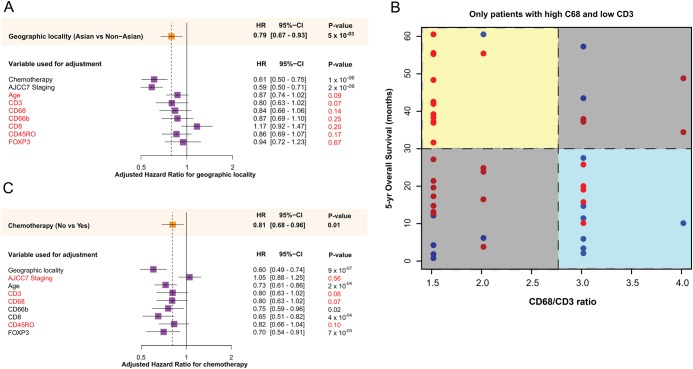
Results: Gene signatures differentially expressed between Asians and non-Asian GCs were related to immune function and inflammation. Non-Asian GCs were significantly enriched in signatures related to T-cell biology, including CTLA-4 signalling. Similarly, in the TMA cohorts, non-Asian GCs showed significantly higher expression of T-cell markers (CD3, CD45R0, CD8) and lower expression of the immunosuppressive T-regulatory cell marker FOXP3 compared to Asian GCs (p<0.05). Inflammatory cell markers CD66b and CD68 also exhibited significant cohort differences (p<0.05). Exploratory analyses revealed a significant relationship between tumour immunity factors, geographic locality-specific prognosis, and postchemotherapy outcomes.

Conclusions: Analyses of >1600 GCs suggest that Asian and non-Asian GCs exhibit distinct tumour immunity signatures related to T-cell function. These differences may influence geographical differences in clinical outcome, and the design of future trials particularly in immuno-oncology.

Keywords: GASTRIC CANCER; GENE EXPRESSION; IMMUNOLOGY; MOLECULAR MECHANISMS; MOLECULAR PATHOLOGY.


Figures

Figure 1
Figure 1
Five-year overall survival outcomes in the nine expression studies. Kaplan–Meier curves comparing Asian (red) versus non-Asian (blue) 5-year overall survival outcomes in the nine expression studies.
Figure 2
Figure 2
Schematic diagram of study. The study examined a total of nine microarray datasets (total n=1016), comprising cohorts from Asian and non-Asian localities. For the initial assessment (Stage 1), the four Affymetrix-based studies (total n=299) were considered. Stage 2 was a validation study assessing five non-Affymetrix platform studies (total n=717). Further validation was performed on two tissue microarray datasets (total n=665), comprising Caucasian and Japanese patients with gastric cancer.
Figure 3
Figure 3
Pathway analyses of Asian versus non-Asian gastric cancer (GC) profiles. Panel (A) illustrates Ingenuity Pathway Analysis (IPA) results; ‘inflammatory disease’ is among the top five diseases and disorders most commonly associated with both Asian and non-Asian GCs. However, non-Asian GCs are also enriched for ‘immunological disease’. For signalling pathways, T-cell-related canonical signalling pathways (eg, ‘CD28 Signalling in T-Helper Cells’, ‘CTLA-4 Signalling in Cytotoxic T-Cells’, ‘T-Cell Receptor Signalling’) feature prominently in the top five significant canonical pathways (Fisher's test p<0.05) in non-Asian tumours. Panel (B) shows results from GeneSet Enrichment Analysis (GSEA) for Affymetrix-based arrays. Interrogating MSigDB C2 (curated) genesets revealed multiple immune signatures (pale yellow bars; top diagram) among the top ten enriched genesets associated with non-Asian GCs, while such signatures are absent among Asian samples. Additionally, interrogating MSigDB C7 (immunological) genesets showed that the immune signatures observed in non-Asian GCs are enriched for T-cell-related signatures (light blue bars; bottom diagram) compared with Asian GCs. Panel (C) top diagram depicts GSEA results for non-Affymetrix-based arrays, when interrogated against C2 genesets. In general, immune signatures (pale yellow bars) are also enriched among the top ten genesets associated with non-Affymetrix non-Asian GCs. The top portion of the bottom diagram shows the running enrichment score (ES) for the T-cell-related pathway ‘GSE22886_NAIVE_CD4_TCELL_VS_MONOCYTE_UP’. The ES for the pathway is defined as the peak score furthest from zero. In this case, ES is significantly negative (normalised ES=−1.46; Familywise error rate (FWER) p value <0.05) that is, enriched in non-Asian GCs in the non-Affymetrix-based studies. This is shown in the middle portion of the plot (black vertical lines; ie, members of the geneset in order of appearance in the ranked list of genes) where most of the gene members appear after the peak score.
Figure 4
Figure 4
Immunohistochemical (IHC) assessments of immune and inflammatory cell populations in Caucasian and Japanese gastric cancer (GC) cohorts. Panel (A) depicts IHC assessment of tumour infiltration by macrophages (CD68) and neutrophils (CD66b) in Caucasian (blue) versus Japanese (red) cohorts. There is significantly more CD68 staining (top diagram) in Caucasian compared with Japanese GCs, and significantly more CD66b staining (bottom diagram) in Japanese compared with Caucasian GCs. These results suggest the presence of inflammation in both cohorts, but different cellular recruitment. Panel (B) illustrates results after quantitative IHC for T-cell-related immune markers, that is, CD3 (general T-cell marker; top diagram), CD8 (cytotoxic T-cell marker; bottom left diagram), CD45R0 (marker for memory T-cells; bottom middle diagram) and FOXP3 (marker for regulatory T-cells; bottom right diagram), in Caucasian (blue) and Japanese (red) cohorts. With the exception of FOXP3, all markers are significantly enriched in Caucasian GCs. For FOXP3, there is significantly more staining in the Japanese GC. For all cases, *** indicates a significant (Wilcoxon Mann–Whitney test p<0.05) difference in the extent of staining. Panels also show corresponding IHC images from Caucasian and Japanese cohorts.
Figure 5
Figure 5
Assessment of effect of immune factors on geographic locality-based and chemotherapy-based survival. Panel (A) illustrates a univariate Cox model fitted with only the geographic locality factor (orange box) and fitted, in turn, with each of the respective factors (eg, chemotherapy, TNM staging, age etc). Adjusted HRs and their corresponding p values for locality are presented. All factors causing a change in significance of locality-specific prognosis are coloured in red text. Panel (B); scatterplot of 5-year-overall survival (months) against CD68/CD3 ratios in the tissue microarray patient group (n=55) with high CD68 and low CD3 levels. There are more non-Asians (blue) than Asians (red) with higher CD68/CD3 ratios and low 5-year overall survival (light blue box). While those with lower CD68/CD3 ratios and high 5-year overall survival (light yellow box) tend to be Asians. Panel (C) illustrates a similar diagram to Panel (A), except a univariate Cox model is first fitted with the chemotherapy factor (orange box). Adjusted HRs and their corresponding p-values for chemotherapy are presented. All factors causing a change in significance of chemotherapy outcomes are coloured in red text.

Comment in

References

    1. Ferlay J, Soerjomataram I, Ervik M, et al. . Cancer Incidence and Mortality Worldwide: IARC CancerBase No. 11 2013.
    1. Greenlee RT, Hill-Harmon MB, Murray T, et al. . Cancer statistics, 2001. CA Cancer J Clin 2001;51:15–36. - PubMed
    1. Lee WJ, Lee WC, Houng SJ, et al. . Survival after resection of gastric cancer and prognostic relevance of systematic lymph node dissection: twenty years experience in Taiwan. World J Surg 1995;19:707–13. - PubMed
    1. Mok YJ, Koo BW, Whang CW, et al. . Cancer of the stomach: a review of two hospitals in Korea and Japan. World J Surg 1993;17:777–82. - PubMed
    1. Fuchs CS, Mayer RJ. Gastric carcinoma. N Engl J Med 1995;333:32–41. - PubMed

Publication types